Original Research Article - (2023) Volume 8, Issue 6
Received: 01-Nov-2023, Manuscript No. IJPHS-23-119920;
Editor assigned: 03-Nov-2023, Pre QC No. P-119920;
Reviewed: 15-Nov-2023, QC No. Q-119920;
Revised: 21-Nov-2023, Manuscript No. R-119920;
Published:
29-Nov-2023
, DOI: 10.37421/2736-6189.2023.8.354
Citation: Ferdjallah, Mohammed, Fuad Zeid and Asad Salem.
“Regression Analysis of Coal Production and Tobacco Smoking with Lung
Cancer in West Virginia, USA.” Int J Pub Health Safe 8 (2023): 354.
Copyright: © 2023 Ferdjallah M, et al. This is an open-access article distributed under the terms of the Creative Commons Attribution License, which permits unrestricted use, distribution, and reproduction in any medium, provided the original author and source are credited.
The objective of this study is to investigate the impacts of coal production on the prevalence of lung cancer in West Virginia, USA. It has been accepted that lung cancer is strongly correlated with tobacco smoking. In this study, we used linear regression analysis to estimate the degree of association of lung cancer incidence and tobacco smoking prevalence in the presence of coal production. We found that lung cancer association with tobacco smoking becomes stronger when coal production is considered in the producing coal counties. In coal non-producing counties, the association between lung cancer and tobacco smoking is not significant due to high variability of lung cancer incidence and limited availability of data. When we used a first order inverse distance to estimate the effective coal production in coal non-producing counties, we found a moderate correlation between lung cancer and tobacco smoking. The study results demonstrated that effects of coal production potentiate the association between tobacco smoking on lung cancer development.
Coal production • Lung cancer • Tobacco smoking • Linear regression analysis • GPS mapping
Lung cancer is a devastating disease that causes progressive breathing difficulty and pain to the patient [1,2]. Lung cancer complications often make the management of the disease very costly and intolerable [3]. Lung cancer not only affects the function of the lung but compromises the function of other organs, chiefly the heart and lead cardiovascular disease [4]. Patient habits and environmental causes often accelerate the effects of lung cancer [5]. In 2020, it is estimated that new cases of 197,453 and 136,084 Americans die because of lung cancer [6]. According to the 2021 National Institute of Health annual report the cost related to lung cancer health care is estimated to be 1.35 billion in 2019 [7]. Although lung cancer death has decreased the cost of management of patients with lung cancer is increasing. In particular, in West Virginia the rate of deaths from lung cancer is estimated at 1,339 deaths with 1,875 new cases, second only to Kentucky. The death from lung cancer is the highest in Kentucky followed by West Virginia. Although tobacco smoking has been identified as the primary cause of lung cancer, environmental and industrial pollutants seem to contribute to the statistics of lung cancer.
West Virginia economy relies mostly on coal industry for electric power. In fact, about 91% of electric power in WV comes from coal-fired electric power [8]. Although coal energy is in accelerating decline the effects of coal mining is yet to be determined [9]. Coal is classified as a nonrenewable energy extracted from sedimentary deposits. Coal consists mostly of carbon and hydrocarbon [10]. But it also contains other elements such as hydrogen, sulfur, oxygen and nitrogen in small amounts. Some of the largest coal deposits are located in many fields throughout the mid and western regions of the US. The biggest coal deposit by volume is in Wyoming and Montana. Large coal deposits can also be found in North Dakota, Montana, Ohio, Pennsylvania, West Virginia, Virginia, Alabama, Illinois and Indiana. Although coal is used in many industries, it is predominately used for electric power generation. It also can be used in cement, carbon fibers, foams, medicines, synthetic fuels and heating. The heat generated by the burning of coal turns turbines to transform mechanical energy to electric energy [11]. In 2021, over 22% of all electricity was produced from coal energy [12]. The efficiency of directly burning coal is less than 50% and depends on the pre- processing of coal and the plant itself [13]. Expensive integrated gasification combined cycle power plants gasify coal than burn it more efficiently to produce electricity and thus emit less pollutants [14].
The burning of coal generates burnt coal that contains moisture and millions of tons of ash, sulfur, phosphorus and many toxic gases and minerals [15,16]. The coal industry pollutes air and water. Furthermore, coal burning byproducts are often warehoused near the coal plants. Coal oxides byproducts directly affect the acidity of water systems and groundwater [17]. Consequently, coal mining, transporting, burning and storing cause major damage to human health, water resources, wild life and the environment [18]. Coal burning produces Carbon Dioxide (CO2) and Sulfur Dioxide (SO2). SO2 not only precipitates into acid rain and worsens the acidity of water resources, but also contributes to acidification of ecosystems. SO2 creates matter particulates of size 2.5 mm that invades human tissues and makes air pollution more dangerous. CO2 remains in the atmosphere as a greenhouse gas and contributes substantially to the worsening climate change [19].
Globally, untimely deaths and acute and chronic diseases are brought on by the mining and usage of coal [20,21]. More human deaths are even higher around coal power plants [22]. Coal plants pollutants trigger asthma, exasperate chronic obstructive pulmonary diseases and cause lung cancer [23]. Breathing coal dust causes pneumoconiosis or black lung in coal miners [24]. The leading cause of cancer-related fatalities globally is lung cancer, which is also the most often diagnosed cancer [25]. There are several types of lung cancer that preferentially attack the various cells of the lining or parenchymal tissues of the lungs [26]. Among the types of lung cancer, squamous cell carcinoma is highly associated with tobacco smoking and secondhand smoke [27]. Tobacco smoking contains carcinogens that cause immediate changes in the lung tissues [28]. It is believed that when the cells of the lungs are repeatedly exposed to smoking, it causes them to transform to cancerous cells that are more resilient. The risk factors of lung cancer include smoking, exposure to secondhand smoke, previous radiation therapy, exposure to asbestos and other carcinogens, dietary habits and family history of lung cancer [29-31]. In addition, lung cancer has been linked to continuous coal burning and ash and wood burning [32].
The purpose of this study is to investigate the impacts of coal production on the prevalence of lung cancer in West Virginia, USA. Linear regression analysis was used to estimate the degree of association of lung cancer incidence and tobacco smoking prevalence in the presence of coal production. Furthermore, a first order inverse distance was used to estimate the effective coal production in coal non-producing counties.
In this study we researched the association between lung cancer and coal production in the counties of West Virginia using regressing models adjusted to smoking as a confounding variable from the year 2012 through 2016 using federal, state and private data registries.
Study design
This study consisted of a retrospective analysis of data purged from federal and state agencies from 2012 to 2016. We used data from NIH Cancer Institute, West Virginia Department of Health, West Virginia Coal Association and West Virginia Office of Commerce resources and publications for this study. The NIH Cancer Institute maintains cancer registry for the US population. The West Virginia Department Health maintains specific data registry on burden and cost of cancer in the state of West Virginia. Both registries represent most cancers affecting the population of West Virginia per county. They also include selected socioeconomic characteristics of patients with cancer. In this study all patients of the state of West Virginia with lung cancer and bronchus from the year 2012 through 2016 are included. We used the West Virginia Department of Health to obtain the tobacco smoking prevalence per county from 2012 through 2016. We used the West Virginia Coal Association and the West Virginia Office of Department of Commerce capture yearly coal production per county between the year 2012 and 2016. Coal production represents the total production of ground and above ground mines.
Statistical analysis
We used descriptive statistics to evaluate the center of tendency and variability in the data. We assumed the data to be normally distributed. The association among lung cancer, smoking and coal production is estimated through multivariate regression models. In these regression models the outcome of lung cancer associations were separately performed to coal production and smoking rate and in combination to adjust for confounding effect of smoking. These models were applied in three cases of data stratifications: Group 1, Group 2 and Group 3. Group 1 consisted of coal producing counties. Group 2 consisted of coal non-producing counties. Group 3 consisted of all counties with effective-producing coal capacity estimated by the inverse distance method. For the coal non-producing counties, we used the inverse distance method to estimate the effective coal production that may have an impact on lung cancer incidence in the corresponding county. The implementation of the linear regression and inverse distance methods were detailed in the Data Mapping and Processing Section.
The linear regression analysis of lung cancer, coal production and smoking was performed in the three groups, where lung cancer incidence is the dependent variable and coal production and tobacco smoking are the independent variables. The p-values less than 0.05 were two-sided and considered statistically significant. We used Matlab R2023a (MathWorks, Inc., Natick, Massachusetts, USA) for data processing and statistical analysis.
Data mapping and processing
Prior to regression analysis, we normalized and standardized data to allow for comparison between the regression coefficients of the three groups. While normalization maintains a consistent format for the data, standardization assumes that the data is normally distributed [33,34]. Although health and social data may not be normally distributed, we visually inspected the residuals of the regression analysis to be either normal or near normal distributions around zero mean and quasi- constant variance [35]. We used multivariate linear regression models to estimate the degree of association between lung cancer, coal production and tobacco smoking. The following expression represents the linear regression model:
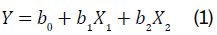
Y represents lung cancer incidence (dependent variable). X1 and X2 represent coal production (Tons) and tobacco smoking prevalence (independent variables) respectively. The parameters bi are the estimated regression coefficients and represent the change of lung cancer relative to a one- unit change in one independent variable while the other independent variable is kept constant at the same value.
To determine the degree of association between lung cancer and coal production and adjusted the confounding variable of tobacco smoking, we designed three data stratification cases. We designed the following data groups. The first group consists of the coal producing counties and ignoring the non-producing counties. In this group we only analyze the association between lung cancer and coal production and smoking in the coal producing counties. The second group consists of the non- producing coal counties only. In this group we analyze the association between long cancer and smoking. The third group consists of all counties. We used the inverse distance principle to estimate an effective (apparent) coal production amount. Not all counties produce coal. Actually, most counties do not produce coal for the lack of coal mines. The locations of all counties are geographically represented by the Global Positioning System (GPS). The inverse distance method is used to estimate data points based on weighted average using known data points. The inverse weighted distance expression is described by the following expressions as:
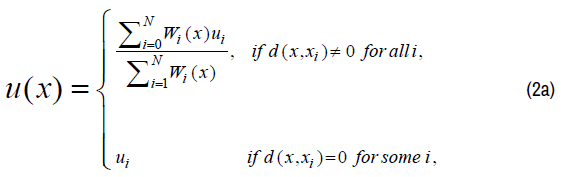
The inverse distance weight is described by the following expression as:
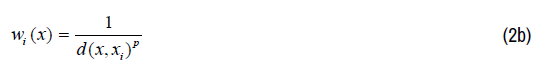
The effective total coal production for non-producing counties is estimated using the inverse distance weighting method for p=1. Thus, the effective coal production of a non-producing county is the amount of coal produced by the averaging principle, although there is no actual coal production in that county. We used the following expression to estimate the distance between each two counties, in miles, as:
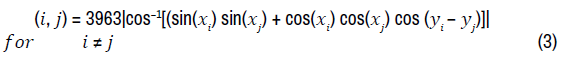
The variables xi and yi are the latitudes and longitudes data for each county in West Virginia.
Table 1 lists the mean and standard deviation values of coal production, tobacco prevalence, lung cancer incidence in the state of West Virginia for years 2012 to 2016. The descriptive statistics are listed for the coal producing and non-producing counties. For coal producing counties, coal production mean ranges from 4.0 to 5.0 million short tons with a standard deviation ranging from 4.4 to 5.0 million short tons. During the years of 2012 to 2016, West Virginia’s coal production represented over 13% of the total coal production of the USA and showed high variability due to changing demand, technology, competing energy resources, public concerns and workforce. Nonetheless, West Virginia’s coal production declined in 2016 by 22.5% as compared to its highest in 2014. In 2016, fewer counties produced coal. The mean and standard deviation values of tobacco prevalence and lung cancer incidence ranged from 0.357 (SD 0.050) to 0.360 (SD 0.056) and 82.89 (SD 16.43) to 83.95 (SD 17.11) respectively in the coal producing counties, whereas those in the coal non-producing counties ranged from 0.340 (SD 0.046) to 0.340 (SD 0.051) and 75.52 (SD 12.82) to 76.30 respectively. Lung cancer incidence mean values are about 10% less in the coal non-producing counties as compared to those in coal producing counties. However, they are still more than the average nationwide indicating coal production may play a role in the incidence of lung cancer.
| Year | Coal Production (Short tones × 106) |
Tobacco Prevalence (%) | Lung Cancer Incidence Rate (per 100,000) |
|---|---|---|---|
| 2012 - (Npc = 28) | 4.626 ± 4.997 | 0.357 ± 0.050 | 82.89 ± 16.43 |
| 2013 - (Npc = 25) | 4.814 ± 4.674 | 0.358 ± 0.053 | 83.92 ± 15.48 |
| 2014 - (Npc = 25) | 4.942 ± 4.878 | 0.358 ± 0.053 | 83.68 ± 15.75 |
| 2015 - (Npc = 25) | 4.118 ± 4.407 | 0.357 ± 0.054 | 83.06 ± 17.14 |
| 2016 - (Npc = 22) | 4.019 ± 4.460 | 0.360 ± 0.056 | 83.95 ± 17.11 |
| 2012 - (Nnpc=27) | - | 0.340 ± 0.051 | 75.69 ± 11.74 |
| 2013 - (Nnpc=30) | - | 0.340 ± 0.048 | 75.56 ± 12.96 |
| 2014 - (Nnpc=30) | - | 0.340 ± 0.048 | 75.52 ± 12.82 |
| 2015 - (Nnpc=30) | - | 0.340 ± 0.048 | 76.30 ± 12.67 |
| 2016 - (Nnpc = 33) | - | 0.340 ± 0.046 | 75.74 ± 14.26 |
Figures 1-3 represent illustrations of colour mapped gradient of coal production, lung cancer incidence and tobacco smoking rate respectively for all counties of West Virginia during 2016. A quantitative association between coal production and lung cancer incidence may be seen in Figures 1 and 2. Figure 4 shows the changes of tobacco smoking rate and lung cancer incidence as functions of increasing coal production in coal producing counties only. Table 2 lists the results of the linear regression analysis of normalized coal production, tobacco prevalence and lung cancer incidence data for the years 2012 to 2016. When only coal production is considered as the independent variable, the R2 and adjusted R2 values are less than 0.1 with (p>0.05) indicating that the association between coal production and lung cancer incidence is weak and without no statistical significance. Without considering other variables, coal production does not seem to be a risk for lung cancer incidence. The R2 and adjusted R2 values are low indicating that the correlation between lung cancer incidence and coal production is poor due to collinearity between the data vectors. We attribute the low values of R2 not only to the factors associated with coal production but also to the limited data available in state and federal registries. The factors associated with coal production include transportation, dust, climate conditions, particulate size and coal burning by-products. The negative adjusted R2 values indicate that these factors may be independent and have different impacts on lung cancer incidence.

Figure 1. Illustration of coal production (million short tons) per county in West Virginia, USA, during 2016.

Figure 3. Illustration of tobacco smoking rate (percentage) per county in West Virginia, USA, during 2016.
| Lung Cancer | Coefficient(s) | P value | RMS-error | R2 | Adjusted R2 | |
|---|---|---|---|---|---|---|
| 2012 | Coal | 0.358 | 0.051 | 0.265 | 0.138 | 0.105 |
| Tobacco | 0.688 | 0.004 | 0.242 | 0.285 | 0.257 | |
| Coal, Tobacco | 0.396 | 0.01 | 0.215 | 0.453 | 0.409 | |
| 0.725 | 0.001 | - | - | - | ||
| 2013 | Coal | 0.271 | 0.224 | 0.287 | 0.064 | 0.023 |
| Tobacco | 0.673 | 0.007 | 0.253 | 0.276 | 0.245 | |
| Coal, Tobacco | 0.391 | 0.04 | 0.234 | 0.404 | 0.35 | |
| 0.761 | 0.002 | - | - | - | ||
| 2014 | Coal | 0.122 | 0.581 | 0.307 | 0.013 | -0.03 |
| Tobacco | 0.702 | 0.007 | 0.263 | 0.277 | 0.245 | |
| Coal, Tobacco | 0.3 | 0.124 | 0.255 | 0.352 | 0.293 | |
| 0.809 | 0.003 | - | - | - | ||
| 2015 | Coal | 0.048 | 0.822 | 0.277 | 0.002 | -0.041 |
| Tobacco | 0.63 | 0.006 | 0.235 | 0.284 | 0.252 | |
| Coal, Tobacco | 0.207 | 0.271 | 0.233 | 0.323 | 0.261 | |
| 0.696 | 0.004 | - | - | - | ||
| 2017 | Coal | -0.156 | 0.543 | 0.307 | 0.019 | -0.03 |
| Tobacco | 0.67 | 0.01 | 0.262 | 0.287 | 0.251 | |
| Coal, Tobacco | 0.098 | 0.687 | 0.267 | 0.293 | 0.218 | |
| 0.712 | 0.014 | - | - | - |
When tobacco smoking rate is considered as the only independent variable, it is strongly correlated to lung cancer incidence with a coefficient of correlation ranging from 0.630 to 0.702 and R2 and adjusted R2 values ranging from 0.276 to 0.287 and 0.245 to 0.257 respectively (p<0.05). This study corroborates the association between lung cancer incidence and tobacco smoking rate. When the linear regression analysis is implemented with both coal production and tobacco prevalence as independent variables and lung cancer incidence as the dependent variable, the R2 and adjusted R2 values significantly (p<0.05) increased from 0.293 to 0.453 and 0.218 to 0.409 respectively. Similarly, the coefficient of correlation between coal production and lung cancer in the presence of tobacco smoking increased significantly during the years 2012 to 2014, but for the years 2015 and 2016 did not showed a statistical significance perhaps due to decreased coal production. Table 3 lists the results of the linear regression analysis of standardized coal production, tobacco prevalence and lung cancer incidence data for the years 2012 to 2016. Similar patterns were observed substantiating the results of the normalization method.
| Lung Cancer | Coefficient(s) | P value | RMS-error | R2 | Adjusted R2 | |
|---|---|---|---|---|---|---|
| 2012 | Coal | 0.023 | 0.051 | 0.058 | 0.138 | 0.105 |
| Tobacco | 0.033 | 0.004 | 0.053 | 0.285 | 0.257 | |
| Coal, Tobacco | 0.025 | 0.01 | 0.047 | 0.453 | 0.409 | |
| 0.034 | 0.001 | - | - | - | ||
| 2013 | Coal | 0.016 | 0.224 | 0.287 | 0.064 | 0.023 |
| Tobacco | 0.034 | 0.007 | 0.056 | 0.276 | 0.245 | |
| Coal, Tobacco | 0.024 | 0.041 | 0.234 | 0.404 | 0.35 | |
| 0.038 | 0.002 | - | - | - | ||
| 2014 | Coal | 0.007 | 0.581 | 0.064 | 0.013 | -0.03 |
| Tobacco | 0.033 | 0.007 | 0.055 | 0.277 | 0.245 | |
| Coal, Tobacco | 0.018 | 0.124 | 0.053 | 0.352 | 0.293 | |
| 0.039 | 0.003 | - | - | - | ||
| 2015 | Coal | 0.003 | 0.822 | 0.06 | 0.002 | -0.041 |
| Tobacco | 0.031 | 0.006 | 0.05 | 0.284 | 0.252 | |
| Coal, Tobacco | 0.012 | 0.271 | 0.05 | 0.323 | 0.261 | |
| 0.034 | 0.004 | - | - | - | ||
| 2016 | Coal | -0.008 | 0.543 | 0.059 | 0.019 | -0.03 |
| Tobacco | 0.031 | 0.01 | 0.051 | 0.287 | 0.251 | |
| Coal, Tobacco | 0.005 | 0.687 | 0.052 | 0.293 | 0.218 | |
| 0.033 | 0.014 | - | - | - |
Tables 4 and 5 list the linear regression analysis of normalized and standardized tobacco smoking prevalence and lung cancer incidence in the coal non-producing counties. No statistical significance was found between tobacco smoking prevalence and lung cancer incidence. The R2 and adjusted R2 values were less than 0.02 (with the exception of 2016) suggesting the lack of correlation between tobacco smoking and lung cancer contrary to common findings. The lack of statistical significance (p>0.05) is, perhaps, due to missing data and high variability with respect to the mean as illustrated in Table 1. The lack of statistical significance does not remove the risk of tobacco smoking on lung cancer. We expected that the high variability in lung cancer incidence and the small size of data played a role in the lack of significance in the results of the regression analysis. Not surprisingly, the lack of statistical significance may actually substantiate the potentiating role of coal production on lung cancer incidence even in the coal non-producing counties as well. It is clear that, although the coal non-producing counties do not produce coal, the effects of coal production in the nearby counties may have played a significant role that needs to be estimated from the coal producing counties.
| Lung Cancer vs. Tobacco | Coefficient(s) | P value | RMS-error | R2 | Adjusted R2 |
|---|---|---|---|---|---|
| 2012 - (Nnpc=27) | 0.058 | 0.795 | 0.247 | 0.003 | -0.037 |
| 2013 - (Nnpc=30) | 0.137 | 0.526 | 0.245 | 0.015 | 0.021 |
| 2014 - (Nnpc=30) | 0.111 | 0.597 | 0.238 | 0.01 | -0.025 |
| 2015 - (Nnpc=30) | 0.071 | 0.741 | 0.242 | 0.004 | -0.032 |
| 2016 - (Nnpc=33) | 0.67 | 0.01 | 0.262 | 0.287 | 0.251 |
| Lung Cancer vs. Tobacco | Coefficient(s) | P value | RMS-error | R2 | Adjusted R2 |
|---|---|---|---|---|---|
| 2012 - (Nnpc = 27) | 4.46e-03 | 0.795 | 0.087 | 0.003 | -0.037 |
| 2013 - (Nnpc = 30) | 9.29e-03 | 0.526 | 0.078 | 0.015 | 0.021 |
| 2014 - (Nnpc = 30) | 7.85e-03 | 0.597 | 0.079 | 0.01 | -0.025 |
| 2015 - (Nnpc = 30) | 4.56e-03 | 0.741 | 0.08 | 0.004 | -0.032 |
| 2016 - (Nnpc = 33) | 3.13e-03 | 0.01 | 0.051 | 0.287 | 0.251 |
The linear regression analysis of the producing counties shows that tobacco smoking prevalence is moderately associated with lung cancer incidence when considered alone as an independent variable. That correlation increased significantly when both coal production and tobacco smoking prevalence are included in the regression analysis as independent variables, indicating that there is an added effect from coal production. We expanded the regression analysis to all counties using a first order distance method to estimate an effective coal production in coal non-producing counties. The effective coal production is not real, but rather it is an amount of coal that would have been produced by a coal non-producing county using the nearby coal producing counties. Figure 5 shows the changes of tobacco smoking prevalence and lung cancer incidence as functions of increasing coal production (real and effective) in all counties. Figures 4 and 5 were plotted as scattered diagrams to illustrate the degree of linearity of lung cancer incidence, tobacco smoking and coal production as functions of increasing coal production further strengthening the normality of data.
Table 6 lists the results of the linear regression analysis of normalized coal production (real and effective), tobacco prevalence and lung cancer incidence data for the years 2012 to 2016 for all counties. Except for the years 2012 and 2013, coal production (real and effective) still did not show a statistical association with lung cancer incidence when considered as the only independent variable. The corresponding R2 and adjusted R2 values were less than 0.13. Tobacco prevalence is somewhat correlated to lung cancer incidence with a coefficient of correlation ranging from 0.358 to 0.390 and R2 and adjusted R2 values ranging from 0.114 to 0.135 and 0.098 to 0.118 respectively (p<0.05). The correlation between tobacco smoking prevalence and lung cancer increased slightly when coal production (real and effective) was added as an independent variable (Table 7). Although the association between tobacco smoking prevalence and lung cancer incidence was lower than of that of coal producing counties nonetheless it demonstrated that lung cancer incidence in coal non-producing counties may have been affected by coal by-products that may have reached them. The first order inverse distance, used in this study, suggests that the effects of coal production decreased by 90% at 10 miles away. However, recently studies have demonstrated that coal dust may travel more than 30 miles under normal conditions. Nonetheless, the results of the linear regression analysis demonstrated the potentiating effect of coal production on tobacco smoking and increase the risk of developing lung cancer in West Virginia.
| Lung Cancer (all) | Coefficient(s) | P value | RMS-error | R2 | Adjusted R2 | |
|---|---|---|---|---|---|---|
| 2012 | Coal | 0.371 | 0.008 | 0.217 | 0.127 | 0.11 |
| Tobacco | 0.39 | 0.006 | 0.216 | 0.135 | 0.118 | |
| Coal, Tobacco | 0.361 | 0.006 | 0.202 | 0.255 | 0.227 | |
| 0.38 | 0.004 | - | - | - | ||
| 2013 | Coal | 0.32 | 0.039 | 0.223 | 0.078 | 0.061 |
| Tobacco | 0.39 | 0.006 | 0.216 | 0.135 | 0.118 | |
| Coal, Tobacco | 0.334 | 0.021 | 0.208 | 0.213 | 0.183 | |
| 0.4 | 0.003 | - | - | - | ||
| 2014 | Coal | 0.203 | 0.172 | 0.217 | 0.035 | 0.017 |
| Tobacco | 0.384 | 0.007 | 0.217 | 0.13 | 0.113 | |
| Coal, Tobacco | 0.241 | 0.085 | 0.213 | 0.179 | 0.147 | |
| 0.41 | 0.004 | - | - | - | ||
| 2015 | Coal | 0.135 | 0.41 | 0.233 | 0.013 | -0.006 |
| Tobacco | 0.373 | 0.009 | 0.22 | 0.121 | 0.104 | |
| Coal, Tobacco | 0.181 | 0.244 | 0.219 | 0.144 | 0.119 | |
| 0.391 | 0.007 | - | - | - | ||
| 2016 | Coal | 0.024 | 0.889 | 0.231 | 3.70E-04 | -0.019 |
| Tobacco | 0.358 | 0.012 | 0.218 | 0.114 | 0.098 | |
| Coal, Tobacco | 0.097 | 0.558 | 0.219 | 0.12 | 0.086 | |
| 0.371 | 0.011 | - | - | - |
| Lung Cancer (all) | Coefficient(s) | P value | RMS-error | R2 | Adjusted R2 | |
|---|---|---|---|---|---|---|
| 2012 | Coal | 0.356 | 0.008 | 0.946 | 0.127 | 0.11 |
| Tobacco | 0.367 | 0.006 | 0.939 | 0.135 | 0.118 | |
| Coal, Tobacco | 0.347 | 0.006 | 0.88 | 0.255 | 0.226 | |
| 0.366 | 0.004 | - | - | - | ||
| 2013 | Coal | 0.259 | 0.039 | 0.969 | 0.078 | 0.061 |
| Tobacco | 0.367 | 0.006 | 0.939 | 0.135 | 0.118 | |
| Coal, Tobacco | 0.291 | 0.021 | 0.9 | 0.219 | 0.189 | |
| 0.376 | 0.003 | - | - | - | ||
| 2014 | Coal | 0.187 | 0.172 | 0.992 | 0.035 | 0.016 |
| Tobacco | 0.36 | 0.007 | 0.942 | 0.13 | 0.113 | |
| Coal, Tobacco | 0.222 | 0.085 | 0.924 | 0.179 | 0.147 | |
| 0.381 | 0.004 | - | - | - | ||
| 2015 | Coal | 0.113 | 0.41 | 1 | 0.013 | -0.006 |
| Tobacco | 0.348 | 0.009 | 0.946 | 0.121 | 0.104 | |
| Coal, Tobacco | 0.152 | 0.244 | 0.943 | 0.144 | 0.111 | |
| 0.364 | 0.007 | - | - | - | ||
| 2016 | Coal | 0.019 | 0.889 | 1.01 | 3.70E-04 | -0.019 |
| Tobacco | 0.338 | 0.012 | 0.95 | 0.114 | 0.098 | |
| Coal, Tobacco | 0.078 | 0.558 | 0.956 | 0.12 | 0.086 | |
| 0.351 | 0.01 | - | - | - |
We believe that this study is the first in looking into the combined association of coal production and tobacco smoking prevalence with lung cancer incidence in West Virginia. We implemented linear regression analysis to estimate the degree of association of lung cancer incidence and tobacco smoking prevalence in the presence of coal production. We also designed averaging methods to estimate the effects of coal production from coal producing counties on coal non- producing counties. We found that lung cancer association with tobacco smoking becomes stronger when coal production is considered in the producing coal counties. In coal non-producing counties, the association between lung cancer and tobacco smoking is not significant due to high variability of lung cancer incidence in limited data. When we used a first order inverse distance to estimate the effective coal production in coal nonproducing counties, we found a moderate correlation between lung cancer and tobacco smoking. We recognize that R2 and adjust R2 values are low between lung cancer incidence and coal production. We attribute this fact not only to the non-accounted factors associated with goal production but also to the limited data available in state and federal registries. Nonetheless, despite the limited data, this study has demonstrated the potentiating effect of coal production and tobaccos smoking on lung cancer development. The limited energy resources of West Virginia, coal burning will continue to be the prime source of electricity. Our future work is to design controlled studies to mitigate the effects of coal production factors and coal mining on lung cancer incidence.
Mohammad Zeid and Samantha Saunders participated in data collection and tabulation.
The authors have no conflict of interest to disclose.
The authors did NOT receive any funding for this study.
Google Scholar, Crossref, Indexed at
Google Scholar, Crossref, Indexed at
Google Scholar, Crossref, Indexed at
Google Scholar, Crossref, Indexed at
Google Scholar, Crossref, Indexed at
Google Scholar, Crossref, Indexed at
Google Scholar, Crossref, Indexed at
Google Scholar, Crossref, Indexed at
Google Scholar, Crossref, Indexed at
Google Scholar, Crossref, Indexed at
Google Scholar, Crossref, Indexed at
Google Scholar, Crossref, Indexed at
Google Scholar, Crossref, Indexed at
Google Scholar, Crossref, Indexed at
Google Scholar, Crossref, Indexed at
Google Scholar, Crossref, Indexed at
Google Scholar, Crossref, Indexed at
Google Scholar, Crossref, Indexed at
Google Scholar, Crossref, Indexed at
Google Scholar, Crossref, Indexed at
Google Scholar, Crossref, Indexed at
Google Scholar, Crossref, Indexed at
Google Scholar, Crossref, Indexed at
Google Scholar, Crossref, Indexed at
Google Scholar, Crossref, Indexed at
Google Scholar, Crossref, Indexed at
Google Scholar, Crossref, Indexed at
Google Scholar, Crossref, Indexed at