Research - (2020) Volume 5, Issue 6
Received: 26-Oct-2020
Published:
07-Dec-2020
, DOI: 10.37421/2736-6189.2020.5.202
Citation: Amare Wubishet Ayele, Mulugeta Aklilu Zewdie and Tizazu Bayko. “Modeling and Forecasting the Global Daily Incidence of Novel Coronavirus Disease (COVID-19): An Application of Autoregressive Moving Average (ARMA) Model”. Int J Pub Health Safety 5 (2020): 202.
Copyright: © 2020 Ayele AW, et al. This is an open-access article distributed under the terms of the Creative Commons Attribution License, which permits unrestricted use, distribution, and reproduction in any medium, provided the original author and source are credited.
Background: Coronavirus disease (Covid-19) is a public health epidemic outbreak and is currently a concern of the international community. As of 23 March 2020, the number of confirmed cases of COVID-19 has reached more than 300,000 worldwide. This burden crates high stress in the global community, and is having a significant impact on the global economy. This paper pursued to obtain a time series model that able to model and forecast the global daily incidence of Novel Coronavirus disease (COVID-19).
Methods: Global daily number of confirmed cases and deaths from Novel Coronavirus (COVID-19) reported during the study period from 22 January 2020 to 22 March 2020 were considered. A time series model namely an Autoregressive Moving Average (ARMA) Model was employed to model and forecast the daily global incidence of COVID-19. Various ARMA models were considered with different lag order specification, and the best model was considered using the Akaike's information criterion (AIC) and Bayesian information criterion (BIC).
Results: A dramatic rise in the number of confirmed cases and deaths per day from COVID-19 was observed around the globe during the study period. In the analysis, the log-transformed value of the series was considered, and relatively stable variations were found around the mean of the series. The ARMA (2, 3) and ARMA (2, 2) model for the daily reported death and confirmed cases series were obtained as a best model respectively. The incidence of death from COVID-19 is substantially impacted by the past two AR lags (AR(1)= 0.208 and AR(2)=0.68 ) and the past three shocks/MA (MA(1)=0.899, MA(2)=0.397, and MA(3)=0.449,).
Conclusions: The global incidence of Novel Corona virus (COVID-19) has risen significantly over the study period and needs to be strongly underscored. The forecast value shows a dramatic rise in the incidence of COVID-19 for the next 2 months. This study warns the body concerned to the need for a high degree of action to prevent the spread of coronavirus with possible intervention. The prevention strategies that help to curb the virus identified by world health organization (WHO) should be implemented basically in the global community with optimal resource utilization.
ARMA model • COVID-19 • Forecast • Incidence • Modelling
Coronavirus disease 2019 (COVID-19) is an infectious and respiratory disease, and most infected people will develop mild to moderate symptoms and recover without requiring special treatment [1,2]. The virus that causes COVID-19 is a novel coronavirus that was first identified during an investigation into an outbreak in Wuhan, China [3-5]. Currently, it is affecting more than 192 countries and territories around the world.
As pandemic Coronavirus Disease (COVID-19) continues to evolve, WHO is committed to working on emergency preparedness and response with the health, transportation, and tourism sectors [6]. As a policy, the WHO strongly recommends early detection, isolation and treatment for patients, and resolving important clinical seriousness unknowns, and transmitting important risk and incident knowledge to all populations and combating disinformation [7,8].
As of 23 March 2020, the number of confirmed cases of COVID-19 has reached more than 300,000 worldwide. Since the outbreak was first reported on December 31, 2019, as reported to the WHO on 23 March 2020 by national authorities, 332, 930 confirmed cases were identified worldwide and 14,509 deaths are registered [9]. In the current situation where COVID-19 is rapidly spreading worldwide and the number of cases in Europe and other continents is rising with increasing pace in several affected areas, there is a need for immediate targeted action [10].
A significant number of employees today are in quarantine unable to sustain the country's economic operation in most parts of the globe [11]. In addition, the Coronavirus COVID-19 outbreak poses a significant and growing threat for the tourism industry [12]. This situation may create political and economic pressure especially in developing countries. In line with this, numerous attempts have been made and still ongoing by the bodies concerned to decrease the incidence of COVID-19, but the prevalence of the disease is growing rapidly across the globe. To the best of our knowledge, less is done to model and forecast the global incidence of COVID-19 as well as less is documented in structured form through sophisticated time series model for the incidence of the pandemic. Therefore, this manuscript tries to obtain a time series model that able to model and forecast the number of global daily incidence of Novel Coronavirus disease (COVID-19).
Taking the objectives into account, this paper contributes the following elements to the scientific literature:
• The estimated future incidence of the disease (confirmed cases, and number of death from COVID-19) are predicted in this work, and this result is very useful for health policy makers and researchers,
• From a statistical modeling point of view, this paper demonstrates the realistic application of the time series model, namely the ARMA model, to predict the pandemic incidence,
• Furthermore, the result of this study will be used as a basis for further study in this area, as well as for other pandemic.
Data source and study site
Data for this study were freely accessed from the Johns Hopkins University Center for Systems Science and Engineering (JHU CCSE) website. JHU CCSE organizes the reported data sets from various sources including the World Health Organization (WHO), DXY.cn. Pneumonia. 2020, National Health Commission of the People’s Republic of China (NHC), Australia Government Department of Health, European Centre for Disease Prevention and Control (ECDC), Ministry of Health Singapore (MOH) (https://data.humdata.org/dataset/novel-coronavirus-2019-ncovcases). This study includes the daily reported cases (only confirmed cases for COVID-19) and deaths from Novel Corona virus (COVID-19), over the period from January 22, 2020 to March 22, 2020. The study site includes region that reported cases and deaths from COVID-19 in the globe before 23, march 2020, as the map as shown in Figure 1.

Figure 1. Countries, territories or areas with reported confirmed cases of COVID-19, 23 March 2020.
Outcome variables
The outcome variables for this stud are the number of confirmed cases (number of persons with laboratory evidence of COVID-19 infection, regardless of clinical signs and symptoms), and number of death from COVID-19 (number of persons who pause all human biological functions to survive as a living organism primarily due to COVID-19) over the study period in the globe.
Data analysis
Data was accessed in Microsoft Excel 2013, and analyzed in EViews 8 and R 3.6.1 statistical software version 8. In literature, there are several procedures which have been developed for testing the stationarity the time series data [13-15]. In this study, the Augmented Dickey- Fuller (ADF) test due to Dickey and Fuller [16], and the Phillip-Perron (PP) test due to Phillips and Perron[17] tests were considered for testing the stationarity of the series.
We employed a time series model namely an autoregressive moving average (ARMA) model to model and forecast the incidence of COVID-19 over the study period. This model was introduced in 1960’s by Box-Jenkins, states that the current value of the series Yt depends linearly on its own previous values plus a combination of current and previous values of a white noise error term [18-20]. The Box-Jenkins methodology uses a three step iterative approaches: model identification, parameter estimation and diagnostic checking to determine the best parsimonious model from a general class of ARIMA models [21-23]. Lastly, the final best selected model can be used for forecasting future values of the time series [24].
An autoregressive (AR) model is one where the current value of a variable Yt depends upon on the values of the p past values of the variable plus an error term. Specifically an AR model of order p, denoted as AR (p), can be expressed as [24,25]:
 (1)
(1)
where Yt represents the current value of the series; Yt-1,Yt-2,Yt-p denotes the past values of the same series; α1, α2 ... αP are the regression coefficients that shows the effect of past values of the series on the current value of the series; εt is a white noise disturbance term and it is independent of the past values of the response variable.
A time series Yt is said to be a moving average process of order q if it is a weighted linear sum of the last q random shocks /errors. The moving average process of order q, denoted as MA (q), can be expressed as [25-27]:
 (2)
(2)
Where q is the number of past innovations included in the moving average. β1, β2, …, βq are the MA parameters (coefficients) which describe the effect of the past innovations on Yt and εt and is the error term which is assumed as a white noise process. A stationary process Yt is called an ARMA (p, q) process that blend both the AR process order p and moving average process order q is given as:
 (3)
(3)
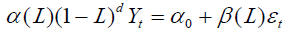
If a non-stationary time series has to be differenced d times to make it stationary, that time series is said to be integrated of order d and denoted as I (d) [28,29], then the model for the original undifferenced series is said to be an ARIMA(p, d, q) process. The general form of ARIMA (p, d, q) process is given by:
 (4)
(4)
α(L)) and β(L) are polynomials in L of finite order p and q, respectively, defined by and

Finally, in this study model identification was performed by considering parsimonious principle. According to this principle, always the model with smallest possible number of parameters is to be selected so as to provide an adequate representation of the underlying time series data [30,31]. We employed maximum likelihood (ML) methods to estimate the unknown parameters, and tests related to serial correlation through Breusch-Godfrey LM, and test of normality for residuals was performed using the Jarque- Bera test.
Ethical Statement
The data used in this study was accessed from JHU CCSE website only for research purpose. The study did not need ethical scrutiny because the data used never had identities associated with the person or confidential human biological materials.
The daily number of confirmed cases and deaths from COVID-19 time dependent data consisted of 61 data points for the period from January 22, 2020 to March 22, 2020 were considered. The time plot of the data showed an intense increase of incidence both in the number of confirmed cases (right plot in Figure 2) and deaths from COVID-19 (left plot in Figure 2) over the study period.

Figure 2. Time plot for the actual number of cases and deaths in Coronavirus (COVID-19) reported over the study period.
Unit root test for non-stationarity
The time series under consideration should be checked for stationarity before one attempt to fit a suitable model. That is, variables have to be tested for the presence of unit root(s) and the order of integration for each series should be determined. The unit root tests first impose the null hypothesis that the series has a unit root problem, versus the alternative hypothesis that the series is stationary. The untransformed series of both the series has a unit root problem as confirmed from Augmented Dickey-Fuller test (ADF) and Phillip Perron (PP) test (Table 1). The log-transformed value of both the series achieved the stationarity condition as confirmed from the ADF and PP tests (Table 1). As we can see from Table 1, the null hypothesis of unit root is rejected at the 1% level of significance for both variables for after log transformation. Thus, both the log transformed series of number of confirmed cases and deaths from COVID-19 achieved stationary.
| Variables | Untransformed Series | Log-transformed series | ||||||
|---|---|---|---|---|---|---|---|---|
| ADF Test | PP Test | ADF Test | PP Test | |||||
| t-stat | P -value | t-stat | P -value | t-statistic | P -value | t-statistic | P -value | |
| Confirmed Cases | 1.407 | 0.998 | -0.186 | 0.934 | -8.386 | 0.0001 | -6.617 | 0.0001 |
| Death | 5.743 | 0.999 | 3.681 | 0.981 | -6.909 | 0.0001 | -5.530 | 0.0001 |
Model identification
The value of the series for current time will depend on the value of the series in previous periods (autoregressive component) and the error terms in current and previous periods (moving average component) [32,33]. In this study, to specify the mean equation for the series, comparison of various AR (p), MA (q) and ARMA (p, q) models are performed and the one with smallest information criteria is selected [26,34,35].
To estimate the time series model which is appropriate for our series, a parsimonious model with lower order ARMA models are considered. In this study, the fifteen combinations with different lag order specification AR (0-3) and MA (0-3) were considered (Table 2). Of the models considered, the AIC and BIC statistics confirmed that ARMA (2, 3) and ARMA (2, 2) model for daily reported death and confirmed cases series had the minimum information criteria respectively (Table 2).
| Models | Death Series | Case series | ||||||
|---|---|---|---|---|---|---|---|---|
| LL | Df | AIC | BIC | LL | Df | AIC | BIC | |
| ARMA(1, 0) | 23.53076 | 3 | -41.0615 | -34.7289 | 20.62315 | 3 | -35.246 | -28.9137 |
| ARMA(1, 1) | 40.66159 | 4 | -73.3232 | -64.8797 | 33.58823 | 4 | -59.176 | -50.733 |
| ARMA(1,2) | 44.94865 | 5 | -79.8973 | -69.3429 | 43.02623 | 5 | -76.052 | -65.4981 |
| ARMA(1,3) | 57.36372 | 6 | -102.727 | -90.0622 | 48.50586 | 6 | -85.011 | -72.3465 |
| ARMA(2, 0) | 53.96174 | 4 | -99.9235 | -91.48 | 49.19893 | 4 | -90.397 | -81.9544 |
| ARMA(2, 1) | 61.98009 | 5 | -113.96 | -103.406 | 59.03069 | 5 | -108.06 | -97.507 |
| ARMA(2,2) | 62.54273 | 6 | -113.086 | -100.42 | 60.57693 | 6 | -109.15 | -96.4886 |
| ARMA(2,3) | 65.84957 | 7 | -117.699 | -102.923 | 60.5686 | 7 | -107.13 | -92.3611 |
| ARMA(3,0) | 58.6548 | 5 | -107.31 | -96.7552 | 58.79933 | 5 | -107.59 | -97.0443 |
| ARMA(3, 1) | 58.6391 | 6 | -105.278 | -92.613 | 60.63337 | 6 | -109.26* | -96.6015 |
| ARMA(3, 2) | 62.57443 | 7 | -111.149 | -96.3727 | 62.31768 | 7 | -1.9764 | -1.79885 |
| ARMA(3, 3) | 62.6613 | 8 | -109.323 | -92.4356 | 68.18344 | 8 | -2.1442 | -2.14426 |
| ARMA(0, 1) | -78.5701 | 2 | 161.1401 | 165.3619 | -73.6479 | 2 | 151.295 | 155.5174 |
| ARMA(0, 2) | -48.3419 | 3 | 102.6837 | 109.0163 | -42.7153 | 3 | 91.4306 | 97.76325 |
| ARMA(0, 3) | -21.0312 | 3 | 48.06232 | 54.39494 | -18.9155 | 4 | 45.8310 | 54.2745 |
| AIC: Akaike's information criterion, BIC: Bayesian information criterion, LL: Log likelihood, Df: Degrees of freedom, ‘*’ indicates models in the presence of serial correlation in the residuals | ||||||||
Model diagnostics
Before we consider the fitted model as a better fit and interpret its findings, it is essential to check whether the model is correctly specified, that is, whether the model assumptions are supported by the data. If some key model assumptions seem to be violated, then a new model should be specified until it provides an adequate fit to the data.
The presence of serial correlation in the residuals was tested using the Lagrange Multiplier (LM) and Ljung-Box test for each of the tentatively selected ARMA models namely ARMA (2, 3) and ARMA (2, 2) for daily reported death and confirmed cases series respectively. The null hypothesis asserts that there is no serial correlation in the residual series up to lag 3.
The Breusch–Godfrey serial correlation LM test results in Table 3 provide evidence that there is no serial correlation in the residuals of the mean equation. Besides, the Ljung-Box test (Figure 3) indicates for death (right plot of Figure 4) and confirmed cases (left plot of Figure 4) series that there is no significant serial correlation up to 16 at 1% level of significance. Hence, there is no significant serial correlation in the residuals.
| Lag | Death series | Case series | ||
|---|---|---|---|---|
| F-statistic | x2 statistic | F-statistic | x2 statistic | |
| 1 | 0.901(0.347) | 0.991(0.319) | 0.434(0.513) | 0.478(0.489) |
| 2 | 1.579(0.216) | 3.428(0.1801) | 0.738(0.483) | 1.628(0.443) |
| 3 | 1.046(0.3805) | 3.471(0.3245) | 1.387(0.257) | 4.451(0.217) |
| values inside the bracket are p-values | ||||

Figure 3. Ljung-Box test for the presence of serial correlation in the residuals of the fitted model.

Figure 4. Histogram of residuals and diagnostic test for normality of residuals from ARMA (2, 3) model for log-transformed death series.
To investigate whether the residuals of the fitted model (mean equation) are normally distributed, the Jarque-Bera test has been applied. As we can see from Figure 4 & 5 that the Jarque-Bera statistic is not significant (JB=2.892, p=0.2355 for confirmed case; JB=2.245, p=0.325 for death series).There is no significant evidence to reject the null hypothesis of normality. The Jarque-Bera test confirmed that the residuals of the fitted model are normally distributed for both of the series under consideration.

Figure 5. Histogram of residuals and diagnostic test for normality of residuals from ARMA (2, 2) model for log-transformed confirmed case series.
Parameter estimation
The parameter estimates for Box-Jenkins models are usually obtained by maximum likelihood method. Hence, we use maximum likelihood estimation method to estimate the parameters for our series. The results are summarized in Table 4.
| Variables | Variable | Coefficient | Std. Error | t-Statistic | Prob. |
|---|---|---|---|---|---|
| Death | C | 12.38183 | 0.359967 | 34.39712 | 0.0001 |
| AR(1) | 0.207537 | 0.097161 | 2.136002 | 0.0373 | |
| AR(2) | 0.680150 | 0.087605 | 7.763825 | 0.0001 | |
| MA(1) | 0.899640 | 0.131757 | 6.828015 | 0.0001 | |
| MA(2) | 0.396709 | 0.167496 | 2.368468 | 0.0215 | |
| MA(3) | 0.449350 | 0.130376 | 3.446570 | 0.0011 | |
| Confirmed Case | C | 12.18377 | 0.321224 | 37.92923 | 0.0001 |
| AR(1) | 1.425043 | 0.202649 | 7.032077 | 0.0001 | |
| AR(2) | -0.464570 | 0.189887 | -2.446557 | 0.0177 | |
| MA(1) | -0.444445 | 0.216171 | -2.055984 | 0.0446 | |
| MA(2) | 0.334247 | 0.132385 | 2.524801 | 0.0145 |
Forecasting
Figure 6 shows the next 1-month ahead forecast for COVID-19 incidence (confirmed case, death). The next 2-month (23 March, 2020 to 21 May, 2020) forecast for the number of confirmed case (left plot in Figure 6) and deaths due to COVID-19 (right plot in Figure 6) indicates an upsurge (see detail on Table 5). The model forecasts the incidence of COVID-19 with a minimum forecasting accuracy among the competing models (RMSE=0.873, MAE=0.619, MASE= 0.825 for the death series; RMSE=0.676, MAE=0.453, MASE=0.936 for the confirmed case series)

Figure 6. Plot of the actual data and the next 2 month forecasted values from ARMA for number of COVID-19 Confirmed cases (left side plot) and deaths from COVID-19.
| Forecast Time (day) | Confirmed Cases | Death | ||||
|---|---|---|---|---|---|---|
| Forecast | 95% CI for the Forecast | Forecast | 95% CI for the Forecast | |||
| 23-Mar-20 | 10.5436 | 9.2078 | 11.8794 | 7.7604 | 6.0205 | 9.5003 |
| 24-Mar-20 | 10.6331 | 9.1533 | 12.113 | 7.848 | 6.1074 | 9.5886 |
| 25-Mar-20 | 10.7127 | 9.0436 | 12.3818 | 7.9591 | 6.2019 | 9.71622 |
| 26-Mar-20 | 10.7834 | 8.891 | 12.6759 | 8.0634 | 6.2773 | 9.84958 |
| 27-Mar-20 | 10.8462 | 8.7065 | 12.986 | 8.1645 | 6.3294 | 9.99958 |
| 28-Mar-20 | 10.9021 | 8.4992 | 13.305 | 8.262 | 6.356 | 10.168 |
| 29-Mar-20 | 10.9517 | 8.2757 | 13.6276 | 8.3561 | 6.356 | 10.3562 |
| 30-Mar-20 | 10.9958 | 8.0413 | 13.9503 | 8.447 | 6.33 | 10.564 |
| 31-Mar-20 | 11.035 | 7.7994 | 14.2705 | 8.5347 | 6.2791 | 10.7903 |
| 01-Apr-20 | 11.0698 | 7.553 | 14.5866 | 8.6193 | 6.2053 | 11.0334 |
| 02-Apr-20 | 11.1008 | 7.3041 | 14.8974 | 8.7011 | 6.1108 | 11.2913 |
| 03-Apr-20 | 11.1283 | 7.0543 | 15.2022 | 8.7799 | 5.9979 | 11.562 |
| 04-Apr-20 | 11.1527 | 6.8049 | 15.5005 | 8.8561 | 5.8687 | 11.8434 |
| 05-Apr-20 | 11.1744 | 6.5567 | 15.7921 | 8.9296 | 5.7252 | 12.134 |
| 06-Apr-20 | 11.1937 | 6.3105 | 16.077 | 9.0005 | 5.569 | 12.4321 |
| 07-Apr-20 | 11.2109 | 6.0667 | 16.355 | 9.069 | 5.4017 | 12.7363 |
| 08-Apr-20 | 11.2261 | 5.8258 | 16.6264 | 9.1351 | 5.2247 | 13.0456 |
| 09-Apr-20 | 11.2397 | 5.5881 | 16.8912 | 9.1989 | 5.039 | 13.3588 |
| 10-Apr-20 | 11.2517 | 5.3538 | 17.1496 | 9.2605 | 4.8458 | 13.6753 |
| 11-Apr-20 | 11.2624 | 5.123 | 17.4017 | 9.32 | 4.6458 | 13.9942 |
| 12-Apr-20 | 11.2719 | 4.8959 | 17.6479 | 9.3774 | 4.4399 | 14.3149 |
| 13-Apr-20 | 11.2803 | 4.6724 | 17.8883 | 9.4328 | 4.2288 | 14.6369 |
| 14-Apr-20 | 11.2879 | 4.4525 | 18.1232 | 9.4863 | 4.0129 | 14.9596 |
| 15-Apr-20 | 11.2945 | 4.2364 | 18.3527 | 9.5379 | 3.793 | 15.2829 |
| 16-Apr-20 | 11.3005 | 4.0239 | 18.577 | 9.5877 | 3.5694 | 15.6061 |
| 17-Apr-20 | 11.3057 | 3.815 | 18.7965 | 9.6359 | 3.3425 | 15.9292 |
| 18-Apr-20 | 11.3104 | 3.6096 | 19.0112 | 9.6823 | 3.1128 | 16.2517 |
| 19-Apr-20 | 11.3146 | 3.4076 | 19.2215 | 9.7271 | 2.8807 | 16.5736 |
| 20-Apr-20 | 11.3183 | 3.2091 | 19.4274 | 9.7704 | 2.6463 | 16.8945 |
| 21-Apr-20 | 11.3216 | 3.0138 | 19.6293 | 9.8121 | 2.41 | 17.2142 |
| 22-Apr-20 | 11.3245 | 2.8218 | 19.8271 | 9.8525 | 2.1721 | 17.5328 |
| 23-Apr-20 | 11.3271 | 2.6329 | 20.0212 | 9.8914 | 1.9328 | 17.8499 |
| 24-Apr-20 | 11.3294 | 2.447 | 20.2117 | 9.9289 | 1.6923 | 18.1656 |
| 25-Apr-20 | 11.3314 | 2.2641 | 20.3987 | 9.9652 | 1.4507 | 18.4796 |
| 26-Apr-20 | 11.3332 | 2.0841 | 20.5824 | 10 | 1.2084 | 18.792 |
| 27-Apr-20 | 11.3349 | 1.9068 | 20.7629 | 10.034 | 0.9654 | 19.1025 |
| 28-Apr-20 | 11.3363 | 1.7322 | 20.9404 | 10.067 | 0.7219 | 19.4113 |
| 29-Apr-20 | 11.3376 | 1.5602 | 21.115 | 10.098 | 0.4781 | 19.7181 |
| 30-Apr-20 | 11.3387 | 1.3907 | 21.2867 | 10.128 | 0.234 | 20.023 |
| 01-May-20 | 11.3397 | 1.2237 | 21.4558 | 10.158 | -0.01 | 20.3258 |
| 02-May-20 | 11.3406 | 1.059 | 21.6222 | 10.186 | -0.254 | 20.6267 |
| 03-May-20 | 11.3414 | 0.8966 | 21.7862 | 10.213 | -0.499 | 20.9255 |
| 04-May-20 | 11.3421 | 0.7365 | 21.9478 | 10.24 | -0.743 | 21.2222 |
| 05-May-20 | 11.3428 | 0.5784 | 22.1071 | 10.265 | -0.986 | 21.5168 |
| 06-May-20 | 11.3433 | 0.4225 | 22.2642 | 10.29 | -1.23 | 21.8093 |
| 07-May-20 | 11.3438 | 0.2685 | 22.4191 | 10.314 | -1.472 | 22.0996 |
| 08-May-20 | 11.3443 | 0.1165 | 22.572 | 10.337 | -1.715 | 22.3878 |
| 09-May-20 | 11.3447 | -0.034 | 22.7229 | 10.359 | -1.957 | 22.6739 |
| 10-May-20 | 11.345 | -0.182 | 22.8719 | 10.38 | -2.198 | 22.9578 |
| 11-May-20 | 11.3453 | -0.328 | 23.019 | 10.401 | -2.438 | 23.2396 |
| 12-May-20 | 11.3456 | -0.473 | 23.1644 | 10.42 | -2.678 | 23.5193 |
| 13-May-20 | 11.3458 | -0.616 | 23.308 | 10.44 | -2.917 | 23.7968 |
| 14-May-20 | 11.346 | -0.758 | 23.4499 | 10.458 | -3.156 | 24.0721 |
| 15-May-20 | 11.3462 | -0.898 | 23.5903 | 10.476 | -3.393 | 24.3454 |
| 16-May-20 | 11.3464 | -1.036 | 23.7291 | 10.493 | -3.63 | 24.6166 |
| 17-May-20 | 11.3466 | -1.173 | 23.8663 | 10.51 | -3.866 | 24.8856 |
| 18-May-20 | 11.3467 | -1.309 | 24.0021 | 10.526 | -4.1 | 25.1526 |
| 19-May-20 | 11.3468 | -1.443 | 24.1365 | 10.542 | -4.334 | 25.4175 |
| 20-May-20 | 11.3469 | -1.576 | 24.2695 | 10.557 | -4.567 | 25.6803 |
| 21-May-20 | 11.347 | -1.707 | 24.4011 | 10.571 | -4.799 | 25.9411 |
The incidence of COVID-19 indicates rapid growth over the study period in most countries of the globe (Figure 2). This result is in line with the report made by WHO and an insight review by del Rio [6,36,37]. Therefore, protective mechanisms to slow down the spread of the virus, such as social distancing, cancelation of mass assembly, environmental hygiene, and hand washing with an alcohol [6,38], should be promoted through different platforms like social media. To minimize the spread of diseases in the community from the current situation, it is important to develop wellorganized coordination mechanisms to the extent possible.
A clear evidence of non-stationarity in both of the series was observed (Figure 2) and it confirmed by the ADF and PP test (Table 1). Log transformation was made in the series and no clear evidence of nonstationarity (trend in the transformed series was not observed). Stationarity in the log-transformed was confirmed by ADF and PP test (Table 1), an evidence of the lack of outward trend in the transformed series. Of the various ARMA models considered in this study ARMA (2, 2) and ARMA (2, 3) were found as the best model for daily COVID-19 confirmed cases and death series respectively. Those models were chosen among the other competing models, as they had a relatively minimal AIC and BIC with a minimum forecasting error. Besides, the model assumptions are supported by the data. The absence of serial correlation in the residuals are confirmed by Lagrange Multiplier (LM) and Ljung-Box test (Table 3, Figure 3); and the normality of the residuals for the fitted models are confirmed by the Jarque- Bera test (Figures 4 & 5).
The incidence of confirmed COVID-19 cases at the current time is considerably affected by the previous two lags of AR (AR (1)=1.425, P ≤ 0.001; AR(2)=-0.465, P=0.017), and MA (MA(1)= -0.444, P=0.045; MA(2)=0.334, P=0.0145) at 5% level of significance. This shows that number of COVID-19 confirmed cases for the current time depend on the number of confirmed cases in the previous two days (autoregressive component) and the previous period shocks (moving average component). This may be due to the fact that COVID-19 is easily transmitted to the uninfected person via droplets of saliva or discharge from the nose when the infected person coughs or sneezes [39,40]. This result is an alarm for intervention that the existence of confirmed cases on a given day may create pressure on the next two or more days as it may infect individuals who have had a close relationship.
The incidence of death from COVID-19 is substantially impacted by the past two AR lags (AR(1) = 0.208, P=0.037; AR(2) = 0.68, P<0.001) and the past three shocks (MA(1)=0.899, P<0.001; MA(2) =0.397, P=0.022, and MA(3) = 0.449, P=0.001). This result shows that the number of deaths due to COVID-19 at the present day is significantly affected by the number of deaths in the previous two days and also by the previous three days of shocks (the average moving component). This argument can be supported by the fact that the COVID-19 has a higher chance of transmission during clinical diagnosis and also unidentified / untreated individuals who have had close stay with the confirmed cases may also die.
Appropriate daily forecasting for the next two months has been made using the best fitted model in this study. The daily forecast value (the shaded region shows the forecasted values in the next 2 months specifically 23 March, 2020 to 21 May, 2020) indicates a drastic increase in COVID-19 incidence over the next 2 months (Figure 6). This situation would impose a tremendous strain on the global economy, on trade transactions and will also have a big impact on the tourism sector. This study is an alarm to the body concerned towards the need for high degree of action for potential intervention. The preventive approaches identified by WHO to curb the virus should be enforced strictly with optimum use of resources in the global community. Finally, we have ensured and convinced that the Box- Jenkins time series model is very important for the efficient modelling and forecasting of disease incidence.
The investigators did their best to model and forecast the incidence of COVID-19 (case, death) in the previous two months; it may not be free from limitations. As the data used for this study are secondary data, this study is unable to identify demographic, cultural and social-economic and related factors for the incidence of COVID-19 among individuals. Moreover, we are unable to exploit the geospatial distribution for the incidence of the disease due to nature of the data we accessed.
Over the study period, a dramatic rise in the number of globally confirmed COVID-19 cases and deaths per day was reported across the globe. In the analysis, the log-transformed value of the series was considered, and relatively stable variations were found around the mean of the series. Among the various time series models considered in this study ARMA (2, 3) and ARMA (2, 2) were found to be the best model for the daily reported death and confirmed case series respectively. The incidence of confirmed COVID-19 cases considerably affected by the previous two lags of AR (AR (1) =1.425, AR (2) =-0.465), and MA (MA (1) =-0.444, MA (2) =0.334). Similarly, the incidence of death from COVID-19 is substantially impacted by the past two AR lags (AR(1)= 0.208 and AR(2)=0.68 ) and the past three shocks (MA(1) =0.899, MA(2)=0.397, and MA(3) = 0.449). The forecast value indicates a drastic increase in COVID-19 incidence over the next 2 months, so the body concerned needs to strongly underline it. This study is an alarm to the body concerned towards the need for high degree of action to the fight against the spread of coronavirus with potential intervention. The preventive approaches identified by WHO to curb the virus should be enforced strictly with optimum use of resources in the global community. As the result showed us, the incidence of COVID-19 is growing so it is important to look for effective vaccine, preventive measures and efficient service delivery should be planned again.
Ethics approval and consent to participate
The data used in this study was accessed from JHU CCSE website only for research purpose. Since the data were secondary (study subjects did not participate directly) informed consent was not applicable.
Consent for publication
Not applicable
Availability of data and materials
The datasets used and analyzed during the current study are available on from the corresponding author on reasonable request.
The authors have declared that no competing interests exist.
The authors received no specific funding for this work.
AWA conceived, designed the study, analyzed the data and wrote up the manuscript. MAZ and TB assisted in analyzed the study and wrote up the manuscript. All the authors read and approved the final manuscript.
We would like to acknowledge that JHU CCSE has given us free access to the data set used in this study.