Research Article - (2025) Volume 14, Issue 1
Received: 30-Sep-2019, Manuscript No. JEES-23-3080;
Editor assigned: 03-Oct-2019, Pre QC No. P-3080;
Reviewed: 17-Oct-2019, QC No. Q-3080;
Revised: 06-Feb-2025, Manuscript No. R-3080;
Published:
06-Feb-2025
, DOI: 10.37421/2332-0796.2023.12.46
, QI Number: JEES-23-3080
Citation: Hecquet, Michel, G. Despret, T. J. Dos Santos Moraes and H. Zahr, et al. "Attenuation of Vibro-Acoustic Noise in a Multi-Phase Machine." J Electr Electron Syst 14 (2025): 46.
Copyright: © 2025 Hecquet M, et al. This is an open-access article distributed under the terms of the creative commons attribution license which permits unrestricted use, distribution and reproduction in any medium, provided the original author and source are credited.
This paper studies the electromagnetic noise behaviour of a 5 phase interior permanent magnet machine with fractional slot concentrated winding designed. A numerical model is used for analysing the torque characteristics and electromagnetic forces. The vibroacoustics and mechanical resonance of the model are then investigated analytically. The purpose of both analyses is to identify the source of electromagnetic noise within the machine. A sonogram is also carried out on the existing prototype to correlate it with the numerical results. Finally, the choice of the appropriate method to attenuate noise for this case study is elaborated.
Mechanical resonance • Multiphase IPM machine • Radial pressure harmonics • Sonogram • Vibro-acoustics
Electromagnetic noise has become a real concern in electrical machines as it affects human health and comfort, but also in terms of damage caused to the equipment. Various authors have shown valuable interest towards this subject such as having contributed to considerable progress. In this paper, a 5-phase Interior Permanent Magnet (IPM) machine destined for electric traction will be investigated. Multi-phase machines are often preferred for such applications owing to their higher robustness and reliability. Other authors such as have also worked on electromagnetic noise in multi-phase machines.
The aim of this paper is to investigate the source of electromagnetic noise within the machine and attenuate it. Firstly, the numerical model and analytical approaches will be used to identify the harmonics of electromagnetic pressures present in the air gap. Then, the mechanical resonance model will be established analytically so that the unwanted harmonics can be determined. Thereafter, experimental measurements will be carried out to establish a sonogram so that correlation can be done with the analytical and numerical results. Finally, the method chosen to reduce the electromagnetic noise will be discussed.
Phase IPM machine
In this section, the model of the 5-phase IPM machine with fractional slot concentrated winding designed will be studied [1]. The Finite Element (FE) model (Code_carmel) will first be used to analyse the torque characteristics and the electromagnetic pressures in the air gap. Subsequently, the analytical resonance model will be used to outline the unwanted harmonics of magnetic pressures.
Finite element model
The 5-phase IPM machine has 20 stator slots (Zs) and 14 rotor poles (2p), as shown in Figure 1. Table 1 also gives some additional information about the characteristics of the machine. The electromagnetic torque is given in Figure 2 with 58.8 Nm as mean torque, and a ripple of 0.42 Nm. For this case, the speed is equal to 3000 rpm, fs=350 Hz.
| Parameter | Value |
|---|---|
| Power (kW) | 9 |
| Max speed (rpm) | 16000 |
| Rated current (A) | 110 |
| Magnet | Samarium cobalt |
| Winding | Double layer, concentrated |
Table 1. Characteristics of IPM machine.

Figure 1. FE model of machine.

Figure 2. Torque characteristics.
To study the acoustic behaviour of the machine, the magnetic pressures occurring in the air gap have to be analysed as the most significant electromagnetic noise originates from there. Focus will be kept only on the radial pressures [2]. The radial pressure can be calculated from the radial magnetic flux density over the whole air gap by (1). Brad and Bt represent the radial and tangential magnetic flux density respectively, whereas μ0 is the magnetic permeability of free space and A is the surface area on which the pressure acts. The equation for A is given in (2), where npe is the number of discretisation taken round the air gap, L is the axial length of the machine and r is the radius of the air gap. It is important to correctly identify the pressure harmonics by doing a 2D FFT of the radial pressure, as shown in Figure 3.
Where
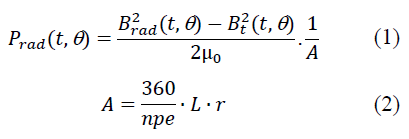

Figure 3. FFT 2D of radial pressure in air gap (load case).
The 2D FFT is given in terms of spatial order and frequency order. Spatial order can be understood as the deformation seen from a cross section (circumferential or axial) connected to the waveform versus space. Spatial orders can be from 0 and above, but those from 0 to 6 are usually most significant. In this study, only deformation in the circumferential cross section will be considered as we have a 2D model. Frequency order axis gives the frequency harmonics of the radial pressure in the air gap of the machine.
According to A Bruyere, some harmonics will occur owing to the structure of the machine, which is in terms of slots and poles. In our case as depicted in the harmonics at spatial order 14 (or -14) and 6 are due to the terms 2p and Zs-2p. The main harmonic (r=-14 at 2f) of radial pressure has the highest magnitude as it is linked to the number of poles. The sign (-14) is linked of the rotating magnetic field direction.
The harmonics occuring at spatial order 20 are due to Zs. As for the other harmonics (spatial order 2 or 4), their sources are not explicitly known, and analytical evaluation is necessary. Spatial orders higher than 6 are not detrimental and noisy; they can therefore be neglected. On the other hand, lower spatial orders must be thoroughly investigated to see if they excite the natural resonances of the machine, therefore being damaging or noisy. To do so, the resonance model of the machine must be determined as in the next section.
Analytical harmonic orders of radial pressure
The spatial and frequency harmonic content of radial pressure is quite rich which is particular to a double-layer concentrated armature winding type.
The spatial order 2 (or -2) is observed linked to the Greatest Common Divider: GCD (Zs, 2p)=2 in our case. The spatial order (0f-6f and 12f) exits and corresponds to the breathing mode for the electrical machines [4,5]. The spatial and frequency orders (r, f) of these motors can be summarised as if the tangential component is negligible:
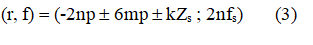
Where n, m, k= 0, 1, 2,… and p=7, Zs=20 are the number of poles, the number of the stator slots and the synchronous frequency.
With this expression, it is possible to deduce the origin of the harmonics link to the teeth effects (kZs) or the rotor magnetic field (2np) or stator field (6mp). For our machine, we have obtained this result for the analytical estimation of spatial and frequency orders (Figure 4).

Figure 4. FFT 2D of radial pressure: Evaluations of harmonic orders.
The main harmonic of the pressure is obtained when n=1 and m=k=0: r=-14 at 2fs. When n=m=0 and k=1, the spatial order is -20 and 20 at 0fs. The low spatial order (r=2) at 6fs for example is obtained by the interaction between magnet (2np) and teeth effects (kZs): n=3 and k=2 (m=0). Also, for the breathing mode (r=0) at for example 6fs, this case is obtained by the magnet (2np) and stator field (6mp) effects: n=3 and m=1 (k=0).
In order to compare these evaluations of harmonic orders with the F.E. solution, Figure 5, the no-load case (stator current=0) is presented. In this case, only the interaction between magnet and teeth effects appear. This result is similar with Figure 4: “blue point” link to the slotting or teeth effect (interaction between magnet and teeth effect).

Figure 5. FFT 2D of radial pressure in air gap at no-load case.
Electromagnetic analytical model
The “permeance/magnetomotive force” is defined in order to compare and validate the harmonic rank of radial pressure. This approach can be used to estimate the radial induction of the air gap as a function of time and space, by multiplying the Magnetomotive Force of the stator (MMFs) (Figure 6) and rotor (MMFr) by the air gap permeance per unit surface area (ʌ):
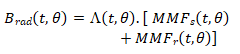
Only the air gap permeance ʌ (t, θ) is taken into consideration, with infinite permeability assumed for iron. This approach is developed in many papers. The stator currents are imposed with the same condition of the finite element simulation (sinusoidal condition). The aim of this approach is to analyse the origin of each harmonic.
For example, the stator magnetomotive force is represented in Figure 6.

Figure 6. FMM stator vs. time and angle/FFT of the FMM (θ).
Using this approach, only the radial component Brad of the magnetic field is taken into consideration. So the radial pressure is reduced to this expression, with, Btan disregarded:
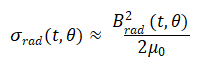
Figure 7 gives the spatial and frequency orders of the radial pressure. These results and the next results: Figures 3 and 4 show good agreements between the numerical results and the analytical evaluations.

Figure 7. FFT 2D of radial pressure in air gap at load case.
Resonance model of the IPM machine
This model is analytical in nature, and can be determined by calculating the resonance frequency, the damping and the transfer function for different modes, i.e. for 0 ≤ m ≤ 6, as they are the most significant ones. The ‘mode’ is the spatial deformation due to the natural frequency of the machine.
The frequency of mode 0 and 1 are calculated as in and, while modes 2 and higher as in. The constant k is given in the transfer function can also be derived by accounting for the damping, as depicted in Figure 8. The resonance frequency of each mode is given in Table 2.
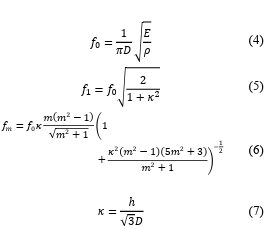
Where E-Young’s Modulus (Pa) ρ-Density (kg/m3) D-Mean diameter of equivalent tube (m) fx-resonance frequency at mode x (Hz) h-Thickness of tube (m)
The higher the resonance frequency, the smaller will be the probability of exciting it. From Table 2, it can therefore easily be excited by the pressure harmonics at spatial order 2 at 4f and 6f (4f=1400 Hz and 6f=2100 Hz if the speed equal 3000 rpm). This produces a noise of 73.5 dBSPL with analytical formulation [6]. To attenuate it, the pressure amplitudes at 4f and 6f must be reduced for the spatial order 2, which will be dealt with in the last section (Figure 8).

Figure 8. Transfer functions for resonance model of machine.
| Mode | Resonance frequency | Damping value (%) |
|---|---|---|
| 0 | 11550 | 6.1 |
| 1 | 16300 | 8.2 |
| 2 | 1978 | 1.9 |
| 3 | 5333 | 3.3 |
| 4 | 9624 | 5.2 |
| 5 | 14530 | 7.4 |
Table 2. Modes and their resonance frequencies.
As for the other modes, their frequencies are relatively high, and not easily excited. It must be noted that a pressure of spatial order x can only excite a resonance frequency of mode x. However, one must be careful if Pulse Width Modulation (PWM) control is used as it excites the mode 0. This issue is discussed later in this paper.
This analytical analysis method is prone to a percentage error as many aspects of the machine are not taken into account, such as the vibration of the mechanical parts, eccentricity and so on [7]. Therefore, to correlate the analytical analysis with real conditions, a sonogram must be determined.
Experimental analysis and validation
This section presents a sonogram measured at 1500 rpm which essentially serves to verify the presence of the harmonics found in the previous section. It is also useful in finding some anomalous harmonics that are usually caused by defects or other factors. Following the sonogram, a second FE simulation will be done by taking into account the factors causing those harmonics.
Sonogram measured at 1500 rpm
The sonogram gives a visual representation of the frequency spectrum of noise generated as the electrical machine varies in time. It helps identify the harmonics present when the machine is at work [8]. Nevertheless, the modes at which they occur cannot be determined from the diagram. They must therefore be deduced by correlating the harmonics in the sonogram with what is obtained from the FFT with FE analysis.
To obtain the sonogram, an accelerometer in stuck onto the stator so that its acceleration is measured. Pulse software is used to convert the signals from the accelerometer into a sonogram. Multiples tests at different speeds are carried out and one at 1500 rpm is presented in this study, as in. The motor is started and the speed is gradually increased from 0 to 1500 rpm in 50 s using V/F control, where the frequency is decreased so that the speed rises. A PWM current with a switching frequency of 15.5 kHz is supplied to the stator windings.
Two main areas can be identified: Area 1 shows the frequency spectrum due to the harmonics present in the machine, as shown in, whereas area 2 shows the spectrum occurring due to the PWM switching frequency at 15.5 kHz. Figure 9 zooms into area 1 showing the harmonics. Multiples of 2f (red circles) were singled out corresponding to the FFT, which is a normal occurrence in electrical machines. As for the yellow circles, they denote harmonics f and 9f, which are caused by eccentricity in the machine. They are usually characterised by submultiples of 2f as in this case.
On the other side, area 2 caused by the PWM is the effect of mode 0 being excited by the former. Moreover, mode 0 is at 11.5 kHz, which is not far from the switching frequency. 15.5 kHz. Given that the damping of the transfer function is not very pronounced as for mode 2, it is still apparent on the sonogram. Lower amplitude replicas can be found at lower frequencies of 5 kHz and 10 kHz, but they cannot be excited by other modes except 0. To detect higher amplitude resonances, the sonogram must be done for higher operating points (speed) if possible so that the machine can be further excited and the resonance frequencies can stand out clearly.
Accounting for PWM and eccentricity in FE model
The effect of PWM and eccentricity were taken into account in FE analysis so that harmonics generated due to them can be verified and correlated with the sonogram. Figure 10 shows the effect of eccentricity, with the sub harmonics f appearing and some others as well [9]. Harmonic 9f does not explicitly appear on the diagram due to amplitude filtering, but the latter is not negligible. Figure 10 shows the FFT when taking the PWM signal into account. The frequency harmonic (91f) found correspond to f=fd ± 3fs, where fd is the switching frequency and fs is the electrical frequency at 1500 rpm [12]. The other high order harmonics found are due to noise generated by the PWM signal (Figure 11).

Figure 9. Sonogram of IPM machine at 1500 rpm.

Figure 10. Effects of eccentricity.

Figure 11. PWM on the IPM machine.
Attenuation of noise
Various methods to attenuate electromagnetic noise can be found in literature where the authors modify the thickness of the stator yoke, the size of the teeth or the distribution of the windings. In this study, this type of optimisation will not be considered as we are working on an existing prototype [10]. It can nevertheless be used for future improvements of the model. Therefore, to attain our goal in a less intrusive manner, the load angle ψ between the EMF and stator current is slightly modified to see the effect on the noise.
Effect of load angle ψ on noise attenuation
The machine will run at a slightly lower torque as in Figure 12 without deterring the performances, but the noise will be considerably reduced. Table 3 summarises the characteristics at maximum torque (ψ=-18°) where noise is maximum, and also at ψ=-36° where the noise is reduced. This operating point is chosen because it represents a good trade-off between performance of the machine and electromagnetic noise. For a 3.7% reduction in torque and 44.5% reduction in ripple torque, the noise is attenuated by 3.8 dBSPL (-5.17 %), which is perceived as more than halving the noise to the human ear. This is achieved by reducing the harmonic (-2.6f) by 59.9%, the latter being the main contributor to noise in this case as compared to harmonic (2.4f), despite its slight increase.

Figure 12. Torque vs. angle ψ.
| ψ (°) | -18° (max torque) | -36° | % decrease |
|---|---|---|---|
| Average torque (Nm) | 58.3 | 56.7 | -37% |
| Torque ripple (Nm) | 0.4189 | 0.2327 | -44.45% |
| Pressure at (-26f) (Pa) | 9647 | 3868 | -59.9% |
| Pressure at (24f) (Pa) | 12164 | 12468 | +25% |
| Noise (dBSIL) | 73.5 | 69.7 | -5.17% |
Table 3. Characteristics at different angles of ψ.
This behaviour is valid for other operating speeds of the machine, and can therefore be used at higher speeds, where the natural frequency excitation and electromagnetic noise is much higher. This will correspond to a higher amplitude of the frequency spectrum.
Noise attenuation by improving the machine model
As cited earlier, the acoustic properties can be enhanced by modifying the dimensions of the machine, more specifically the stator as most of the vibration occurs there [11-13]. The smaller the stator diameter and the thicker the yoke and teeth, the lower will be the electromagnetic noise. A simulation verifies this statement where the mean diameter of the stator is reduced by 3.4% and the mean thickness of the stator is increased by 31.7%, as shown pictured in Figure 13. Note that Figure 13 is not scaled, but it is only to have an idea of the global change. It was found that, for the same operating point as above, at maximum torque (ψ=-18°), the noise was reduced to 63.9 dBSPL, which approximately represents a reduction of 10 dB.

Figure 13. Stator dimensions modification.
This attenuation occurs due to an increase in the natural frequency of mode 2 of the machine. Therefore, the vibrations caused by the harmonics 4f and 6f are further away from the peak of the transfer function resulting in a lower resonance amplitude [14,15].
This paper has investigated the acoustic properties of a multi-phase IPM machine machines with fractional slot concentrated winding designed for traction purposes. The numerical model and analytical approaches have been used to identify the harmonics of electromagnetic pressures present in the air gap. The different results of the radial pressure harmonics show good agreements between the numerical results and the analytical evaluations.
An analysis of spatio-temporal air gap radial pressure and vibroacoustic model were conducted in order to evaluate the electromagnetic noise. A strategy to reduce the electromagnetic noise by acting on the load angle ψ of the machine was used, causing a division of the former by 2, as perceived by the human ear. This is achieved by keeping a relatively good performance of the machine at the same operating point. Hence, this study presents a clear example of how the electromagnetic noise can be reduced in a machine without being intrusive to the machine topology, in case the latter is not possible.
This work has been achieved within the framework of CE2I project. CE2I is co-financed by European union with the financial support of European Regional Development Fund (ERDF), French state and the French region of Hauts-de-France.
Journal of Electrical & Electronic Systems received 733 citations as per Google Scholar report