Case Report - (2022) Volume 7, Issue 4
Received: 05-Apr-2022, Manuscript No. IJPHS-21-46810;
Editor assigned: 07-Apr-2022, Pre QC No. P-46810;
Reviewed: 19-Apr-2022, QC No. Q-46810;
Revised: 20-Apr-2022, Manuscript No. R-46810;
Published:
27-Apr-2022
, DOI: 10.37421/ 2736-6189.2022.7.4.276
Citation: Rashidi, Rajab, Farshad Foroughi Nasab and Mostafaj
Jalalvand. “Risk Assessment and Hazard Ranking of Primary Schools in
Khorramabad with the Approach of Explaining Preventive Measures.” Int J Pub
Health Safety 7 (2022): 276.
Copyright: © 2022 Rashidi R, et al. This is an open-access article distributed under the terms of the Creative Commons Attribution License, which permits unrestricted use, distribution, and reproduction in any medium, provided the original author and source are credited.
Background and Aim: Identifying hazards and risk assessment in schools is an effective and practical measure to prevent accidents and injuries to primary student’s school.
Methods: In this study, after identifying the activities, by visiting, observing and interviewing the responsible persons and primary school students in Khorramabad, potential risks using FMEA method were identified and risk assessment was considered, taking into account the severity of the effect, the probability of occurrence. Consequences and the level of exposure to risks were done and then risk rating was determined using TOPSIS decision method.
Results: In the present study, the total rank of safety and health risks of schools in different levels H, M and L respectively 4, 60 and 100 and in the results of environmental aspects assessment in different levels H, M and L, respectively. 12, 48 and 75 and in TOPSIS technique the special score was 0.8314, Also, the highest decision matrix for safety risks is related to the lack of strength of school buildings.
Discussion and Conclusion:Based on the results of the present study, most schools had moderate and similar status in terms of safety and health status and environmental aspects. Water consumption management was in schools, this issue requires more attention and accuracy in order to improve and enhance safety, health and environment.
Risk assessment • Risk • Primary schools • FMEA • TOPSIS
The importance of safety in schools stems from the fact that students spend a lot of time in school. Therefore, paying attention to the safety of schools and the safety of students in schools is one of the most important concerns of officials and parents of children. The local school is crowded and has the potential to be the scene of many dangers and accidents. Therefore, the safety of schools in different sectors must be observed [1]. School safety includes all activities that are carried out in order to provide, maintain and improve the level of safety and health of students, the school environment should be such as to provide the safety, psychological and social needs of students [2]. If the school does not have the safety conditions of buildings, sufficient space and appropriate and standard equipment, proper garbage collection system and sewage disposal, the educational efforts of teachers and educators will certainly not be desirable [3,4].
Understanding the nature of risk, how to measure, evaluate and react to its results is crucial to making systems as secure as possible. Approximately 25% of the population in developing countries are children, 99% of whom attend school [5]. Incidents and accidents in schools are far more than at home and there are fewer schools that do not experience a small or large accident every day or every week [6]. According to statistics published in 1990 in the United States, 43% of children's mental health problems and accidents are related to schools, of which 20% are related to school buildings [7]. A similar study found that 20 to 30 percent of injuries to children occur in and around the school, and school-related accidents generally occur at recreational or sports classes [8]. In the studies of Karbasi, et al. it was found that schools are deficient in terms of area compared to the number of students. More importantly, adolescents and children with physical disabilities are at higher risk in the absence of safe conditions in schools [9]. A study by Lyon, et al. found that many accidents leading to bone fractures in schools can be prevented through changes in environmental conditions [10]. Also in a study conducted by Maitre, et al. it was found that children's injuries in schools are a major concern and in order to prevent accidents, special attention should be paid to specific points and areas in schools [11].
The results of a study by Lee, et al. (2020) conducted in two different cities, one in the north of England (394 students) and the other in eastern Sweden (157 students) between the ages of 9 and 11, showed that children in both countries believed that The toilets are unpleasant, dirty and stinky, and there are threats and intimidation. 62% of boys and 35% of girls in English and 28% of boys and girls in Sweden refused to defecate at school Also, the results of the studies of Asl K, et al. (2015) showed that despite the differences in the body dimensions of students in different grades of elementary school, due to the fact that many students exposed themselves to different risks, a certain order of use There were no tables and benches with different dimensions. In general, the dimensions of the existing desks and benches did not fit the anthropometric dimensions of the students. Since there are many problems in the field of health, safety and environment of schools, the nature of which should be identified and scientific solutions should be implemented for them, considering that no study has been done in Khorramabad. The present study aims to assess the risk. HSE was performed in primary schools in Khorramabad and provided solutions to control its risks.
The present study is descriptive-analytical and was conducted crosssectionals in primary schools in districts 1 and 2 of Khorramabad. In this study, 384 educational buildings in primary school were selected as a sample and examined in terms of health and environmental safety indicators. It placed. First, the sample size was determined by region, location, gender and educational level of schools as follows (Table 1).
| S. No. | Name of Area/District | Number of Classes | Number of Educational Buildings Inspected | Boy Student | Girl Student |
|---|---|---|---|---|---|
| 1 | District one | 981 | 177 | 10375 | 11656 |
| 2 | District Two | 1002 | 207 | 10670 | 11197 |
The schools were then visited and the data were collected by completing a special checklist for school safety, health and environment published by the Iranian Institute of Standards and Industrial Research. The above checklist; It included 104 questions related to the health sector, 128 questions related to the safety sector and 11 questions related to the environment sector. For each phrase, there were 5 options: very weak, weak, medium, good and very good., Marked the most appropriate answer with the symbol (×). The scoring scale in this study according to the Likert classification scale included a five-choice scale from very poor (1) to very good (5). Then the potential hazards were identified using the FMEA method and the risk was assessed by considering the severity of the effect, the probability of occurrence of the consequences and the degree of exposure to the hazards. The FMEA is a method that identifies and ranks, as far as possible, the potential risks in the area in which the risk assessment is performed and the associated causes and effects. In this technique, after identifying the risks for each risk, three indicators are considered. These indicators are as follows: [8]
The worsening of the risk is the degree to which the potential risk effect on individuals is new. In this study, the severity or severity of the risk is considered only in terms of its "effect". Also, the reduction in severity of the risk is possible only through changes in the process and the way activities are performed (Table 2).
| Score | Effect intensity | Description |
|---|---|---|
| 5 | Severe/catastrophic | Complete destruction of the equipment so that the equipment needs to be replaced |
| 4 | Seriously | Destruction of a large part of the equipment so that it needs a complete reconstruction |
| 3 | Moderate | Requires major equipment repairs with long line downtime |
| 2 | Slight | Minor repairs with short line stop |
| 1 | Insignificant damage | Minor repairs without stopping the line |
In this study, the probability of occurrence was measured on a scale of 1 to 5, which was determined by examining the control processes, standards, requirements and labor laws and how to apply them to achieve this number was very useful. Probability of discovery is a kind of assessment of the ability to identify a cause/mechanism of occurrence of a hazard. In other words, the probability of discovering the ability to detect danger before it occurs (Tables 3 and 4).
| Rank | Probability |
|---|---|
| 5 | Very frequent and certain event (it can happen every day) |
| 4 | Common event (may occur during the week) |
| 3 | Probable and moderate occurrence (may occur during the month) |
| 2 | Small occurrence (may occur once a year) |
| 1 | Impossible and unlikely event |
| Rank | Ability to detect | Criterion |
|---|---|---|
| 10 | Absolutely none | There is no control or if there is, it is not able to detect potential danger |
| 9 | A bit | It is very unlikely that the risk will be detected and revealed with existing controls |
| 8 | Insignificant | It is unlikely that risk will be detected and revealed with existing controls |
| 7 | Very little | It is very unlikely that risk will be detected and revealed with existing controls |
| 6 | Low | It is unlikely that the existing controls will detect the risk |
| 5 | Moderate | In half of the cases, the potential risk is detected and revealed with the existing control |
Calculate RPN In this study, the risk priority number multiplied by three numbers of deterioration (S) of the event (O) and probability of discovery (D) was determined. RPN = Occurrence * detection * severity. Also, the priority number of risk was between 1 and 100. For high-risk numbers, a working group was set up to lower this number through corrective action. In order to determine the RPN index or degree of risk of FMEA by normal distribution method in potential failure situations, based on RPN, it was arranged in descending order from the highest risk priority number to the lowest priority number and the degree of risk was determined as follows. To calculate this method, two components of category number and category length were needed. The method of calculating the mentioned indicators was as follows:
K=1+3/3LogN
In this regard, N is the number of identified risks
K=1+3/3Log23 = 1 + 3.3(1.69) = 6.57 ≈ 6
To obtain the length of the category, we also used the relation:
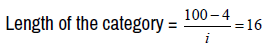
Then, using TOPSIS multi-criteria decision-making method, risk scoring, ranking and prioritization were determined. The TOPSIS method is one of the most reliable scientific and managerial methods of decision-making and decision-making, and it can be used to make decisions more scientific and the decision-making process can be based on more logical data and outputs [12]. The main concept of TOPSIS method is that the preferred option should have the shortest distance from the positive ideal solution and the maximum distance from the negative ideal solution. In this study, TOPSIS SOLVER 2013 software to prioritize identification risks was used.
Findings of the study on hazard identification in schools indicated that the highest rate of hazards related to safety and health indicators was 12 risks (equivalent to 25%), hazards related to building design were 14 risks (equivalent to 29%) health General: 6 risks (equivalent to 12%) Risks related to heating equipment: 5 risks (equivalent to 10%) Risks related to educational equipment: 9 risks (equivalent to 18%) Risks related to electrical equipment: 3 risks (equivalent to 6%) are also, descriptive statistics in risk assessment by FMEA method were divided into 23 risks and 6 categories, the smallest risk priority number being 4 and the largest number being 100, and the category length index of 16 was determined.
After determining the boundaries of the categories and the frequency of each category, the risks were divided into 6 categories, which are identified in Table 5 of the acceptable risks according to the frequency classification of each category.
| Rank | Abbreviation | Status |
|---|---|---|
| L1 = 4 - 20 | LR | Acceptable risks |
| L2 = 21 - 37 | LR2 | Acceptable Risks - Long-term planning for remedial action |
| L3 = 38 - 54 | MR | Medium Risks - Have a corrective action plan in the medium term |
| L4 = 55 - 71 | MR2 | Moderate risks - need for corrective action in the short term |
| L5 = 72 - 88 | HR | High Risks - Define and implement corrective action during the activity |
| L6 = 89 - 105 | HR2 | Extremely high risks - Requirement to take corrective action before operation |
Figure 1 shows the frequency of risks identified by the evaluation of checklists. According to the results of this study, the highest frequency identified is related to acceptable risks that require long-term corrective measures to correct them. Figure 2 shows the frequency percentage of identified risks based on priority checklist evaluation, according to which the category of acceptable risks (LR) and acceptable risks require long-term planning for corrective action (LR2) in total with 68% included the highest percentage of identified risks. Figure 3 shows the frequency distribution of identified risks based on the source of risk, in which, according to the findings of the study of the three groups of building design, public health status of schools and electrical equipment in schools, the highest source of hazards and safety and health risks. They had schools. Figure 4 shows the percentage of frequency of hazards identified based on the source of risk, according to which the recording and connection of the environment and educational tools had the least share in creating risk among other groups.

Figure 1. Frequency distribution of identified risks based on priority.

Figure 2. Percentage of frequency of identified risks based on priority.

Figure 3. Frequency distribution of identified risks based on the source of risk.

Figure 4. Percentage of risks identified based on the source of risk.
Findings from the evaluation of environmental aspects in this study showed that the lowest environmental aspect is related to the lack of programs related to paper consumption management with risk number 12 and the highest aspect is related to the lack of water consumption management program with risk number 75. The decision matrix of TOPSIS method included determining the main indicators which included 49 safety and health risks, 11 environmental risks and 5 structural risks. Safety and health risks were scored in the mentioned indicators based on the numbers of 1 lowest and 9 highest ranks by 5 experts.
The highest rank of decision matrix for safety and health risks was related to the lack of strength of some school buildings and non-observance of hygienic standards in the delivery of food in the buffet with the number 5 and the lowest rank was related to non-use of double glazing, lack of drinking water in many From schools, the combination of drinking water and sanitation in some schools, lack of regular sanitation, lack of sanitation in schools and not installing adequate traffic signs outside some schools were determined with the number 1. The highest rank of TOPSIS decision matrix for environmental risks related to the lack of water consumption management program was determined with the number 5 and the lowest rank related to the lack of programs related to paper consumption management and per capita lack of green space in primary schools was determined with the number 2.
Table 6 shows the weighting applied in terms of the importance of each hazard, the potential for consequence, the probability of occurrence of the hazard and the detection coefficient of each health and safety risk, in which the highest weighted rate in terms of severity of the consequence is related to instability problems. Inadequate design, improper design of emergency escape route and lack of attention to the principles of electrical safety in schools, and the highest van rates in terms of risk are related to improper design of stairs and poor sanitation in schools.
| Matrix of Weighted | Probability | Severity | Discovery Coefficient |
|---|---|---|---|
| Lack of protection for stairs (or non-standard guards) | 0.0294 | 0.0754 | 0.0452 |
| Non-standard stairs (in terms of height) | 0.0368 | 0.0302 | 0.0678 |
| Lack of strength of some school buildings (lack of approval of the Ministry of Housing and Urban Development for earthquake resistance) | 0.0147 | 0.0754 | 0.113 |
| Do not use double glazing | 0.0147 | 0.0452 | 0.0226 |
| Do not use protection for windows | 0.0221 | 0.0603 | 0.0226 |
| Lack of standard escape route design in many schools | 0.0074 | 0.0754 | 0.0452 |
| Worn and non-standard stairs | 0.0294 | 0.0452 | 0.0452 |
| Burning of walls, ceilings and many school buildings | 0.0221 | 0.0754 | 0.0678 |
| Lack of drinking water in many schools | 0.0368 | 0.0452 | 0.0226 |
| Lack of disposable glasses for drinking in all schools | 0.0368 | 0.0302 | 0.0452 |
| Integration of drinking water and sanitation in some schools | 0.0294 | 0.0452 | 0.0226 |
| Lack of regular cleaning of toilets | 0.0294 | 0.0452 | 0.0226 |
| Lack of sanitation in schools | 0.0294 | 0.0151 | 0.0226 |
| Lack or lack of toilet fluid in many schools | 0.0368 | 0.0302 | 0.0452 |
| Use of solid soap in some schools | 0.0368 | 0.0302 | 0.0452 |
| Lack of timely emptying of trash | 0.0294 | 0.0302 | 0.0452 |
| Insects in schools and lack of timely spraying | 0.0368 | 0.0452 | 0.0452 |
| Failure to comply with hygienic standards in the delivery of food in the buffet | 0.0221 | 0.0603 | 0.113 |
| Existence of animals such as dogs and mink in many schools | 0.0294 | 0.0452 | 0.0452 |
| Some expired food items in school buffets | 0.0147 | 0.0603 | 0.0904 |
| High volume of dust in classrooms and benches | 0.0221 | 0.0452 | 0.0452 |
| Failure to measure drinking water | 0.0221 | 0.0452 | 0.0904 |
| Non-standard heating equipment in some schools | 0.0368 | 0.0754 | 0.0904 |
| Lack of heating equipment in some schools | 0.0221 | 0.0302 | 0.0678 |
| Use of oil and gas heating equipment in many schools | 0.0294 | 0.0754 | 0.0678 |
| Lack of firefighting equipment in schools | 0.0221 | 0.0603 | 0.0678 |
| Weakness in training in the use of firefighting equipment | 0.0221 | 0.0603 | 0.0452 |
| Lack of timely charging of some fire extinguishers | 0.0221 | 0.0603 | 0.0678 |
| Non-ergonomic desks and chairs for students and even teachers | 0.0294 | 0.0452 | 0.0904 |
| Existence of some sharp and winning levels (fences, etc.) | 0.0368 | 0.0302 | 0.0678 |
| Insufficient light is part of the classes | 0.0368 | 0.0302 | 0.0452 |
| Lack of first aid equipment in most schools | 0.0294 | 0.0452 | 0.0452 |
| Lack of first aid training for officials and teachers | 0.0221 | 0.0603 | 0.0452 |
| Surface electrification in most schools | 0.0221 | 0.0754 | 0.0678 |
| Sockets and switches damaged in many schools | 0.0294 | 0.0754 | 0.0678 |
| Do not use the life-saving switch in the school electrical system | 0.0294 | 0.0754 | 0.0678 |
| Do not use warning signs for electrical installations | 0.0221 | 0.0452 | 0.0452 |
| Some electrical panels do not have a special lock | 0.0294 | 0.0754 | 0.0678 |
| Weak electrical safety training | 0.0294 | 0.0603 | 0.0678 |
| Use of electric heaters in some schools and their offices | 0.0294 | 0.0754 | 0.0452 |
| Lack of standard ground system for most switchboards | 0.0294 | 0.0754 | 0.0678 |
| Do not use the miniature key | 0.0294 | 0.0603 | 0.0678 |
| Lack of recording and connection in schools, especially in the warehouse | 0.0368 | 0.0302 | 0.0452 |
| Failure to measure the brightness of the surfaces | 0.0147 | 0.0151 | 0.0452 |
| Reflection of sunlight in parts of the day in some classes | 0.0221 | 0.0151 | 0.0452 |
| Failure to install adequate traffic signs outside some schools | 0.0294 | 0.0603 | 0.0226 |
| The student playground is extremely non-standard and harmful | 0.0294 | 0.0452 | 0.0678 |
| Whiteboard instability to the wall | 0.0221 | 0.0302 | 0.0452 |
| Do not use a backpack | 0.0368 | 0.0452 | 0.0904 |
Table 7 shows the weighting rate in terms of the importance of each risk, the potential for consequences, the probability of occurrence of the hazard and the extent of pollution of each environmental risk, in which the highest weighted rate in terms of severity of consequences related to lack of management Water and electricity consumption is the lack of waste management and lack of attention to the principles of environmental management training, and the highest rates in terms of the risk of excessive and unregulated consumption of water and electricity and per capita lack of green space in schools.
| Matrix of Weighted | Probability | Severity | The Extent of Pollution |
|---|---|---|---|
| Lack of programs related to paper consumption management | 0.0592 | 0.0749 | 0.0686 |
| Lack of power management program | 0.0987 | 0.1123 | 0.1372 |
| Lack of water consumption management program | 0.0987 | 0.1123 | 0.1715 |
| Lack of environmentally friendly equipment (such as refrigerators, cooling and heating appliances) | 0.0789 | 0.0749 | 0.1029 |
| Lack of waste management program in schools | 0.0592 | 0.1123 | 0.1029 |
| Weak environmental education for students | 0.0592 | 0.1498 | 0.1372 |
| Shortage of green space per capita in primary schools | 0.0789 | 0.0749 | 0.0686 |
| Lack of trash and lack of waste separation | 0.0592 | 0.0749 | 0.1029 |
| Lack of timely disposal of waste | 0.0592 | 0.1123 | 0.1029 |
| Non-standard design of septic tanks | 0.0592 | 0.1498 | 0.1372 |
| Pollution from vehicle traffic for students to school | 0.0789 | 0.1123 | 0.1372 |
Table 8 shows the degree of proximity to positive and negative optimal solutions for safety and health risks, in which the best values for positive indicators are the smallest values and for negative indicators are the largest values. According to the table below, the positive optimal solution for safety and health risks is to pay attention to the issue of probability and reduce the probability of risk occurrence, and then the negative optimal solution is the second solution to reduce the severity of the consequences of safety and health risks.
| Optimal solution | Probability | Severity | Discovery coefficient |
|---|---|---|---|
| + | 0.0368 | 0.0754 | 0.113 |
| - | 0.0074 | 0.0151 | 0.0226 |
Table 9 also shows the degree of proximity to the positive and negative optimal solutions for environmental risks, in which according to the Table 9, the positive optimal solution of environmental risks also pays attention to the issue of probability and reduces the probability of occurrence of risks. It is environmental and then the optimal solution as a second way to reduce the severity of the consequences of environmental risks.
| Optimal solution | Probability | Severity | The extent of pollution |
|---|---|---|---|
| + | 0.0987 | 0.1498 | 0.1715 |
| - | 0.0592 | 0.0749 | 0.0686 |
Table 10 shows the ranking of safety and health risks, which according to the data in the table, the highest rank of safety risks are related to the lack of solidity of school buildings, non-standard heating equipment in schools and lack of attention to electrical safety principles in schools. The highest rank of health risks is related to unsanitary distribution of food items in school cafeterias and disregard for ergonomic principles in schools. Table 11 shows the ranking of environmental risks. In this study, the highest risk rating was allocated to the lack of water consumption management program, poor environmental education and non-standard design of septic tanks.
| Result | Ranking |
|---|---|
| Lack of strength on the part of school buildings | 0.8314 |
| Failure to comply with hygienic standards in the delivery of food in the buffet | 0.829 |
| Non-standard heating equipment in some schools | 0.8085 |
| Some expired food items in school buffets | 0.7004 |
| Use of non-standard backpack | 0.6794 |
| Non-ergonomic desks and chairs for students and even teachers | 0.6685 |
| Use of oil and gas heating equipment in many schools | 0.6516 |
| Surface electrification in most schools | 0.6316 |
| Some electrical panels do not have a special lock | 0.6316 |
| Lack of standard ground system for most switchboards | 0.6316 |
| Do not use the life-saving switch in the school electrical system | 0.6316 |
| Sockets and switches damaged in many schools | 0.6316 |
| Failure to measure drinking water | 0.6176 |
| Burning of walls, ceilings and many school buildings | 0.6176 |
| Weak electrical safety training | 0.5839 |
| Do not use the miniature key | 0.5839 |
| Lack of firefighting equipment in schools | 0.5681 |
| Lack of timely charging of some fire extinguishers | 0.5681 |
| The student playground is extremely non-standard and harmful | 0.5168 |
| Use of electric heaters in some schools and their offices | 0.4995 |
| New guardrails for stairs (or non-standard guards) | 0.4995 |
| Non-standard stairs (in terms of height) | 0.467 |
| Existence of some sharp and winning levels (fences, etc.) | 0.467 |
| Lack of standard escape route design in many schools | 0.4656 |
| Lack of heating equipment in some schools | 0.4319 |
| Weakness in training in the use of firefighting equipment | 0.4258 |
| Lack of first aid training for officials and teachers | 0.4258 |
| Insects in schools and lack of timely spraying | 0.3919 |
| Existence of animals such as dogs and mink in many schools | 0.3693 |
| Worn and non-standard stairs | 0.3693 |
| Lack of first aid equipment in most schools | 0.3693 |
| Failure to install adequate traffic signs outside some schools | 0.3537 |
| Do not use warning signs for electrical installations | 0.3484 |
| High volume of dust in classrooms and benches | 0.3484 |
| Do not use protection for windows | 0.3388 |
| Lack of disposable glasses for drinking in all schools | 0.3295 |
| Insufficient light is part of the classes | 0.3295 |
| Use of solid soap in some schools | 0.3295 |
| Lack or lack of toilet fluid in many schools | 0.3295 |
| Lack of recording and connection in schools, especially in the warehouse | 0.3295 |
| Lack of drinking water in many schools | 0.3066 |
| Lack of timely emptying of trash | 0.2996 |
| Integration of drinking water and sanitation in some schools | 0.2811 |
| Lack of regular cleaning of toilets | 0.2811 |
| Whiteboard instability to the wall | 0.2717 |
| Do not use double glazing | 0.2408 |
| Reflection of sunlight in parts of the day in some classes | 0.2269 |
| Failure to measure the brightness of the surfaces | 0.2029 |
| Lack of sanitation in schools | 0.1686 |
| Result | Ranking |
|---|---|
| Lack of water consumption management program | 0.7566 |
| Weak environmental education for students | 0.6601 |
| Non-standard design of septic tanks | 0.6601 |
| Lack of power management program | 0.6329 |
| Pollution from vehicle traffic for students to school | 0.5967 |
| Lack of waste management program in schools | 0.3671 |
| Lack of timely disposal of waste | 0.3671 |
| Lack of environmentally friendly equipment (such as refrigerators, cooling and heating appliances) | 0.2767 |
| Lack of trash and lack of waste separation | 0.2394 |
| Shortage of green space per capita in primary schools | 0.1329 |
| Lack of programs related to paper consumption management | 0 |
In recent decades, in order to prevent the occurrence of potential accidents and improve the level of safety, health and environment among primary school students, many measures and research have been done, the result of which has been to provide systematic safety management solutions in this area. The main elements of safety management systems are risk identification, risk assessment and control of related consequences, which is important for systematic and dynamic management to determine and prioritize failure modes based on a quantitative factor. The results of this study also showed that this method has a good power for identifying and evaluating risks, just as in primary schools in Khorramabad, identified a large number of risks and provided solutions to control these risks. The results of this study showed that a total of 49 safety and health risks and 11 environmental aspects related to activities in primary schools in Khorramabad were identified and evaluated. The lowest priority number of risk 4 is not using warning signs for electrical installations and the highest priority number of risk 100 is the lack of strength of some school buildings, lack of approval of the Ministry of Housing and Urban Development for earthquake resilience. With the title of reviewing the maintenance of Iranian schools, in which the results indicated that in 32.9% of schools, technical criteria in the design, construction and use of quality materials have not been done.
45.2% of the causes of school construction problems are due to use contrary to the original plan. Damages to school buildings have a significant relationship with the year of construction, architectural context, location, art use [13]. The results of the present study showed that 20 safety and health risks (41%) at the partial risk level, 13 risks (27%) At a relatively low level, 8 risks (16%) are at a medium level, 7 risks (14%) are at a high level and 1 risk is at a very high level. These results also showed that 12 safety and paper consumption and the highest risk was related to water consumption management in schools. Part of the safety and health problems of primary schools in Khorramabad city, including the deterioration of the building and the lack of budget allocation by the Education Organization for the renovation of schools, are among the most important safety problems. The poor quality of the glass used in the windows was another problem of most schools. Lack of strength of some school buildings with risk priority number 100 in FMEA method and special score 0.8314 in TOPSIS technique is the most important safety risk in primary schools in Khorramabad, so the results of the present study are consistent with and complement the results of Taheri study (2013). In which a large number of urban schools were in the right place in terms of construction (58.5%) and despite the relative accuracy of the construction of schools, still 41.5% were built in almost non-standard locations. In terms of floor covering, 2.5% was sandy or earthy. 80% had a secure roof. 30% of the surveyed units had more than 15 steps and more than one third of the educational units did not observe at least 30 cm wide stairs [14,15].
In 2017, more than 80 cases of food poisoning due to unhygienic food consumption were reported in the buffet of primary schools, one of which resulted in death [16]. The high probability of its occurrence (non-observance of hygienic standards in the delivery of food in the buffet), has led to a special score of 0.829 for this risk, which is in line with the results of studies by Rezaian, et al. (2014) in middle schools in Yazd province that The results showed that the lack of sanitary equipment and tools in schools has been one of the main problems and the cause of the spread of many infectious diseases among students. Non-standard heating equipment has also been identified as another important risk that has occasionally led to severe incidents in primary schools. The use of oil heaters or non-standard or defective electric heating equipment has been the cause of most accidents such that the results of this section are in line with the results of Mazlumi study (2017) in the study of primary schools in Ilam in which non-standard heating equipment as The highest risk factor for winter accidents was determined in the schools under review [17]. Nonstandard backpacks, which are a major cause of ergonomic problems, pose a serious risk to elementary school students. Although it is not considered an acute factor, but due to its high recurrence and probability of occurrence, it is classified as an important risk with a special score of 0.6794. Non-ergonomic desks and chairs and lack of related training are other effective factors in the occurrence of ergonomic injuries in schools. In terms of ergonomic indicators, 78.4% of schools had good lighting, 65.2% of schools had blackboards and 46% had desks and desks. In 43% of schools, the height of drinking troughs and in 86% of schools, the height of toilets were appropriate. Also, 25.6% of schools are ergonomically desirable, which indicates that a large part of the educational equipment in schools is not ergonomically standard.
The results are in line with the present study [18] Lack of use of flooring under the equipment, the presence of some obstacles and small holes in the school environment and car parks in different parts of the yard in many primary schools, were among the problems related to this criterion that indicate the need to organize them. In most cases, the stairs do not have standard protection. Many libraries and meeting rooms do not have an automatic fire extinguishing system. In some schools where this system exists, due to lack of budget, it is not served on time and therefore does not have the necessary efficiency. Electrical system wear was observed in almost all schools. The earth system, which is one of the most important sub-criteria of the electricity system, is not fully implemented in most schools and is not present in 60% of primary schools in Khorramabad. Is a center where 65% of primary schools did not have a standard electrification system [19]. Manual extinguishers are available in schools in limited numbers. One of the reasons is the weakness of culture and education of students in its use. Also, a limited number of fire extinguishers are not charged at the specified time. Other sub-criteria such as access to fire trucks in schools are in good condition. The results are similar to the results of a study by Blark D, et al. (2014) on health and safety assessment of schools in Zahedan, in which 62.5% of schools had safe drinking water. Only 27% of schools had one toilet for every 40 students. 75% of the schools had a sanitary sewage disposal method. 70% of the schools had a sanitary waste disposal system and in 35.5% of the schools the waste disposal and washing time interval was observed [20].
According to the results of this research and the explanations provided in the discussion and conclusion section, it is suggested to strengthen and expand the program "Establishment and maintenance of safety, health, environment management in primary schools in the following cases:
• Study on the resilience of school structures against events such as earthquakes
• Study and find the causes of the weakness of schools in criteria such as fire and electricity
• Developing environmental management strategies for schools in Khorramabad city
• Allocating funds for the renovation of school buildings in Khorramabad
• Use of fire alarm system as well as automatic fire extinguishing system in schools
• Implementation of earthling system and service and maintenance program in all schools
Google Scholar, Crossref, Indexed at
Google Scholar, Crossref, Indexed at
Google Scholar, Crossref, Indexed at