Review Article - (2025) Volume 14, Issue 1
Received: 07-Jan-2023, Manuscript No. JEES-23-87967;
Editor assigned: 10-Jan-2023, Pre QC No. JEES-23-87967 (PQ);
Reviewed: 25-Jan-2023, QC No. JEES-23-87967;
Revised: 06-Feb-2025, Manuscript No. JEES-23-87967 (R);
Published:
14-Feb-2025
, DOI: 10.37421/2332-0796.2023.12.60
Citation: Mobarakl, Asmaa. "Optimal Performance of Single Tuned Passive Filter in Distribution Network." J Electr Electron Syst 14 (2025): 60.
Copyright: © 2025 Mobarak A. This is an open-access article distributed under the terms of the creative commons attribution license which permits unrestricted use, distribution and reproduction in any medium, provided the original author and source are credited.
It is commonly accepted that designing Single Tuned Passive Filters (STPFs) is an optimization problem. By choosing the best passive filter, this work seeks to enhance the power quality of an actual distribution system in Tala city as a part of Egyptian network. Although the distribution feeder already has a passive filter, there are still some power quality problems. By using Jelly Fish Optimization Technique (JFOT) and Arithmetic Optimization Algorithm (AOA) to improve the placement and size of the low pass harmonic filter, this paper intends to cut overall power loss and reduce the influence of total harmonic distortion. The suggested filters' cost, real power losses, Total Harmonic Distortion ("THD"), and Individual Harmonic Distortion ("IHD") are optimized using single and multi-objective functions, respectively. Inequality constraints are used to establish upper and lower limits for filter parameters, quality factor, voltage, and harmonic distortion. The power balance constraint on equality will be applied. The results indicate that an optimally designed of STPF can successfully reduce high order harmonics and enhance system performance of STPF under various operating conditions to consistently follow to the established IEEE 519 standards'.
Harmonics analysis • Optimal design • Passive power filter • Power quality
Modern power distribution networks are anticipated to be distorted with significant harmonic distortions due to the increased utilization of power electronics-based systems [1,2]. A grid connected power converter's harmonic currents must conform to the planning harmonic levels [3]. However, the voltage at various nodes and the current across power lines might experience considerable distortions as a result of the combination of the harmonic distortions of one busbar with those of the nearby busbars. Power harmonics are known to damage consumer electronic loads, commercial drives, and communication systems in addition to overheating and power losses in power system components [4].
Additionally, they can severely restrict a power network's ability to support considerable penetrations of distributed energy resources. Harmonic distortions can also have an impact on the loading capacity of cables and power transformers [5]. In order to maximize network capacity, enhance the performance of system components, and follow to locally specify standard limits, harmonic distortions should be managed. To withstand the negative impacts of power harmonics at the power network level, an appropriate harmonic mitigation device, such as passive and active power filters (or a mix of both), can be used. Due to their straightforward running and inexpensive cost, STPFs are the most advantageous alternative [6,7]. Given the needs of the power system, designing STPF settings is still a difficult issue for engineers.
A power load flow programmed can be used to construct STPFs, and the parameters can be determined by trial and error. Instead, many designers now employ optimization techniques to get a precise design with less work and time required. The best design of STPFs has been highlighted in the engineering applications of nature-inspired optimization methods to enhance their performance for specified criteria [8].
The Genetic Algorithm (GA) was employed in References to optimize the parameters of several STPF topologies. The effect of parameter changes on the STPFs' performance was taken into account by the authors [9,10]. In addition, Juan Z, et al. suggested the usage of a GA to reduce total cost and minimize THD of current. For the suggested method of the ideal placement and size of STPFs, GA was also used in Melo ID, et al. Similar to this, JLeite JC; et al. created and analyzed a modified GA-based multi-objective optimization problem for the positioning and picking of filters. Wang Y, et al. suggested an ideal design for a dynamic tuning STPF employing the GA for harmonic distortions and cost minimization [11].
For the purpose of sizing and placing several STPFs in a test network using a power system modelling software, the authors in Milovanovic M, et al. compared the GA and a few other algorithms with an integrated optimization tool. The multi-objective Firefly Optimization Algorithm was used in Bajaj M, et al. to construct a high-pass STPF using the Decoupled Harmonic Power Flow (DHPF) approach, which was also used to frame the optimization problem. When designing a C-type filter for a distorted system in Mohamed IF, et al. GA was used to maximize the load Power Factor (PF).
The GA approach's performance might be compared to the generic programming code-based solution covered in Aleem SHEA, et al. Harris Hawks optimization's performance was compared to a few other methods for C-type filters, with the goal of reducing STPF overloading, in Aleem SHEA, et al. The Crow Search Algorithm was used in Aleem SHEA, et al. to reduce the overall cost of 3rd order and C-type STPFs. By using the Crow Spiral Algorithm, a number of STPF configurations were efficiently created to reduce the overall demand distortion [12]. In Zeineldin HH, a single-tuned STPF was created utilizing Particle Swarm optimization to reduce voltage THD (PSO). Instead of using the relative weighted harmonic attenuation factors of the STPF design as in Sharaf AM, et al. the optimization problem formulation was based on harmonic power flow. For the multi-objective problem, references Chang YP, et al. proposed a continuous and discontinuous neural network-based, optimally designed, STPF with a single weighted objective function. Two single-tuned and high-pass STPFs were created using PSO with multi-objective optimization, THD, cost, and PF in the references Na H, et al. For the best STPF design, the most recent optimization algorithms have been also used. In Yang, N, et al. a Bat Optimization Algorithm was created to design a collection of STPFs as a multi-objective problem. Results were compared to those produced from the Simulated Annealing (SA)-and PSO-based solutions taking into account THD, cost, and PF.
An SA-based, single-tuned STPF was created in Ertay MM, et al. to optimize power factor and minimize THD in a straightforward medium voltage network, however the performance of the SA may be assessed using other algorithms. According to Yang, NC, et al. various STPF topologies were created utilizing the Teaching-Learning-Based Optimization and Bee Swarm Optimization algorithms to achieve numerous goals. In order to reduce the overall cost and THD, Yang, NC, et al established the Ant Colony Optimization (ACO) method for two single-tuned STPFs working with an active filter. Additionally, Kahar NHA, et al. presented a study that suggests a modified ACO for a single-tuned filter. Additionally, in Sirjani R, et al. single- and double-tuned STPFs were created using Bee Colony Optimization (BCO). THD and reactive power were taken into account as weighted objective functions. The Whale Optimization Algorithm (WOA) was used in Rosyadi A, et al. for the design and placement of STPF. The outcomes suggest that harmonic reductions were only slightly impacted by the chosen STPF and the objective function, which only comprised power losses minimization. To create an ideal STPF at the lowest possible cost, the cuckoo optimization algorithm was used. In Mohammadi M, et al. the Bacterial Foraging Optimization Algorithm was used to construct and position three STPFs for various individual harmonic orders for a radial distribution system. A decrease in investment costs and power losses were the aim functions. In Tosun S, et al. a Gravitational Search Algorithm was Page 2 of 10used to determine the best single-tuned STPF design for an industrial power network. As described in Badugu R, et al. the Class Topper Optimization Algorithm and the Slime Moulid Optimization Algorithm were used for the best STPF design. In the literature, the JFOT and AOA algorithms have not yet been implemented for the STPF design problem, and the harmonic performance of an optimally designed STPF with variations at the network level has not been investigated [13].
Aim and contributions
All the previews mentioned references help in studding the passive filter and some algorithms help in determining the optimal algorithm that can be used to calculate the optimal passive filter parameters and its optimal location.
This paper aims to improve the power quality of a real distribution system at Tala city, as a part of Egyptian network, by allocating an optimal passive filter. This feeder is already has a passive filter, but the distribution feeder still has some problems in power quality. So this paper aims to reduce overall power loss and reduce the impact of total harmonic distortion generated by harmonics in utilizing JFOT and AOA to optimize the placement and size of the low pass harmonic filter.
The designed filter will achieve the objective functions within limits of some equality and inequality constraints which are filter parameters, quality factor, bus voltage magnitude, harmonic distortion for voltage and current, power balance and power factor limits. Five single objective functions are used to suppress harmonics in this case that are minimizing filter cost, voltage harmonic distortion “VHD”, power losses, current harmonic distortion “CHD” and correcting power factor. A new optimization technique is used for finding the best location of the STPF and its optimal parameters, giving a global benefit to the system while also increasing its power quality. This new optimization technique depends on two algorithms that were used before in allocating STPFs in previews papers [14].
The rest of the essay is arranged as follows: The formulation of the optimization issue and system modelling are covered in Section 2. In section 3, an overview of the JFOT and AOA and where they got their ideas are given. In section 4, a complete modeling of the new algorithm is shown. The performance of the algorithms, the design algorithm's performance in the power system, and the outcomes are reviewed in section 5. The conclusions of this study are reported in section 6.
Optimization problem formulation
Modeling of the system equivalent: To assist in formulating the optimization issue and assessing STPF performance system developed with an optimization algorithm, a simple power network is represented. It utilizes a similar grid and overhead line impedance. This circuit reduction technique is additionally used to verify the effectiveness of the optimization techniques that utilized for STPF design research. One of the many modelling methods for the harmonic sources discussed in the literature, the straightforward and straightforward current source model showing a harmonic source by the current in the frequency domain sources in the desired frequency range can still deliver a precise harmonic performance evaluation when there are interactions between a harmonic source's control system and the power network's background harmonics.
Furthermore, the harmonic performance analysis studies for the best design of the STPFs have been frequently conducted using the harmonic current source modelling approach [15,16]. Here is an example of the analogous circuit used to solve the STPF design problem: The corresponding grid, overhead line, linear load, and harmonic source are shown in Figure 1.

Figure 1. Equivalent circuit modeled for problem formulation.
The Backward Forward Power Flow (BFPF) method is used to iteratively compute the relevant components at each frequency because the system is considered to be balanced and symmetrical. Kirchhoff's voltage and current rules can then be applied to fundamental and harmonic frequencies, allowing for the computation of harmonic indices like THD, power losses, and PF. A standard harmonic modelling of the system's components, as described in Bajaj M, et al. must be followed in order to carry out the harmonics flow for the equivalent power system depicted in Figure 1.
The parameters of such a STPF are conventionally calculated as follows
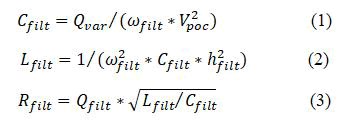
Where, Rfilt is the STPF resistance, Lfilt and Cfilt are the STPF inductance and capacitance, respectively. Vpoc is the RMS voltage of the fundamental frequency component at the Point of Connection (POC). Qvar, ωfilt are the reactive power delivered by the STPF and fundamental angular frequency in rad/sec, respectively. hfilt is the tuning frequency and Qfilt is the quality factor of the STPF.
There must be a difference between the resonance and filter settings. The resistance, inductor, and capacitor values must be chosen to operate at a specific harmonic frequency, while reducing the associated harmonic distortion in order to achieve the intended performance of the ideal filter. By creating a resonance frequency lower than the harmonic frequency to be removed, STPF is used in a circuit to remove harmonic distortion. Extremely low impedance is created when the filter circuit in the STPF is suppressed at the desired harmonic frequency, connecting the harmonic current to ground and preventing it from entering the network. Shunt filters can be designed to meet any rating need [17].
Description of problem formulation
The variables vector: It is expected in this study that a certain number of filters are placed in the electricity system. As a result, it must be chosen, where to allocate them, with the suggested technique including determining their parameters. Their allocation are determined by a vector ALL, which contains integer numbers, as presented in equation (4):
ALL=(all1.all2.all3.……….allN) (4)
Where, N is the total number of filters to be assigned and allN is the bus number where the Nth filter will be placed. As a result, the number of integer items, in this vector, is the same as the number of filters. The vector PAR will be used to inform the capacitance parameters of the filters as in equation (5):
PAR=(c1.c2.c3…….cN) (5)
Where, cN is the capacitance value of the Nth filters. The tuned frequencies associated to each filter (fN) are informed by the vector fil, as in equation (6):
fil=(f1.f2.f3…….fN) (6)
Finally, the quality factors of the filters (qN) are informed by the vector q, as in equation (7):
q=(q1.q2.q3…….qN) (7)
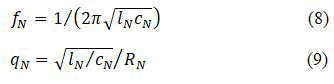
Equations (8) and (9) should be used to calculate the inductance and resistance of single tuned filters based on capacitance values, tuned frequency, and quality factor.
The solution is determined by the vector Vec, containing all the variables in ALL, PAR, fil and q as presented in equation (10):
Vec=(ALL.PAR.fil.q) (10)
Proposed optimization problem formulation: The STPF parameters' ability to employ alternative values to create varied Total Harmonic Distortion voltage (THDv), Total Harmonic Distortion current (THDc), voltage Individual Harmonic Distortion (IHDv), current Individual Harmonic Distortion (IHDc), and Total Demand Distortion (TDD) is a restriction of this calculation approach. In order to overcome these difficulties and guarantee compliance with the standard limitations, the STPF parameters should be developed optimally using the suggested optimization techniques. This can also cause the grid voltage and the PF to breach the standard limits. Reduce harmonic distortions, prevent the malfunction of sensitive loads, and expand the system's hosting capacity for future renewable systems are the main objectives of implementing STPFs in power systems. Additionally, it has been noted in the literature that removing harmonic distortions can decrease network power losses and increase system effectiveness. As a result, it is believed that the main STPF design objective function to be minimized is the voltage THD at the POC, while other operational factors like individual harmonic distortions, the POC voltage, PF, and some issues regarding the STPF parameter requirements are considered as constraints that must be overcome. The voltage THD, which is defined as follows, serves as the objective function [18].
By incorporating the best STPF, which is based on reducing the proposed filter cost “F1”, power losses “F2”, VHD “F3”, CHD “F4”, PFC “F5”. The aim of this study is to improve power quality. In order to select the best filter values and position within a set of constraints, all of the preview functions are integrated into a single function. This function is then employed as a multipurpose goal function.
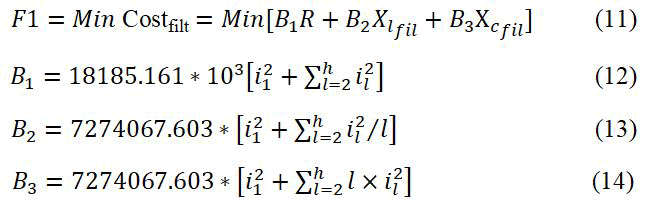
Minimizing the proposed filter cost "F1"
The greatest challenge of filter design is to minimize the total cost of the filter parameter. The most expensive parameter of any fitter is the capacitor. The total proposed filter costs objective function can be explained by Ertay MM, et al.
Minimizing power losses "F2"
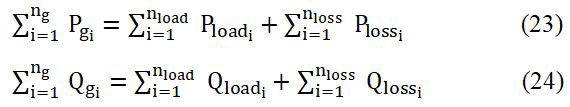
The real power losses at a network's fundamental frequency are computed using standard fundamental power flow and are stated as follows:

Where, Nb is the number of network branches, PLosses is the active power loss.
Minimizing VHD "F3": When considering voltage harmonics, two significant variables, THDv and IHDv, must be included in the objective function. To decrease voltage harmonic distortion of the system, the following equation should be used:
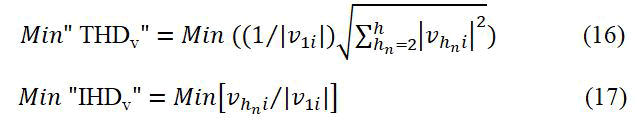
Where, v1i is the fundamental bus voltage, hn is the harmonic order,  is the harmonic order voltage at bus i.
Minimizing CHD "F4": As considering current harmonics, two major issues including THDv and IHDv must be added in the objective function. To minimize the current harmonic distortion of the system, the following equations should be used:
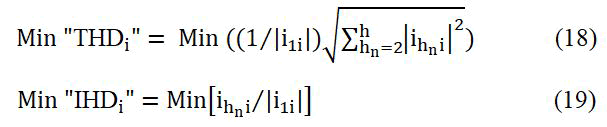
Where, i1i is the fundamental bus current, hn is the harmonic order, is the harmonic order current at bus i.
Power factor correction "F5"
The goal of Power Factor Correction (PFC) is to increase power factor and hence power quality. It lowers the burden on the electrical distribution system, improves energy efficiency, and lowers power costs. It also reduces the chance of device instability and failure. Harmonic filters can also generate a considerable amount of reactive power for power factor correction. To improve power factor of the distribution grid the following equation can be used:
Max "PF"=Max (P/S) (20)
Where, P is the active power "W", S is the apparent power "VA"
Multi-objective function "F"
Finally, the multi-objective function of the problem under consideration is introduced as follow:
F=a1 F1+a2 F2+a3 F3+a4 F4+a5 F5-1 (21)
In this paper, a weighted technique is used to determine the objective function value of each recommended solution to a problem. As a result, the five factors a1, a2, a3, a4 and a5, are constrained by
a1+a2+a3 +a4+a5=1 and 0 ≤ a1, a2, a3, a4, a 5≤ 1 (22)
Problem constraints
The previews objective functions will be solved under the following constrains:
Power balance constraints
Filter parameter limits
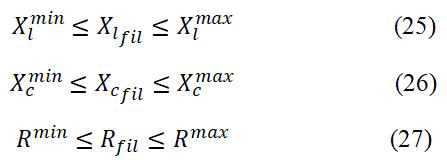
Where, Xlmin, Xlmax, Xcmin, Xcmax, Rmin, and Rmax are the limits of inductive reactance, capacitive reactance, and impedance, respectively.
Quality factor constrains
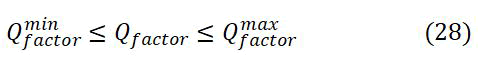
Where, Qfactormin=0.5 and Qfactormax=2 are the limits of power quality factor.
Voltage limitations in all network buses
Vmin ≤ Vi ≤ Vmax (29)
Where, Vmin and Vmax are the voltage limits from 0.95 Pu to 1.05 Pu, respectively.
Harmonic distortion limits
By IEEE Std. 519, THDv, and IHDv should not be exceeded 5% and 3%, THDi and IHDi should not exceed 4% and 5%, respectively.
THDv ≤ THDvmax (30)
IHDv ≤ IHDvmax (31)
THDi ≤ THDimax (32)
IHDi ≤ IHDimax (33)
Where, THDvmax, IHDvmax, THDimax and IHDimax are the maximum limits of THDv, IHDv, THDi and IHDi, respectively.
Power factor limits
0.9<PF<1 (34)
The presented objective function will be evaluated by two new optimization techniques AOA and JFOT under the IEEE Std.519 restrictions and recommended standards.
Optimization techniques
Given how important it is to add a STPF into distribution systems, several methods are employed to manage optimization problems, while being aware of a variety of objective function and all distribution power network restrictions. In this work, harmonics are reduced in a radial distribution system with a significant number of nonlinear loads using a single tuned filter. Single tuned filter units are a vital electric component utilized in reducing total power loss, enhancing the voltage profile, and maintaining voltage and current harmonic distortion within acceptable limits. They are installed and established in the best location and with good dimensions. By reducing or raising an established objective fitness function, which will be detailed in this part, algorithms for optimization and other approaches like JFOT and AOA try to find the best answer to a given optimization problem. In this paper a combined algorithm is used. Using the best solutions of JFOT results as an input data to the AOA, a new algorithm is used to find the optimal allocation of the STPF [19].
AOA overview and stages: Nowadays, the majority of widely used optimization approaches are derived from animal or insect behavior. However, a number of metaheuristic approaches from potent physics, chemistry, and mathematics phenomena have been presented in response to the sophistication and complexity of numerical optimization issues and the need for fresh and efficient optimization approaches.
AOA overview: The AOA is a recently developed population-based metaheuristic optimization strategy that is used to quickly address a variety of optimization problems. The physical law of buoyancy established by Archimedes serves as the foundational standard for the AOA. This law describes the relationship between the buoyancy force exerted on a body and the fluid in which it is submerged, such as water. According to the law, when the weight of the body exceeds the weight of the fluid released, the object will sink since a body subjected to an upward force has a buoyancy equal to the weight of the displaced fluid. However, if the object's weight and the weight of the fluid being ejected are equal, the thing will float. The population was viewed as a collection of objects submerged in fluid in the optimization method chosen by the AOA. The density, volume, and acceleration of these population members play a crucial role in the process of the object floating [20]. The AOA aims to intensify until all of the population's objects are equally floating, meaning that the net fluid force value operating on all objects is equal to zero.
In other words, the objective of utilizing the AOA is to optimally calculate the values of F1,F2,F3,F4,F5,F for the STPF.
AOA stages: The next section goes into great detail on the seven stages that the AOA goes through before arriving at the seventh stage, which is a global solution.
Stage 1 (Initialization): In this step, each population member is launched into the fluid at a random position, as shown in Equation (35), and the fitness value of each object is then determined.
Mk(t)=Mmin+rand(Mmax-Mmin),k=1.….Npop (35)
Where, Mmax and Mmin are the limits of all decision variables in each considered solution
Stage 2 (Update the object’s density and volume): In this step, equations (36) and (37) are used to update the density and volume values for each item for an iteration t+1.
DENk (t+1)=DENk (t) + rand (DENbest-DENk (t)) (36)
VOLk (t+1)=VOLk (t) + rand (VOLbest-VOLk (t)) (37)
Where, DENk is the kth object density, rand represents a dimensional vector generates number between (0,1) randomly, VOLk is the kth object volume, DENbest is the density of the object having the best fitness and VOLbest is the volume of the object having the best fitness.
Stage 3 (Transfer operator and density factor): At this stage, the population's clash of various items may be seen. The AOA search is transitioned from the exploration phase to the exploitation phase with the help of the transfer operator TF. The TF value gradually increases over time, eventually approaching unity.
Stage 4 (Exploration, exploitation, and normalized acceleration phase): Depending on the value of the component, this step is broken into three sub phases (TF). Exploration is the initial sub stage, where objects collide with one another. In this scenario, a Random Material (RM) is chosen, and the object's acceleration is changed. The objects are not subjected to any collisions with one another during the second sub stage, known as exploitation, and the object's acceleration is changed. The normalized acceleration phase is the name of the third sub stage. This sub stage is used to determine the percentage change, and the acceleration is shown.
Stage 5 (Update position): The object is in the exploration phase at this stage, and its position is updated. If the object is in the Exploitation phase, the position of the object is updated.
Stage 6 (Evaluation): In this stage, the optimal solution is recorded together with the optimal values for VOLbest, and DENbest are assigned when the examination of each object's fitness value is completed.
JFOT overview and stages: JFOT, a recently created optimization algorithm, has significantly outperformed several other well-known optimization techniques and requires less parameter adjustment for the process as a whole. The population size and the number of iterations are the only two controlling parameters that must be set for the optimizer. Jellyfish optimization technique is considered one of the recent optimization techniques which are used with single objective and multi-objective optimization problems. A logistic map, which generates several beginning populations, is used in a JFOT to initialize the jellyfish population.
JFOT overview: Optimization technique strategies algorithms, such jellyfish aims to find the optimal solution of a given optimization problem by minimizing or maximizing a given objective fitness function. This technique, along with each jellyfish’s own movements inside the swarm and following ocean current to form jellyfish bloom, has given these species the capability to act almost everywhere in the ocean. Jelly fish visits some sites in where the amount of food varies; thus, when food proportions are compared, the best location would be identified. The goal function of the JFOT is the location of the jellyfish where it has the greatest food because the optimization technique was motivated by the behavior of jellyfish as they look for food in the water. While the exploitation phase involves the passive and active movements of the jellyfish inside a jellyfish swarm, the exploration phase in a JFOT entails the movement of jellyfish as they follow ocean currents in quest of food. In other words, the objective of utilizing JFOT is to optimally calculate the values of F1,F2,F3,F4,F5,F for the STPF.
JFOT stages: There are six phases of jellyfish in the ocean,
• Phase 1: Jellyfish in the ocean;
• Phase 2: Following the ocean current;
• Phases 3-5: Passive and active motions within the Jellyfish Swarm that are switched to each other according to a time control mechanism;
• Phase 6: Reach the Jellyfish Bloom. Three idealized rules serve as the foundation for the optimization method proposed:
• A time control mechanism determines when jellyfish switch between moving inside the swarm and following the ocean current.
• In the ocean, jellyfish migrate about in quest of food. More jelly fish are drawn to areas where there is more food available.
• The amount of food found depends on the location and its associated aim function.
Equation (38) describes how the initial jellyfish swarm is created,while equation (39) describes how the current population of jellyfish is created as the jellyfish move about in their own space.
Mk (t)=Mmin+rand(Mmax-Mmin ),k=1.….Npop (38)
Mk (t+1)=Mk (t)+γ*rand(0.1)*(Mmax-Mmin) (39)
Where, Mmax and Mmin are the upper limit and lower limit of all decision variables in each considered solution., respectively; γ>0 is a motion coefficient, related to the length of motion around jellyfish’s locations. The second jellyfish of interest travels away from the first jellyfish of interest when the amount of food accessible to the second jellyfish of interest is less than the amount of food available to the first jellyfish of interest at the location of the first jellyfish is selected. In order to find food in a swarm, each jellyfish "solution" goes in the better direction.
The new combined strategy overview and stages: It is known that using one strategy to find the results achieves the desired goal well and effectively, but in this manuscript, two strategies will be used to solve to reach the best and the optimal solutions. JFOT will be used first and after obtaining its results, these results will be entered as a new data for the AOA technique. The flow chart of the combined strategy is shown in Figure 2.

Figure 2. Flow chart of the combined algorithm (AOA and JFOT) for determining the parameters and location of STF.
System description
Real system "Tala city": The power system specifics are described in this part. In the beginning, the harmonic source is considered to function at normal capacity, the grid voltage is supposed to be sinusoidal, and variations in the linear load are disregarded in order to compare the performance of the optimization algorithms.
This paper aims to design a STPF that can improve the power quality of a real distributer in Tala city called “Elgendy distributer” as a part of Egyptian network. This distributer already has a STPF, but after allocating this filter at 12/2021 by the distribution company, there is still some power quality distortion.
At 50 Hz, the grid line voltage is 11 kV, and the overhead line impedance is 1.45 Ω resistance and 2.79 Ω inductive reactance per phase. The commonly representative resistive-inductive load is used, with an impedance of 40 Ω resistance and 20 Ω reactance per phase, accounting for 0.83 lagging PF. This distribution system is shown in Figure 3. This network is consists of 22 bus which is supplied from a step-down transformer 66/11 Kv.

Figure 3. Single line diagram of Elgendy distribution network.
A STPF is located at bus 10 which is connected directly from bus 3. The data of this STPF is shown at Table 1. The old STPF that is connected at bus 10 is shown in Figure 4.
| Type | Iskra KLV 1211 |
|---|---|
| Installation | Indoor or out door |
| Qn | 3 × 100 kvar |
| Normal voltage | 12000/11000 V |
| Maximum voltage | 13200 V |
| Operating frequency | 50 Hz |
| Cn | 2.65 μF |
| C/Cn | 1.13% |
| Vi | 38/95 kV |
| Discharge | Yes |
Table 1. Data of the old STPF connected at elgendy network.

Figure 4. The old STPF at bus 10 at Elgendy distributer.
Operating system: The optimization techniques are mentioned in this paper, are run in MATLAB (R2015B) to solve the optimization problem.
To create relevant results for a comparison between the algorithms, the iterations and populations are both set to 100. In this paper, the typical values recommended by algorithm creators are used. These initial parameters should be carefully chosen in order to improve performance because they can have a big impact on how well an algorithm performs overall when it is used for a particular application.
The power system performance parameters, such as the voltage, PF, system losses, efficiency, and cost, should be computed for comparison between the old and the new STPF. Three scenarios are used, first using the JFOT, second using the AOA and finally using the new combined algorithm. The results of applying JFOT and AOA are shown in Table 2 and Table 3. While, the outcomes of applying the new algorithm to the actual Tala City system are displayed in Table 4. These tables display the outcomes for each separate objective function as well as the outcomes for multi-objective functions when JFOT, AOA and the newly proposed algorithm is used. From these results, the new algorithm can achieve the problem constraints and give better results. The new algorithm located the optimal filter at bus 14 when multi-objective function is the target and this location is because loads at buses 18 and 22 are three phase motor loads and these motors injects a lot of harmonics in the network. Other loads are household loads which injects little harmonics not like the motors loads. Figures 5 and 6 show the current and voltage spectrum at bus 3 with the old filter and with the new filter, respectively. Figure 7 shows the voltage waveform at bus 3 with the old filter and with the new filter. Figure 8 shows the voltage at each bus with the old filter and with the new filter. Figure 9 shows the power factor correction that is achieved after allocating the new filter compared with the power factor when the old filter is allocated.
| Results | Old STPF | New STPF | |||||
|---|---|---|---|---|---|---|---|
| F | F1 | F2 | F3 | F4 | F5 | ||
| Costfilt "$"× 103 | 5.2 | 7.85 | 7.25 | 7.9 | 7.92 | 7.68 | 7.95 |
| Max. THDv% | 4.7 | 1.01 | 1.082 | 1.14 | 1 | 1.38 | 1.53 |
| Max. IHDv% | 4.6 | 0.902 | 0.981 | 0.984 | 0.89 | 0.99 | 0.98 |
| Max. THDi% | 9.12 | 3.545 | 3.85 | 3.69 | 3.81 | 3.32 | 3.87 |
| Max. IHDi% | 1.318 | 0.65 | 0.64 | 0.69 | 0.665 | 0.587 | 0.691 |
| Ploss "MW" | 0.1525 | 0.157 | 0.164 | 0.153 | 0.189 | 0.168 | 0.172 |
| Rfil "Ω" | 6.083 | 9.12 | 9.01 | 9.23 | 9.28 | 9.35 | 9.37 |
| lfil "mH" | 0.8520 | 1.301 | 1.905 | 1.926 | 1.865 | 1.94 | 2.301 |
| Cfil "μf" | 2.65 | 5.02 | 5.05 | 5.06 | 5.09 | 5.08 | 5.1 |
| Qc "MVAR" | 0.3 | 1.25 | 2.08 | 1.07 | 1.9 | 1.14 | 1.71 |
| PF | 0.920 | 0.98 | 0.97 | 0.955 | 0.96 | 0.95 | 0.85 |
| Location of filters | at bus 10 | at bus 14 | at bus 18 | at bus 19 | at bus 18 | at bus 14 | at bus 3 |
Table 2. Optimal filter parameters and filter cost after applying JFOT at Elgendy bus system.
| Results | Old STPF | New STPF | |||||
|---|---|---|---|---|---|---|---|
| F | F1 | F2 | F3 | F4 | F5 | ||
| Costfilt "$"× 103 | 5.2 | 7.62 | 7.01 | 7.45 | 7.61 | 7.503 | 7.74 |
| Max. THDv% | 4.7 | 0.992 | 1 | 1.09 | 0.954 | 1.24 | 1.3 |
| Max. IHDv% | 4.6 | 0.9 | 0.95 | 0.91 | 0.83 | 0.98 | 0.92 |
| Max. THDi% | 9.12 | 3.5 | 3.85 | 3.68 | 3.8 | 3.3 | 3.8 |
| Max. IHDi% | 1.318 | 0.61 | 0.63 | 0.62 | 0.6 | 0.54 | 0.65 |
| Ploss "MW" | 0.1525 | 0.15 | 0.16 | 0.15 | 0.179 | 0.16 | 0.16 |
| Rfil "Ω" | 6.083 | 9.1 | 9 | 9.123 | 9.128 | 9.135 | 9.137 |
| lfil "mH" | 0.8520 | 1.26 | 1.802 | 1.85 | 1.798 | 1.86 | 2.02 |
| Cfil "μf" | 2.65 | 4.92 | 4.95 | 4.96 | 4.99 | 4.98 | 4.9 |
| Qc "MVAR" | 0.3 | 1.19 | 1.98 | 1 | 1.85 | 1.09 | 1.64 |
| PF | 0.920 | 0.985 | 0.968 | 0.958 | 0.965 | 0.956 | 0.89 |
| Location of filters | at bus 10 | at bus 18 | at bus 19 | at bus 18 | at bus 14 | at bus 3 | at bus 13 |
Table 3. Optimal filter parameters and filter cost after applying AOA at Elgendy bus system.
| Results | Old STPF | New STPF | |||||
|---|---|---|---|---|---|---|---|
| F | F1 | F2 | F3 | F4 | F5 | ||
| Costfilt "$"× 103 | 5.2 | 24.03 | 23.05 | 23.54 | 25.68 | 26.01 | 25.71 |
| Max. THDv% | 4.7 | 0.988 | 0.992 | 1.01 | 0.901 | 1.12 | 0.998 |
| Max. IHDv% | 4.6 | 0.892 | 0.91 | 0.904 | 0.8 | 0.978 | 0.898 |
| Max. THDi% | 9.12 | 3.45 | 3.8 | 3.64 | 3.771 | 3.2 | 3.7 |
| Max. IHDi% | 1.318 | 0.58 | 0.54 | 0.59 | 0.55 | 0.507 | 0.61 |
| Ploss "MW" | 0.1525 | 0.1422 | 0.15 | 0.1401 | 0.168 | 0.1504 | 0.153 |
| Rfil "Ω" | 6.083 | 9.012 | 8.95 | 9.0954 | 9.099 | 9.1 | 9.06 |
| lfil "mH" | 0.8520 | 1.2 | 1.57 | 1.6 | 1.72 | 1.47 | 1.89 |
| Cfil "μf" | 2.65 | 5.203 | 5.105 | 5.069 | 5.098 | 5.167 | 5.146 |
| Qc "MVAR" | 0.3 | 3.25 | 3.14 | 3.75 | 3.49 | 3.65 | 3.53 |
| PF | 0.920 | 0.99 | 0.97 | 0.96 | 0.975 | 0.959 | 0.99 |
| Location of filters | at bus 10 | at bus 14 | at bus 18 | at bus 19 | at bus 18 | at bus 14 | at bus 14 |
Table 4. Optimal filter parameters and filter cost after applying the new algorithm at Elgendy bus system.

Figure 5. Current spectrum at bus 3 without filter and with the old and new filter using the new algorithm.

Figure 6. Voltage spectrum at bus 3 without filter and with the old and new filter using the new algorithm.

Figure 7. Voltage waveform at bus 3 without filter and with the old and new filter using the new algorithm.

Figure 8. Voltage at each bus before and after allocating the filters using the two algorithms.

Figure 9. Power factor at each bus with the old and new filter using the new algorithm.
From the previewed figures voltage wave form of the network at bus 3 is much distorted with no filters. When the old filter is injected to the network at bus 10 the waveform is improved, but after injecting the new filter, the waveform of voltage got close to the sinusoidal waveform. The voltage at each bus also was very low, the old filter slightly improved it, but the new filter set it within IEEE standers limits. Power factor reached 0.83 without filter and the old filter improved it to 0.92. The new filter improved the power factor at the far buses from bus 18 to bus 22 as the old filter was this lowering in power factor at these buses one of his shortcomings.
In this paper, based on power balance, filter characteristics, quality factor, voltage, and harmonic distortion standards, a STPF has been designed for a distribution system to reduce cost, actual power losses, THD, and IHD. These filters have been designed using a new algorithm combined between JFOT and AOA. First the results of each algorithm was calculated separately. The new algorithm made a combined between the two algorithms as it used the results of the JFOT as a new data of the AOA. The new technique have been applied in a real system at Tala city that was already has a STPF. The results of the optimization technique have been provided the new optimal filter values and their new placement. The results show that the new designed filter gave the best filter parameters than the old one. Also the filter parameters have achieved the limits of IEEE standers.
Journal of Electrical & Electronic Systems received 733 citations as per Google Scholar report