Research - (2025) Volume 14, Issue 1
Received: 03-Feb-2025, Manuscript No. MBL-25-162517;
Editor assigned: 05-Feb-2025, Pre QC No. P-162517;
Reviewed: 17-Feb-2025, QC No. Q-162517;
Revised: 24-Feb-2025, Manuscript No. R-162517;
Published:
04-Mar-2025
, DOI: 10.37421/2168-9547.2025.14.471
Citation: Abbas, Fatima Musbah, Ahlam Khalofa, Hanan Musbah Abbas and Selma Elsheikh Abdelrahman, et al. “Characterizations of Carbon/Copper Oxide Nanowire (CCONW) Composite Based on Pre-Carbonized Date Palm Leaves (PCDPLs) and Additives Filler Composed of Carbon Black (CB) and Copper (Cu) Powders.” Mol Biol 14 (2025): 471.
Copyright: © 2025 Abbas FM, et al. This is an open-access article distributed under the terms of the Creative Commons Attribution License, which permits unrestricted use, distribution and reproduction in any medium, provided the original author and source are credited.
The Carbon/Copper Oxide Nanowire (CCONW) composite was prepared with direct mixers of self-adhesive Per-Carbonized Date Palm Leaves (PCDPLs), hydrocarbon (Carbon Black) (CB) and Copper (Cu) powder at 1000 °C. The copper has been added to improve it is electrical performance. The CCONW generated was examined using X-Ray Diffraction (XRD), Energy Dispersion X-Ray Diffraction (EDXD), scan probe image pressing, Scanning Electron Microscope (SEM), ultrasonic methods and a four-point probe. A check-up experiment was also applied to confirm the growth of the Cu2O nanowire was carried out using a Si/SiO2 plate coated with a thin layer of Ni annealed at 400 °C and heat treated at 800 °C under a nitrogen and methane environment. The X-ray diffraction results show an h highly ordered composite that has become polycrystalline with a crystalline structure in good agreement with pure graphite. The X-ray also observed a Copper Oxide (Cu2O) in the composite structure, which was identified as Cu2O, nanowire by (EDXD) Techniques. The surface morphology of the composite surface displayed agglomerates of particle size, indicative of dispersion, which is probably the result of improving mechanical performance. The results of YM increased and electrical conductivity increased from 13.9 GPA to 26.98 GPA and from 5.77 (Ω cm)-1 to 35.85 (Ω cm)-1 to increase the (CB+Cu) content from 0% to 50%, respectively. YM (26.98 GA) of CCONW prepared by 50% PCDPL equals pure graphite (27 GA). In addition, the porosity varied between 0.27% and 0.42% reduced with an increase in the (CB+Cu) content. These findings show that CB and Cu are important in converting the non-graphitic structure into a more graphitic structure and synthesizing copper oxide nanowires on the composite surface, with the internal microstructure mainly micro porous. Final results concluded that an optimum interaction between carbon, carbon black and copper oxide nanowires with a higher mechanical and electrical conductivity and properties on surface area, mainly micropors/micropors. The scan probe image pressing techniques were also used to analyse the nanowire structure.
Carbon composite pellets • Date palm leaves • Carbon black • Copper • Crystallite dimensions • Surface morphology • Copper oxide nanowire • Young's modulus • Surface area • Porosity • Electrical conductivity
Composite materials have favored the research and production industries due to their desired features that cannot be attained by individual materials [1]. Composite materials also provide benefits such as weight reduction, decreased fatigue and corrosion, customized strength and stiffness and cheaper cost [2]. Therefore, their properties meet different applications as well in overall engineering design [3], thermal applications [4], electrochemical capacitors as energy storage devices [5] and aerospace [3]. Primary Carbon-Carbon (C/C) composite materials are the thermo tolerant structural materials for advanced aircraft composed of carbon fibers and matrix phases (such as coke, carbon and graphite) and have the characteristics of high mechanical performance, electrical conductivity and thermal conductivity [6] such as carbon/glass hybrid composites [7] and polymer reinforced carbon fiber [8].
Carbon materials come in three main forms: granular, powder and pellet [9]. Pellet-shaped provides a deeper understanding of its physical properties and surface interactions [10-12]. Carbons with high electrical conductivity and chemical stability make them attractive for electrochemical applications. Various methods have been attempted to improve its properties, including low- pyrolysis temperature [13], carbonizing process [14], chemical treatment and carbon additives' filler [15-19]. Frequently, carbon black has been used as carbon additives to improve electrical properties [5,18,20]. In addition, work found that the electrical conductivity can be increased by increasing black carbon concentration [17]. Copper powders have been used early as additives in carbon brush [19] and copper -graphitic additive [21]. Therefore, in the present work, carbon black and copper powder have been added to precarbonize date palm leaves powder as additives filler to improve the electrical conductivity of the composite carbon produced [17].
On the other hand, carbon-carbon composites with metal components have been combined to enhance mechanical performance and electrical conductivity while reducing the cost of the c/c join structure, such as aluminum metalreinforced carbon fiber [22]. So far, metal oxides play a crucial role in various fields of physics and chemistry, forming and diversifying into compounds. Composite carbon electrodes can be prepared by mixing manganese oxide with carbon materials using a binder, resulting in manganese oxide –carbon Nano composites and manganese oxide –carbon nanoparticles [23].
These compounds can reproduce their numerous structural geometries with electronics and are used in semiconductors and insulators and in technological applications in manufacturing microelectronic circuits and surface coatings to protect against corrosion [24]. Copper oxide has a variety of potentially valuable physical features, including high- temperature superconductivity [25] biosensors, heterojunction and biomedical [26-30]. It has been found that copper can form three types of oxides: Cuprite (Cu2O), Tenorite (CuO) and Paramelalconite (Cu4O3). Cuprite (Cu2O) and Tenorite (CuO) are the most stable compounds [31].
Copper oxide nanowire fabrication has been achieved through various techniques, including thermal oxidation [32-34] and radio frequency reactive plasma [35]. The growth of particles occurs due to the decomposition of copper particles into vapors during the carburizing process [11], which can be seen in Figure 1. Kosicek M, et al. [32] argue that the diffusion of copper occurs due to the reduction of contact points between Cu layers. The oxidization process occurs during the pyrolysis mechanism, releasing carbon monoxide and oxygen from the biomass precursor [36-38]. Biomass materials, such as date palm leaves (Phoenix dactylifera L.) biomass, were utilized to make activated carbon materials with high carbon yield and surface area [16,39]. Date palm leaves are categorized as lignocellulose biomass, consisting of hemicellulose, cellulose and lignin as the main by- products.

Figure 1. Decompose of Cu2 into a nanoparticles vapour in the heating chamber during the carbonization process.
Date palm leaves are a valuable resource for preparing carbon material [40] and liquid phenolic acid [38] due to their abundance, high carbon content and economic feasibility [41]. They are used to manufacturing ropes, rope baskets and fuel. Additionally, it has been used as a bio monitor detector of heavy metals in atmospheric dust [41]. Date palm wood biomass also has advantages as a composite reinforcement, improving its mechanical properties with or without chemical agents [42,43]. X-ray diffraction programs and methods are used to analyze diffraction data and calculate graphics-like structures, essential for describing physical and mechanical properties of the carbon material [44]. There are many XRD software programs that have been applied to assess accurate measurements of the crystallite dimensions, such as Trace, Maud and Win Fit.
The CCONW composite produced in the present work was characterized using various methods, such as X-Ray Diffraction (XRD), Energy Dispersive X-Ray Diffraction (EDXD), Scanning Electron Microscope (SEM), ultrasonic techniques, porosity and four point probes. The research seeks to close a gap in the development and characterization of Carbon/Copper Oxide Nanowire (CCONW) composites by combining Pre-Carbonized Date Palm Leaves (PCDPLs), Carbon Black (CB) and Copper (Cu) powder. While some research is on carbon composites and metal oxide nanowires, the exact combination of the two substances and their direct mixing approach at 1000°C may not have been thoroughly investigated. This study aims to thoroughly analyze the composite material's structural, mechanical and electrical characteristics, with a special emphasis on understanding how composition variations impact variables such as Young's Modulus (YM), porosity and electrical conductivity. And review data was also included.
Sample preparation
(Phoenix dactylifera L.) or date palm leaves, were gathered in southern Saudi Arabia's rural, urban and urban regions. After chopping the raw palm leaves into tiny pieces and rigorously washing them in hot water to remove dust and contamination, they were dried at 100 °C for about 4 hours. Following that, they were pre-carbonized in a vacuum chamber at 280 °C, resulting in the leaves shrinking and breaking down their microstructure, releasing the noncarbon content [38]. Each of the three shades of Pre-Carbonized Date Palm Leaves (PCDPLs) was medium, brown, or dark brown. The Pascal 9V5 mill apparatus (model 1679-V5-A) was used to ball mill the PCDPL to create a fine-grain powder.
The grain powder of particles with sizes of ≤ 10-micron is depicted in Figure 2. The grain powders manufactured are packed in clean, self-sealing plastic bags with silica gel until used. The particles of ≤ 10 microns and of 50%, 60%, 70%, 80%, 90% and 100% concentrations (by weight) were added to mixtures of commercial hydrocarbon Carbon Black (CB) and Cu powder (from Aldrich company) in a weight ratio of CB: Cu (3:2), which contains 10%, 20%, 30%, 40%, 50% by the weight concentration. These compounds were blended manually and isolated in a different container until used. One gram of each compound was changed into pellets by pushing the mold with a 12 metric ton of pressure. The project was designed to achieve a 1 cm diameter without adding any binder. All the grain pellets showed the perfect self-adhesive property before being carbonized at “1000 °C” in a nitrogen atmosphere using the equipment (Vulcan Box Furnace 3-1750), which employed a multistep heating profile.

Figure 2. Heating chamber used to synthesis Cu2O nanowire on Ni/SiO2/Si substrate.
With the temperature gradually raised, these pellets underwent a multistep heating profile to carbonize them at 1000 °C in a nitrogen atmosphere using multistep heating profiles Programs were set to heat at 1 °C per minute from room temperature to 375 °C. This temperature was maintained for an hour, after which the heating was continued at a rate of 3 °C per minute to 800 °C and then 5 °C per minute to 1000 °C, where it was finally kept for 5 minutes [40].
Afterward, the system was set to reach room temperature automatically. After completely rinsing the samples with hot distilled water to remove any remaining contaminants, they were dried at 100 °C in the oven for four hours. A micrometer was used to measure the dimensions of pallets before and after carbonization. The sample’s weight was divided by volume to estimate the bulk density. The values were recorded as an average of five replicates of each sample and were represented as a graph with PCDPLs as a function of temperature.
Synthesis of Cu2O nanowire in Si/SiO2/Ni substrate
The Si/SiO2 plate substrate was washed by ultrasonic techniques and a Ni layer was coated on the Si/SiO2 substrate by sputtering techniques for 120 seconds, followed by annealing process in a vacuum chamber at 400 °C for 30 minutes. (See Appendix A). The Si/SiO2/Ni layer compounds were held on a copper plate placed on untreated PCDPLs grain pellets and the heat treatment was carried out at 800 ℃ under a nitrogen and methane environment as shown in Figure 2.
X-ray diffraction
An X-ray diffraction experiment was conducted on carbon composite pellets and treated carbon pellets by using a Rigaku D/Max-X-ray diffractometer, operating at 40 kV and 40 mA with Cu-Kα radiation, at a rate of 5s for every 0.1-step size in a diffraction angle (2θ), between 20°and 70°. Following the corrections for the instrumental line broadening and the line background, the X-ray diffraction spectrum could be fitted into a symmetrical Gaussian distribution curve. The diffracted intensities were analyzed using the Traces Varian 5 program from Diffraction Technology PTG LTD, Australia, which meant the calculation of crystallite dimensions such as interlayer spacing (d002) and stack height (Lc) of graphite-like crystallites using Bragg’s Equation and Scherer’s Equation (1) to check whether the accuracy is well maintained.
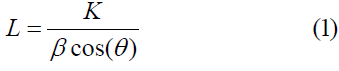
Where θ is the scattering angle position, is the wavelength of X-ray diffraction, K is a shape factor equal to 0.9 for Lc and 1.84 for La, β is the width of a reflection at half-height shown in radians.
Scanning Electron Microscope (SEM)
The SEM photocrograph was examined for the selected carbon composite samples and Si/SiO2/Ni layer compounds using an S440-Leica Scanning Electron Microscope (SEM) instrument of magnification 2.00 Kx, which has a Probe of 100 PA and EHT of 10.00 KV. Three dimenstanal image analysis processes was carried out for selected SEM photograph by using Scan Probe Image Pressing.
Energy Dispersions X-ray Diffraction (EDXD)
Energy Dispersions X-ray Diffraction (EDXD) is a technique that analyzes the energy of X- rays diffracted by a crystalline sample to provide structural information about the sample. Energy Dispersion X-Ray Diffraction (EDXD) of the nanowire compound growth on the CCPs surface has been applied.
Scanning Electron Microscope (SEM)
The SEM micrograph was characterized for selected carbon composite sample using a S440-Leica Scanning Electron Microscope (SEM) instrument of magnification 5.00 Kx, with a Probe of 100 PA and EHT of 10.00 KV for selected composite sample braked into a small piece
Ultrasonic techniques
The Ultrasonic pulse receiver, a Model 500 PR running at 25 MHz at room temperature and the PICO instrument equipped with the ADC-200 software were used to measure the ultrasonic velocity and Young's modulus of the CCPs before and after carbonization. The electric signals from the pulsar portion were converted by matching transducers into ultrasonic waves. The coupling medium at the probe-sample contact was petroleum jelly. An ultrasonic signal calibration was carried out using classy carbon (Sigradur- K) as a standard for longitudinal Velocity (V) and Young's modulus (YM). Sigradur-K validated the supplier's Figure with an error of less than 1%. The first step, a reference glassy carbon (Sigradur K) was used to calibrate the ultrasonic signal and measure the longitudinal velocity and Young’s modulus. The measured Sigradur K agreed well with the value given by the supplier with an error of <1%. The second step is that the composite area of the selected composite samples is scanned by the probe–sample interface to check if there are any cracks or voids. The measurements were taken of 5 replicates. Each replication was measured three times to verify the reproducibility of the longitudinal velocity and Young's modulus for a standard error of <2.8% was obtained. The calculated value of Young's Modulus (YM) for the one-dimensional wave Equation attenuation is given by
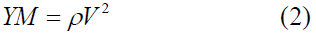
Where ρ is the bulk density
The elastic modulus I as a function of porosity (B) for bulk material was reported by many researchers [45] given as the ultimate analysis was estimated using the Equations (3) and (4) as
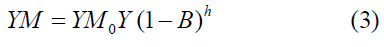
and
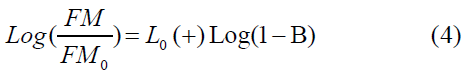
Where YMo is the elastic modulus for nonporous carbon material and h is the power exponential related to pore size distributions of a general range from 1 to 4 [46]. The measurement was carried out by plotting log (1 − B) vs. log (YM/YM0) by fitting of B until a best linear relationship fit is obtained with the slope of h and cut Y-axis (Log (Y).
Specific Surface Area (SSA)
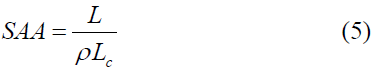
Then the specific surface area the CCOC can deduced from bulk density (ρ) and stacking height (Lc) by using early theoretical expression estimated by early work proposed by Dresselhaus MS, et al. [47] as
Electrical Conductivity (EC)
The DC electrical conductivity (EC) of the CPs was determined as follows: Initially, the carbon samples received washed with hotel disulfide water and dried in Avon for two hours at 100 °C. The I-V characteristic was evaluated using the four-point probe instrument (Keithley Micro-Ohmmeter); and ultimately, the electric conductivity (EC) [10] expressed as
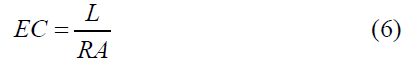
Where L is the sample thickness, R (Ω) is the electric resistance and A is the area of the sample.
Percolation theory
In addition the Electrical Conductivity (EC) was analyzed in terms of the percolation theory threshold above critical density (ρc), as:
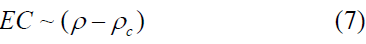
Where, ρc is the critical density. In this case, they reported that plotting of log σ vs. log (ρ-ρc) for ρT>ρc for various values of ρc leads in every case to a straight line, with the slope, n.
Particle size distribution of the SACG
The particle size distribution of the pre-carbonized date palm leaves produced by the ball milling process for 50 h is shown in Figure 3. These two samples produced different distributions, producing finer grains with all the particles ‹10 μm: 60 present ‹3.2 μm and 30–20 present 1.2–0.5 μm (Figure 4). Most of the particles were ‹5 μm.

Figure 3. Particle sizes of the gain powders milled for 50 hours.

Figure 4. Represent the XRD intensity for the CCONW.
X-ray Diffraction (XRD)
The X-ray diffraction of the CCPs with a sharp peak Bragg's peaks planes (002), (110), (111) (100) and (111), located approximately at 26.38°, 28.44°, 36.16°, 40.55°, 43.23° and 50.30° as shown in Figure 4, indicating that the structure of CCPs is polycrystalline structure, obvious that formation of a layered graphite-type for all the composite sample produced corresponding to (002), (100) and (111) which represent the graphitic like structure indicating that we can reach the graphitic during the pyrolysis mechanism using a multistep heating profile up to 1000 °C or either CB or Cu play as catalyst support to reduce the graphitization temperature. This reduction of the graphitization process is expected to have an economic benefit for the manufacturing company. The other reflection peaks plan (110, (111), located approximately at 26.38° and 36.16°, are identified as Cu2O compounds by further X-ray diffraction analysis in Figure 4.
Figure 5 displays the X-ray diffraction intensity of the untreated (100% PCDPLs). In this stage, the diffractions are wide, which means that the crystalline structure is small and the graphitic carbon layers are randomly oriented. The Bragg peak at the (002) and (100) reflection plan displays the development of a turbostratic structure. The instrumental line broadening and background line intensity also corrected this diffraction intensity that fit into a symmetrical Gaussian distribution curve [48,49]. When the correction was made, the scar formation, diffraction intensity and Bragg’s peaks matched the graphite structure and the layer separation was a little bigger than in a graphite structure, as shown in Figure 4.

Figure 5. XRD intensity for the raw carbon pellets prepared with 100% PCPPLs corrected into background line intensity.
The crystallite dimensions, such as the interlayer space (d002) and stakes orders (Lc , La), were calculated from Bragg's and Sherrier's Equations and shown in Table 1. The decrease in the d002 value, accompanied by the increase in the Lc and La values upon the decrease of PCDPLs content, can be explained by the fact that the non-carbon carbon elimination reaction occurred. Such behaviour is probably caused by the addition of CB and Cu as hard fillers to the PCDPLs, which, therefore, results in the increased mechanical properties of the product as a whole; thus, the occupational mobility is increased due to the improved electrical conductivity. Composites processed with 50% PCDPL content present the same data of graphite structure, such as bulk density and interlayer spacing (d002) being within the range of pure graphite.
| PCDPLs % | d002 (Å) | Lc (Å) | La (Å) |
|---|---|---|---|
| 50 | 3.36 | 259.1 | 961.6 |
| 60 | 3.37 | 347.4 | 481.6 |
| 70 | 3.39 | 319.9 | 289.3 |
| 80 | 3.41 | 333.0 | 192.4 |
| 90 | 3.40 | 200.4 | 197.2 |
| 100 | 3.65 | 016.1 | 029.6 |
The ideal combination of these three materials, i.e., biomass PCDPLs + MKS and Cu contents, with distinct contents, gives rise to carbon composite copper oxide nanowire with superior crystalline structure and mechanical performance improvement. On the other hand, the diffraction angle. D-spacing, Bragg's peak, composite compound and lattice constant are summarized in Table 2.
| Diffraction Angle (2 Theta) | d- Spacing (Å) | (h k L) | Compound | Lattice Constant (a) (Å) | |
|---|---|---|---|---|---|
| 26.38 | 3.454 | (002) | CCPs | ||
| 28.44 | 3.245 | (110) | Cu2O | 4.589 | 4.684 Allaker RP and Zhiyu Y [25] |
| 36.16 | 2.610 | (111) | Cu2O | 4.521 | |
| 43.23 | 2.140 | (100) | CCPs | ||
| 50.30 | 1.847 | (111) | CCPs | ||
The lattice constant of Cu2O (=4. 59Å) agrees with the review value of the cubic structure (=4.68Å), indicating that Cu2O produced has a cubic structure the X-ray data of the pure Cu2O compound is given in Appendix A. On the other hand, recent work by Grandin M and Wiklund U [21] mentions that the energy release of Cu2 molecule condensation is larger than the copper energy gap, so it is possible for particle growth of copper oxide by the diffusion of copper molecules (Cu2) and synthesis of the Cu2O compound by the following reaction,
Cu2 + CO → Cu2O + C Reaction 1
We also consider other reactions from releasing oxygen and carbon monoxide from the PCDPLs, as documented by the following researchers Dhyani V and Bhaskar T [36], Fermanelli CS, et al. [37] and Hussain A, et al. [38] the copper particles molecules with oxygen as follow. See (Figure 1).
2Cu2 + O2 → 2Cu2O Reaction 2
Refereeing to Figure 2 the outer surface of the Cu plate was removed slowly and analyzed by XRD and the result that was displayed in Appendix B confirmed that particles of Cu2O and Cu2 particles, which is supported that the decomposition vapor is due to C2 and the reaction 1 and 2. The Energy Dispersive X-ray Diffraction (EDXD) was executed on selected samples with a relative percentage of 50% PCDPLs. Other than these components, no other elements were observed in the EDXD spectrum in Figures 6 and 7. The visual inspiration of the electron image shows that thick Cu2O NWs grow vertically on the Cu/Cu2O.

Figure 6. Cu/Cu2O compounds.

Figure 7. Cu/Cu2O compounds.
Scanning Electron Microscopy (SEM)
SEM photographs were taken of selected carbon pellet composites are displayed in Figure 8 The surface look of carbon material can be influenced by the microscopic modifications and the slight differences in the shape that are not visible. The surfaces of the composites were asymmetrical, the different porosity and particle size and the inter-grain distance for the specific case of 50% and 60% PCDPLs contents were the most distinctive for the 50% and 60% PCDPLs samples, as compared to the other samples that have an almost higher porous size distribution.

Figure 8. SEM micrograph of the carbon composite pellets a) 50% PCDPL, b) 60%, c) 70% PCDPL, d) 80% PCDPL, e) 90% PCDPL and f) 100% PCDPL: Young's modulus (YM) vs. PCDPLs %.
The visual representation of the impact fracture surface for the composite samples, which is featured in Figures 6, regardless of the composite content, demonstrates the agglomerates of particle size, indicative of the dispersion and thus probably enhanced the strength. In addition, the morphological structure shown in Figure 6 improves the levels of mechanical adhesion and, in some cases, the molecular diffusion inside the composite can be converted into mechanical behaviour improvement. Figure 8f reflects the 100% PCDPL carbon pellets that are similar to composite photographs demonstrating the total change of the microstructure during the pyrolysis mechanism.
The visual representation The visual inspiration of the SEM image shows that thick Cu2O nanowires were growing vertically on the Si/SiO2/Ni substrate analyzed using Scan Probe Image Pressing ( as mirror image) given in Figures 9 and 10, (See Appendix B).

Figure 9. SEM micrograph of the CuO2 nanowire growth on Si/SiO/Ni analysed by scan probe image pressing.

Figure 10. SEM micrograph of the CuO2 nanowire growth on Si/SiO/Ni analysed by scan probe image pressing.
Bulk Density (ρ) and Young’s Modulus (YM)
The green pellets underwent carbonization and their weight and size significantly decreased as the object physically got smaller to stay intact. This means that the grain pellets were in the process of the pyrolysis mechanism, during which they were subjected to compressive stresses. Table 3 shows the bulk density of composite samples before and after carbonization. The bulk density of pre-carbonized pellets increased very slightly after carbonization when they were prepared with 50–60% DPLs and decreased with increasing DPLs from 70 to 100%. The density of the carbon composite pellets containing 50% to 80% DPL components is comparable to that of the pure graphite structure, which was specified at 2.226 g/m3. Also, density increased rapidly with decreasing PCDPLs% content, suggesting that the maximum density has been achieved.
| PCDPLs | Before Carbonization | Composite Carbon Pellets (CCPs) | ||||
|---|---|---|---|---|---|---|
| Grain Pellets | Carbon Pellets | |||||
| W1 (g) | Ρ1 (g/cm3) | W2 (g) | Ρ1 (g/cm3) | YM (Gpa) |
SAA (m2g1) | |
| 50 % | 1.00 ± 0.01 | 1.641 ± 0.01 | 0.622 ± 0.01 | 2.250 ± 0.001 | 26.98 ± 0.61 | 343.1 |
| 60 % | 1.00 ± 0.01 | 1.596 ± 0.06 | 0.593 ± 0.01 | 2.020 ± 004 | 24.13 ± 1.31 | 285.0 |
| 70 % | 1.01 ± 0.01 | 1.537 ± 0.05 | 0.562 ± 0.00 | 1.86 ± 0.006 | 22.26 ± 1.34 | 336.1 |
| 80 % | 1.01 ± 0.01 | 1.409 ± 0.03 | 0.526 ± 0.03 | 1.374 ± 0.009 | 16.42 ± 1.27 | 437.1 |
| 90 % | 1.01 ± 0.03 | 1.417 ± 0.04 | 0.476 ± 0.01 | 1.303 ± 0.031 | 15.57 ± 1.49 | 766.0 |
| 100 % | 1.01 ± 0.03 | 1.306 ± 0.06 | 0.3721 ± 0.03 | 1.167 ± 0.06 | 13.9 ± 1.58 | 1064.5 |
| Graphite | 2.260 | 27.00 | ||||
| Carbon glassy (Sigradur-K) supply | 1.540 | 35.75 | ||||
| Carbon glassy (Sigradur-K) (measured ) | 1.540 | 34.9 | ||||
| Nor NSM, et al. [13] | BET (330-744) | |||||
| Adinaveen T, et al. [10] | Smicropors (129.8522) | |||||
| Nor NSM, et al. [13] | Smicropors (280-687 | |||||
| Jasri MRM, et al. [50] | Smicropors (369-683) | |||||
| BET (Brunauer, Emmett and Teller) theory surface area, Smicropors : is the micro pores surface area | ||||||
The Young's Modulus (YM) for the composite with 50%, 60%, 70%, 80%, 90% and untreated carbon 100% PCDPLs are depicted in Table 3 and Figure 11. Boosting (CB+Cu)% contents usually results in YM with more forceful results for the composites with 50% PCDPLs contents of the composite (26.98 GPa) is nearly equal to that of the pure-graphite structure (27 GPa) as is shown in Table 1. It is shown that this filler plays a great part in the better reinforcement mechanism, as proven by the SEM photographs. This behaviour is probably caused by the inclusion of (carbon black and copper) into a flexible material; thus, the crystalline structure and the mechanical properties of more graphite structure are increased.

Figure 11. Young's Modulus (YM) vs. PCDPLs %.
Specific Surface Area (SSA)
Workers Table 3 surface areas of the selected CCON samples. It can be seen that surface areas varied between 285-766 m2/g. It is composed mainly of microspores structures as supported by BET surface area and microspores surface area reported by several workers [10,11,13]. While the surface area for the untreated composite sample (100% PCDPLs is 1064 m2/g which is lower than the surface area of activated carbon from gapes seeds activated with potassium carbonate (1222 m2/g) [16] and activated carbon based on date palm leaves activated with pot assume hydroxide 1416 m2/g [49]. Justified that such carbon black or copper oxide nanoparticles are caused to block pore size distribution and reduce the surface area of the composite produced.
Porosity
The porosity of the ACPs is estimated from Equation 3 and 4, by adjusting fits (B) until a good straight line fits. First, for the classy carbon (YMo= 35GPa) (Equation 8) and pure graphite (YMo= 27 GPa) (Equation 9). The plot of Log YM/YMo vs. log (1- B) by adjusting the values of B until they give a straight line with a slope of h =3.05 and a cutting axis of 0.303 and 0.415, respectively, as shown in Figure 12 and the fitting Equations are given in Equations (8 and 9). Both fitting data give a similar power exponential n of 3.05, which is in good agreement with the review value reported previously (in the range between 1 and 4) [46] for the three dimensions. The fitting data are presented in Table 3, showing that the B is in the range of (0.274%-0.415%) (Table 4) and (Figure 9).
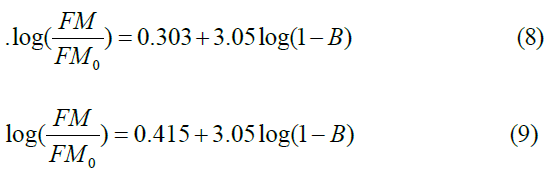

Figure 12. Log (YM/YMo) vs. Log(1-B).
| PCDLs % | YM | Log (YM/YMo) | B % | Log (1-B) |
|---|---|---|---|---|
| 50 | 26.98 | -0.11303 | 0.27389 | -0.139 |
| 60 | 24.13 | -0.16151 | 0.29381 | -0.15108 |
| 70 | 22.26 | -0.19654 | 0.31991 | -0.16743 |
| 80 | 16.42 | -0.32869 | 0.37655 | -0.2052 |
| 90 | 15.57 | -0.35178 | 0.37301 | -0.20274 |
| 100 | 13.9 | -0.40105 | 0.42212 | -0.23816 |
| Carbon glassy (Sigradur-K) supplier | ||||
| Carbon glassy (Sigradur-K) supplier | ||||
| Carbon glassy (Sigradur-K) (measured ) | ||||
Electrical Conductivity (EC)
The Electrical Conductivity (EC) of the CCONW is stated in Table 3 and Figure 13. This means that the SCC electron conductivity is expected to increase from 0% to 50% (CB+Cu) due to the high density of the electrical contacts between microcrystalline components. The progressive conductive composite layers are made as the number of the ordered carbon layers is increased; meaning that good intercalation of the composite layers has been achieved by this method. The electrical conductivity of the CCONW showed values between 5.77 (Ω. cm)-1 to 35. 8 (Ω. cm)-1 as shown in Table 5 and Figure 9. Suggesting that the temperature of carbonization and the concentration of filler that the charge carriers were able to overcome the granular structure of the carbon system to produce free carriers. Moreover, the sample usually shows electrical conductivity due to the interparticle bonding. The values of the EC for the samples made by 50% and 60% PCDPL are higher than that of glassy carbon (Sigradur K). This is the reason for better grain alignment and smaller porosity, resulting in more efficient mobility careers. For the sample, this can be transformed into 50% and 60% PCDPL-containing samples and thus can improve its electrical conductivity of CCONW [50].

Figure 13. Electrical Conductivity (EC) vs. PCDPLs.
| PCDPLs % | EC(Ω cm)-1 | Log (EC) | Ρ (g/m3) | Log (ρ - ρc) |
|---|---|---|---|---|
| 50 | 35.85 ± 0.244 | 1.55449 | 2.250 ± 0.001 | 0.29667 |
| 60 | 32.04 ± 0.166 | 1.50569 | 2.020 ± 004 | 0.24304 |
| 70 | 22.56 ± 0.561 | 1.35334 | 1.86 ± 0.006 | 0.2014 |
| 80 | 16.8 ± 0.234 | 1.22531 | 1.374 ± 0.009 | 0.04297 |
| 90 | 10.69 ± 0.89 | 1.06781 | 1.303 ± 0.031 | 0.0141 |
| 100 | 5.77 ± 0.611 | 0.76118 | 1.167 ± 0.06 | -0.04721 |
Percolation theory
The electrical conductivity is based on percolation theory, corresponding to the CCON whose densities are located above its critical density (ρ>ρc) by fitting log σ vs. log (ρ–ρc) as shown in Table 5 and Figure 14. This fitting was made by varying the values of ρc until the best linear curve fit is obtained, with the slope of 3.14 and the intercept on the y-axis is 0.634 and the fitting value of ρc was found to be 0.26 g/m3, which represents the percolation threshold (critical density) for the CCON produced. The result shows that the n is arranged between 1 and 4 and reasonably far further than the accepted universal value of n= 2 [51]. This is expected due to the higher EC of the CCON samples. However, the percolation theory was found to have a good correlation with the bulk density of the carbon samples and this was interpreted by the increase in the bulk density of the samples above 0.26 g/cm3. These results are given in Table 5 and Equation 10.

Figure 14. Log (EC) vs. Log(p-pc).
Research has shown that the composition of the CCONW composite pellets from the date palm during the process of its final preparation is partly determined by the physicochemical process and multistage heating profiles that result from the changes in the properties of the finished product to a more graphitic structure with the growth of copper oxide nanowire. The growth of Cu2O nanowire was also confirmed by heat treatment of Cu metal with Si/ SiO2/Ni at 800 °C in a nitrogen and methane environment. The SEM picture of the surfaces of the samples was neither symmetric nor balanced; the different porosity and particle sizes with the agglomerates of the particle size were distinct in the samples prepared with 50% and 60% PCDPL contents. The crystallite dimensions, Young's modulus and electrical conductivity of the composite were characterized as a function of date palm leaf concentrations in the production of the composite.
The ideal combination of these three materials, biomass PCDPLs + filler contain (CB and Cu), as distinct contents, gives rise to a carbon wire structure with superior improvement in crystalline structure, mechanical and electrical performance and reduced graphical temperature. In addition, the latter form of composite provides an optimum interaction between carbon, carbon black and copper oxide nanowires with higher electrical conductivity and mechanical performance with an internal microstructure composed mainly of microspores. The porosity content reduced with increasing (CB + CU)% content and the critical density due to percolation threshold was found to be 0.26 Kg/m3.
The authors extend their appreciation to the Deanship of Research and Graduate Studies at King Khalid University for funding this work through small- group research under grant number RGP 1/50/45.
None.
Google Scholar, Crossref, Indexed at
Google Scholar, Crossref, Indexed at
Google Scholar, Crossref, Indexed at
Google Scholar, Crossref, Indexed at
Google Scholar, Crossref, Indexed at
Google Scholar, Crossref, Indexed at
Google Scholar, Crossref, Indexed at
Google Scholar, Crossref, Indexed at
Google Scholar, Crossref, Indexed at
Google Scholar, Crossref, Indexed at
Google Scholar, Crossref, Indexed at
Google Scholar, Crossref, Indexed at
Google Scholar, Crossref, Indexed at
Google Scholar, Crossref, Indexed at
Google Scholar, Crossref, Indexed at
Google Scholar, Crossref, Indexed at
Google Scholar, Crossref, Indexed at
Google Scholar, Crossref, Indexed at
Google Scholar, Crossref, Indexed at
Google Scholar, Crossref, Indexed at
Google Scholar, Crossref, Indexed at
Google Scholar, Crossref, Indexed at
Google Scholar, Crossref, Indexed at
Google Scholar, Crossref, Indexed at
Google Scholar, Crossref, Indexed at
Google Scholar, Crossref, Indexed at
Google Scholar, Crossref, Indexed at
Google Scholar, Crossref, Indexed at
Google Scholar, Crossref, Indexed at
Google Scholar, Crossref, Indexed at
Google Scholar, Crossref, Indexed at
Google Scholar, Crossref, Indexed at
Google Scholar, Crossref, Indexed at
Google Scholar, Crossref, Indexed at
Google Scholar, Crossref, Indexed at
Google Scholar, Crossref, Indexed at
Google Scholar, Crossref, Indexed at
Google Scholar, Crossref, Indexed at
Google Scholar, Crossref, Indexed at
Google Scholar, Crossref, Indexed at
Google Scholar, Crossref, Indexed at
Google Scholar, Crossref, Indexed at
Google Scholar, Crossref, Indexed at
Google Scholar, Crossref, Indexed at
Molecular Biology: Open Access received 607 citations as per Google Scholar report