Short Communication
Pages: 1 - 4Jedidah Maina
Keywords: Average annual rainfall; Average maximum temperature; Trends; Climatological standard normal; Datasets; Climate change
Introduction
Establishment of rainfall and temperature trends of the agricultural area is important especially to the communities living in the area since they can be able to adapt by changing their farming practices and hence increasing their livelihoods from increased resilience in the face of climate change. The Intergovernmental Panel on Climate Change (IPCC) reported that most countries will experience increased average temperatures, more stressed water resources and unreliable precipitation [1,2].
Susceptibility of a country to climate change on the different sectors is related to the state of development, as indicated by the different impacts of climate change on the different sectors of a country’s economy [3,4]. Agriculture is one of the key economic sectors that are highly venerable to the impacts of climate change [5]. The agricultural sector contributes approximately 32.6% of the country’s GDP and employs more than 40% of the total population and more than 70% of the rural population in Kenya [6]. This means any major negative effect of climate change on agriculture would have serious consequences for the rural economy and the national economy as a whole.
Central Kenya, one of the country’s food baskets has been experiencing significant changes in temperature and precipitation trends. Recent research in Nyeri County demonstrates that rainfall received has been decreasing every 3 to 4 years [7]. Since the 1960s, the region’s minimum and maximum temperatures have been in the magnitude of 0.8-2.0 and 0.1-0.7°C respectively [8]. According to the Kenya Economic Survey Report Highlight, growth in Kenya’s agricultural sector fell from 4.2% in 2012 to 2.9% in 2013 and this was attributed to inadequate rainfall received in some grain-growing areas. In Kieni, constituency, Nderitu et al., reported declining long rains that fall from March to May between 1985-2015.
The research sought to collect and analyse average annual rainfall and average maximum annual temperature data for a period of 30 years to establish the trends which would then show the presence or the absence of climate change in the area. This would be benefiting the community since the presence of climate change brings about ways of adapting their farming practices to increase livelihoods and become more resilient.
Materials and Methods
Study area
The area of study is located in the greater Nyeri country. From the 2009 Kenya Housing and Population Census [9,10], Kieni had a population of 175,812 and covers an area of 1,378.10 Sq. Km. The amount of rainfall received in the area is affected by Mt. Kenya which is >4,000 m above sea level to the east and Aberdare Ranges to the west which is >3,000 m above sea level. The lowest area (1830m above sea level) receives about 850 mm of rainfall per year and rises to 2300 mm near the slopes of Mt Kenya to 3100 mm in the Aberdare area. Kieni East District where the study was carried out receives annual precipitation of 500 mm and is therefore classified as a semi-arid region. These Arid and semi-arid lands where Kienisub-county falls under are characterized generally by hot and dry climate, low and erratic rainfall that varies widely across space and time. The region experiences a bimodal pattern of rainfall with long rains falling around March/April and short rains falling in October/November.
Analytical methods
Rainfall trends: To establish rainfall trends in the study area, the annual monthly and the total annual average rainfall were computed for the years 1984-2013 using excel spreadsheets. The annual monthly average rainfall moving averages were computed and thereafter graphs drawn to show the overall trend over the 30-year period. According to the World Meteorological Organisation, in the absence of a climatological standard normal, a provisional normal can be computed from at least 10-12 years of the prior observations taken before the period under review. In this case, average rainfall records used were from Nanyuki meteorological station which had observations from 1959 therefore the normal was computed for a 25-year period from 1959 to 1983 and was used as the baseline [11]. The computed normal was subtracted from 1984-2013 the total annual monthly average, as well as the average rainfall computed each month within the period to obtain the annual and monthly anomalies and graphs, are drawn of the same were drawn.
Temperature trends: Temperature data available from Nanyuki meteorological station was from 1997 to 2014 with many gaps in between. For this reason, it was decided to analyse the data from the Nyeri meteorological station which was available from 1976 therefore the data under review was for the 1981-2012 period. The same procedure as the rainfall data of determining the annual average and the monthly average maximum temperature for the period under review was followed. However, due to the lack of enough data, the provisional normal was computed from 1976 to 1985 a 10-year period. The annual monthly maximum temperature was plotted against the years between 1981 and 2012 to obtain the average maximum temperature trends within the period. The graphs were also plotted of the annual anomalies as well as the average monthly anomalies.
Results and Discussion
Average annual rainfall trend analysis Rainfall data records were analysed for 1984-2013, a 30-year period. The annual total and average rainfall were calculated for each year and the average rainfall plotted against its corresponding year as shown in Figure 1 below. The average annual rainfall for the 30-year period was 646.4 mm while the total monthly average was 53.9 mm per month. The highest total annual average was 967.8mm in 1997 followed by 925.3 mm in 1988 and coming third with 924.7mm in 1998. Within the 30-year period the lowest average annual rainfall was in 2000 when only 287.1mm of rainfall fell, 1984 with 318.7 mm and 1993 with 370.0 mm.
Short Communication
Pages: 1 - 4FR Muwanika
Introduction: Temperature and rainfall are assumed to play an important role in the transmission of malaria. According to Zhou simultaneous analysis of the long-term time series of meteorological and parasitological data are critically needed to understand the effects of climate on malaria incidence. However, it would be more plausible to assess the effect of climate variation on the malaria incidence since increase or decrease in the number of malaria cases does not quantify the disease frequency.
Objective: This study therefore, seeks to examine the consequences of variation in climatic factors such as temperature and rainfall on the malaria incidence among the Ugandan population.
Methods: To account for variation and dynamics in monthly malaria incidence among the Ugandan population, data on environmental factors like minimum and maximum temperature, and rainfall were obtained from Uganda National Meteorological Authority (UNMA) while monthly malaria counts for the period (2006-2016) were obtained from Ministry of Health (MoH). Dynamically complete models were used to simultaneously investigate the impact of environmental factors on monthly malaria incidence in the population.
Findings: Findings revealed that the long-run impact of three months successive one percent increase in maximum temperature would result into an 8.1% reduction in monthly malaria incidence. Similarly, three months successive one percent increase in minimum temperature would increase monthly malaria incidence by about 16.7% in the long-run. The impact of rainfall was also significant in that successive one percent three months increase in rainfall would reduce malaria incidence by about 14% in the long-run.
Conclusion: Increasing maximum temperature is associated with a reduction in malaria incidence while increasing minimum temperature is associated with an increase in monthly malaria incidence. Lastly, increasing amount of rainfall is associated with a reduction in monthly malaria incidence.
Recommendations: In order to lower the incidence of malaria among the population, it’s imperative that malaria control and preventive interventions consider environmental modifications that lower minimum temperature and increase the amount of rainfall. These interventions include land use methods such as conversion of land from forests to settlements and agricultural activities, wetlands for settlements and other economic activities.
Introduction
Uganda experiences stable endemic malaria in 95 % of the areas of altitude 1200 to 1600 m. Malaria transmission is perennial with two peaks, D�?er the rainy season, (April-May) and the period between October-November. Temperatures between 20 and 30 degrees centigrade and relative humidity of 60% provide optimal conditions for malaria transmission. Hence, the temperatures in Uganda which range between 16-36 degrees centigrade provide ideal conditions for malaria transmission. ÐLs implies that understanding the malaria dynamics in the country requires understanding its link with temperatures and rainfall in a given month. Ðerefore, a model that links the monthly malaria cases with rainfall and temperature could be more accurate since these two factors have high correlation with increased disease burden, not only for malaria but also some other diseases. Previous studies have attempted to link malaria transmission to temperature based on clinical trials mainly in eÙ¹cDc\ studies. According to MacDonald, Bruce-Chwatt and Molineaux suggested that understanding the association between malaria incidence and environmental factors might be the most e�?Ù´ectLve way of predicting changes in malaria transmission dynamics and thus improve the impact of control e�?Ù´orts [1-3]. Furthermore, many studies have attempted to analyze seasonality in malaria incidence and environmental factors using dL�?Ù´erent approaches although there has not been a convincing approach that could be used across the continent including Uganda [4-8]. Ðerefore, there is limited literature on the dynamics of malaria burden based on routine data obtained in normal health setting that could be used to improve the design of control interventions based on environmental factors in the communities.
In the Eastern part of Africa especially Uganda where malaria is more prevalent during seasons of peak agricultural activities, the disease not only excludes the sick ones from daily agricultural activities but also the healthy ones who have to take care of their sick family members and relatives. According to UBOS over 80% of the Ugandan population is still employed in agricultural sector. Agriculture in most parts of the country still depends on natural climatic conditions of rainfall and environmental temperature [9]. Increased burden of malaria does not only D�?Ù´ect their health but also their incomes as well as food security at household level. It is estimated that workers su�?Ù´erLng from a malaria bout can be incapacitated for 5-20 days. Ðe lack of adequate manpower during the peak of agricultural activities decreases productivity and hence, lowers income and aggravates food insecurity [10]. A poor malaria-stricken family may spend up to 25% of its income on malaria prevention and treatment. It is estimated that 40% of health expenditures in Sub-Saharan Africa are spent on malaria treatment [11]. Understanding the dynamics between rainfall and environmental temperature over time will not only help in their forecast but also accurately predict the burden of malaria. ÐLs study therefore, attempts to assess the variation in environmental factors and their consequences on observed malaria incidence in the population.
Temperature plays an important role in the survival of the parasites in the anopheles mosquito vector. A study by Crag established that these parasites have a short development cycle which lasts between 8 to 21 days. Ðe parasites require an optimum temperature ranging between 27-31°C [12]. Furthermore, it was also established that temperatures below 19°C does not favor the Plasmodium falciparum species to complete their cycle and propagate malaria. ÐLs implies that in a country like Uganda with an average annual temperature ranging from 17°C to 36°C provides the best environment for the Plasmodium falciparum species to complete its cycle and propagate malaria in the population. Ðerefore, any model to predict malaria incidence in the population need to incorporate the e�?Ù´ect of temperature over time [13].
Temperature and rainfall are assumed to play an important role in the malaria transmission. It has been established that rainfall Lnfluences the availability of mosquito larval habitats and thus mosquito demography. According to Zhou simultaneous analysis of the long-term time series of meteorological and parasitological data are critically needed to understand the effects of climate on malaria cases [14]. However, it would be more plausible to assess the effect of climate variation on the malaria incidence since increase or decrease in the number of malaria cases does not quantify the disease frequency. Patz reaffrims that climate variability is epidemiologically more relevant than the mean temperature increase [15]. ÐLs implies that the use of the epidemiological measure of disease frequency like malaria incidence in studying the effect of temperature and rainfall through an appropriate model will shade some insights on how climate variation is affecting malaria transmission in Uganda. ÐLs study therefore, seeks to examine the consequences of variation in climatic factors such as temperature and rainfall on the malaria transmission among the Ugandan population [16].
Methods and Materials
Data sources
To account for variation and dynamics in monthly malaria incidence among the Ugandan population, data on environmental factors like minimum temperature, maximum temperature, and rainfall were obtained from Uganda National Meteorological Authority (UNMA). UNMA collects daily maximum and minimum temperatures as well as rainfall from the diffÙ´erent weather stations across the districts in Uganda. Monthly malaria counts for the period (2006-2016) were obtained from Ministry of Health (MoH). MoH through its health facilities collects routine data using a standard Health Management Information System (HMIS) form. Ðe HMIS 105 form is provided at all the health facilities across the country.
Data management and analysis
To explore the variation of malaria incidence and environmental factors, mean and standard deviations of each of the variables were computed. Furthermore, graphs of minimum temperature, maximum temperature, and rainfall and malaria incidence over time were plotted.
Test for stationarity
Each of the variables monthly malaria count, minimum temperature, maximum temperature, and rainfall were assessed to establish whether they were stationary before they were in the model. Augmented Dickey-Fuller test was used to test for stationary in the variables and establish the number of lagged variables in the model.
Multivariate analysis
To simultaneously estimate the e�?Ù´ect of environmental factors and monthly malaria incidence in the population, dynamically complete models were used. ÐLs framework was adopted to investigate the dynamics in both malaria incidences as well as in the environmental factors in predicting monthly malaria incidence among the population in Uganda because both malaria incidence and climate factors vary with time.
Model specification
where, A(L) is defined as the lagged values of monthly malaria incidence, B(L) is the lagged values of minimum temperature, C(L) is the lagged values of maximum temperature, D(L) is the lagged values of rainfall respectively.
Model Diagnostics
Ðe dynamically complete model was assessed for normality of the errors, serial correlation and model inadequacies. For normality of the errors, a plot of the residuals against the fitted values of monthly malaria incidence was done. A random scattering of the points above and below the line with nearly all the data points being within the band defined by 2-standard deviations is expected if the assumptions are sDtLsfied. Ðe model inadequacies are LdentLfied if the plot of the residuals against the fitted values gives asymmetric shape about zero.
Ðe presence of a serial correlation in the residual was assessed using the run test. Ðe test involved counting the number of runs or sequence of positive and negative residuals and comparing this result to expected number of runs under the null hypothesis of independence.
Results
Descriptive analysis
Table 1 shows the annual average malaria cases, rainfall, maximum temperature and minimum temperature observed across Uganda for the period 2006-2016. Ðe average monthly malaria cases observed for the period 2006-2016 was about 1.1 million cases. Ðe average monthly amount of rainfall observed was 117.6 mm. Ðe average observed monthly minimum and maximum temperature were 17.3°C and 28.7°C respectively as seen in Table 1.
Short Communication
Pages: 1 - 4Giovanni Acquarone
After having successfully sailed the Northwest Passage in 2012 with the first fully Italian expedition, Best Explorer, a 51 feet steel recreational sailing yacht, will complete the circumnavigation of the Arctic Ocean in 2019, from Japan to Norway, sailing north of the Eurasian continent (Siberia), from the Pacific to the Atlantic Ocean. The Northern Arctic Sea Route – NASR is an extremely long and challenging route: 8,500 nautical miles, most of which (4,500 n.m.) in the Arctic Ocean. The Team, on board and on shore, is composed by all members of “Arctic Sail Expeditions – ITALIA” association and Giovanni (Nanni) Acquarone, the skipper and expedition leader, is one of Italian guys having had an extensive knowledge of the Arctic, having sailed the most difficult sea courses of the world, even more in the legendary Northwest Passage. This is a project that will bring Italy’s name to the attention of the public once more and, if properly supported and advertised, will be an incentive for many to valiantly start other similarly outstanding feats.
Cultural and scientific projects will be carried out in parallel with the expedition, such as meetings with local communities or experimentation of satellite technologies (positioning such as GPS and Galileo, telecommunications and Earth observation), depending on partners or sponsor requirements.
Keywords: NASR; Maritime navigation; Arctic; GNSS; GPS; Galileo; EGNOS; QZSS; Satellite communications; Iridium; Globastar; Earth observation; Cosmo skymed
Introduction
Best Explorer, under the command of Giovanni (Nanni) Acquarone [1], was the first S/Y in the history of Italian navigation which, in the summer of 2012, successfully crossed the legendary Northwest Passage.
Best Explorer is a cutter steel S/Y of the following dimensions: Length 15.17 m and 17.00 m. with the aft bridge, and 4.34 m width. With a lift keel, the draft varies from 1.40 m and 2.90 m. It has a 95 HP Solé Diesel Engine. The sail area is 181 m². Best Explorer is ranked 100 A 1.1 by RINA. It displaces about 25 tons. The lift keel allows the approach and navigation on shallow waters, which are found frequently in the north. The bow has been reinforced and is in stainless steel with a thickness of 6 mm against the 5 mm of the rest of the hull (Figure 1).
Discovered between 1903 and 1906 by the Norwegian Roald Amundsen, who spent a long time studying - among other things - terrestrial magnetism, the Northwest Passage is that maritime itinerary that links the Atlantic Ocean to the Pacific Ocean passing through the maze of islands and ice of the Canadian Arctic Archipelago (Nunavut), which extends well above the Arctic Circle.
Best Explorer left Tromsø – in northern Norway – on the 1st of June 2012 and ended its trip to King Cove – on the southern coast of the Alaskan peninsula – on the 14th of October same year, after 140 days of navigation and a measured distance on the sea of 8.181 nautical miles (about 15.000 km), touching the maximum latitude of 74° 30' North (less than 1.700 km from the North Pole) in Dundas Harbor on the southern coast of Devon Island.
Difficulties were not lacking in its pilgrimage. From an instrumental point of view, the proximity of the magnetic north pole has rendered the compass unusable for all the central part of the journey (from the Davis Strait to Gjøa Haven on the King William Island) and the lack of GPS signal, guaranteed up to the latitude of 70° North, it has further complicated things; in addition, the cartography has not been of great support fundamentally because there is not (fortunately) still a commercial interest in those areas of the planet, nobody cares about detecting the depth of the waters and coastlines with the necessary accuracy.
Literature Review
From the meteorological point of view, the forecasts were found to be somewhat unreliable due to the extreme variability of atmospheric conditions and, once again, to the scarce commercial interest; the melting of ice that occurs from year to year with different effects does not simplify navigation because, due to the currents and winds, the huge pack slabs wander unpredictably and clog the narrow passages between an island and the other. We have had the opportunity to experience the distressing experience of getting stuck in ice on several occasions, sometimes only for a few hours, sometimes for several consecutive days (Figure 2).
The whole travel experience, already told by the media, is now transcribed in the book "Senza Bussola Fra I Ghiacci", published by Mursia-Italy, presented in preview at the event dedicated to the sea literature "Lerici Legge Il Mare", Lerici (SP) Italy, on the 10th of September 2017 [2] (Figure 3).
From 2012 to date, Best Explorer has not stopped and sailed along the southern coasts of Alaska, western Canada, the
United States, Mexico and Baja California, the Galapagos, Polynesia, Rarotonga, Tonga, Fiji, Vanuatu, New Caledonia, Australia and its coral reef, and finish on August 2017 in Sorong in West Papua (Indonesia). In 2018, then, Best
Explorer sailed from Indonesia to the Philippines and Japan, touching the major towns to promote the "made in Italy", in collaboration with the Italian chambers of commerce.
Short Communication
Pages: 1 - 4Sushil Khanduri
Localised heavy rains in the early hours of 14 August, 2017 in the catchment of the tributaries of Kali river, particularly Simkhola Gad and Malpa Gad, caused slope instability and damage in Mangti and Malpa areas respectively. As many as 9 persons were died while 18 persons went missing and 51 animals were lost in these incidences that caused heavy loss of other infrastructure and facilities. Changing pattern of rainfall, construction on loose soils/overburden materials, steep slopes, high altitudes, structural weaknesses and slope degradation processes have significantly increased slope instability in the area that has often resulted in devastated in the area. Besides, increasing economic opportunities in the vicinity of the roads encourages people to settle down in the proximity of the roads and streams. The present paper provides causes of devastation and issue related with this disaster with possible mitigation.
Keywords: Dharchula; Flash floods; Losses; Causative factors; Suggested measures; Uttarakhand
Introduction
In the recent times extreme rainfall events have become common and recurring phenomenon in the Himalaya, especially in Garhwal and Kumaon regions of Uttarakhand and in most of the year’s extreme rainfall events were reported in August during the latter part of the monsoon season [1]. Kandauliya Gad, Uttarkashi (August, 1978), Kaunth, Chamoli (August, 1979), Thalisain, Pauri (August, 1989), Mandal, Chamoli (August, 1991), Bhenti, Rudraprayag (August, 1998), Malpa, Pithoragarh (August, 1998), Burakedar-Agunda, Balganga valley, Tehri (August, 2002), Lah- Jhekla, Pithoragarh (August, 2009) and Asiganga, Uttarkashi (August 2012) in different part of Uttarakhand are the evidences for extreme rainfall events [2-4]. It is observed that the debris flows were the main cause of devastation in all the previous extreme rainfall events and associated disasters.
As communicated by District Emergency operation Centre (DEOC) Pithoragarh flash flood incidences took place at Mangti and Malpa areas on 14 August 2017 amid heavy rainfall at early morning (2:30 am) in the catchment of the tributaries of Kali River, particularly Simkhola Gad and Malpa Gad. Flash floods and toe erosion induced by incessant heavy rainfall in the devastated areas led to loss of human lives, infrastructure and property. This also triggered landslide and debris flow at many places in the vicinity of the devastated areas. No vehicular movement to Mangti and Malpa was thus possible after this tragedy. However, rainfall data could not be recorded due to the absence of meteorological observatories in devastated areas. The details of the losses are summarized in Table 1.
These devastated areas were investigated after the disaster and

traverses were taken around the affected sites to examine the slope instability. Preliminary geological investigations of the study area has been carried out on the basis of Survey of India toposheet numbers 62 B/12 and 62 B/16 on 1:50,000 scale and final field checks.
Literature Research
Pithoragarh: A disaster-prone district
Pithoragarh district is the easternmost frontier district of the Uttarakhand and falls in lesser and Higher Himalaya. Like any other hilly terrain of the state it is most vulnerable to natural disasters. Available extreme rainfall events are collected from various sources and are described in the sections below. During the monsoons of 1998 major rock fall occurred in Malpa that inflicted heavy losses in Malpa village in Pithoragarh district. More than 200 persons were killed in this incidence [4].
In the year 2005, near Dharchula and Munsiyari areas were badly affected due to cloudburst and heavy rainfall. A number of cultivation land and a bridge at Syangatha were washed off. Madkot area of Munsiyari has been destroyed due to lake formation by the Gori and Kali rivers [5]. The Kumaon region was hard hit by landslide and flash floods yet again in 2009 and 2010. In the year 2009, landslide disaster occurred on Kuity village on Berinag-Munsiari road. Two Villages namely Jhakhala and Lah were washed off and took 43 lives [6].
In August 2010 cloudbursts occurred on Munsiari area. Around 38 persons were died in this incidence [7]. 18 September 2010 initiated by heavy rainfall and cloudburst resulting in 19 deaths, widespread damage to property and infrastructures. Landslide hit a primary school at Sumgarh village, Tehsil Kapkot of Bageshwar district where alone 18 children died, and 25 children were severally injured [8]. Similarly, during the monsoon of 2016 as well Didihat, Bastari and Naulra villages of Pithoragarh district were devastated by debris flows and landslide incidences that took toll of 21 human lives [9]. Because of close vicinity of Main Cenrtal Thrust (MCT) zone, the area located in earthquake sensitive region and often experiencing seismic tremors. The area also lies in the high Seismic Zone V [10] and earthquakes of 1979 and 1980 in Dharchula tehsil ravaged several villages along the Kali valley.
The study area
The area investigated lies in the Higher Himalaya in Dharchula Tehsil of Pithoragarh district of Uttarakhand, India and falls in the catchment of Kali River which makes the International boundary between India and Nepal (Figure 1). Enroute to pilgrimage around KailashMansarovar in Tibet, Chota Kailash and Om Parvat in this region are main attractions. The devastated Mangti area (N 30°00'36.211" and E 80°43'7.925") is located at a distance of 30 kilometers from Dharchula town on the roadway. Malpa area (N 30°03'10.959" and E 80°46'12.755") can be approached by road till near Jibti village that is located at a distance of 36 km towards NNE direction from Dharchula. From Jibti one has to travel on foot for around 7 kilometers to reach Malpa village.
Geomorphology and geology of the area
Short Communication
Pages: 1 - 3Rajendra SP
It should be agreed that all objects like planets, stars etc. float in the full vacuum universe. It should also be agreed that atmosphere possessed by these objects is due to gravity and the atmosphere is in the open system full vacuum universe. Here, air molecules always try to escape in full vacuum universe against gravity to have uniformity in the universe. Means it is balanced between gravity and full vacuum universe. It is in science textbooks that the Earth’s atmosphere exerts pressure. But, to have pressure in the system, it must be isolated by boundary and its value is same at any point within. Here, Earth’s atmospheric air neither uniformly distributed nor in a closed system. It is known that gravity is holding each air molecule towards the Earth. On surface, air has high-density molecules and as further go away molecules density decreases. This density difference is balanced between gravity and full vacuum universe. This paper uncovers the misconception regarding Earth’s atmosphere exerts pressure due to its air molecules vertical column mass. To prove the argument, the manometer experiment is visited. In this experiment author makes the effort to raise mercury filled tube up against gravity above pot level then inverts it. Here, mercury level drops because of gravity which creates a vacuum in the top of the tube. This causes reduced surface energy inside wall of the tube. To be in the equilibrium state with outer tube wall, inner wall surface tries to suck in all direction that holds mercury up against gravity that means tube mercury weight is balanced by vacuum and that is demonstrated.
Keywords: Atmosphere; Gravity; Open system earth; Air molecules; Homogeneous state; Manometer; surface energy; Absolute pressure; Vacuum intensity; Full vacuum universe
Introduction
Galileo had observed that water is not rising in an exhausted tube to a height greater than thirty-three feet, but he was not able to offer a satisfactory explanation of the phenomenon. He believed that there is something in a suction side that balances the weight of water [1]. In 1643 Torricelli had demonstrated that the height at which the water stood depends upon nothing but its (let’s say mercury) weight as compared with the weight of air vertical column outside. Here, it is noted that tube was filled with mercury and raised against gravity was by Torricelli. So, work was already done by himself and not by the atmosphere. To elaborate more, refer to the Figure 1. Here, two different radius pots with same radius tube experiment demonstrated. If the atmosphere has pressure to raise mercury against gravity, Mercury in right tube (pot radius 200 mm) must rise higher than the left side tube (pot radius 100 mm). But this is not the case, So, Torricelli’s argument is wrong on why mercury shows 760 mmHg reading every time on Earth surface.
Literature Review
Let us consider different situations where mercury manometer is elevated/lowered against Earth’s sea level. Firstly put two manometers as per Figure 1. Here, left-hand side mercury manometer pot has less exposed surface area compared to right-hand side manometer pot. So, as per Torricelli’s principle, the force exerted by the atmosphere on right side pot is more. It means it has to raise more mercury than left side against gravity if atmosphere has a pressure to do work. Here, mercury is raised against gravity by the author by taking closed end up to invert the filled tube. So, work already done to elevate mercury against gravity. It is same analogy as injection fill up by efforts taken to create a vacuum at back side ass per Figure 2a. If the tube is of bigger dia and long enough mercury drops due to gravity that creates a vacuum on top of the tube tries to suck in all direction that holds mercury up against gravity. Another experiment can be done with the conical transparent manometer. Here Mercury level will be less compared to standard as per Figure 2b. Which reduces inner wall surface energy. To be in equilibrium with tube outer wall in all surfaces, inner wall surface tries to suck direction. Here, it is clearly visible that walls bulge inside due to gravity works to lower mercury level [2]. Now, consider manometer kept on Mt. Everest. Here, mercury will rise low compared to sea level. That is because tube wall faces have less surface energy difference. Here, inside wall having full vacuum has lower surface energy compared to outside wall having low density atmosphere. A lab experiment can be demonstrated by creating partial pressure in the closed container and putting manometer inside it. Here, vacuum intensity inside the tube is less. Now, consider a tin closed in outer space (Figure 3a). Here, both side molecule densities are very less and same. Once it is released, Earth gravity takes it to dense atmosphere (Figure 3b). Here, gravitational energy is used to increase the tin outer wall surface energy by taking tin to higher density air. To be in equilibrium between inner and outer wall surface, the outer wall gets crushed to have a concave surface (reduced surface energy). Now consider open tin is kept at sea level on Earth (Figure 3c). Here wall both side surface energy is higher and equal. When air is pumped out from tin, pump works to reduce inside wall surface energy (Figure 3d). So, it gets crushed inside to have a convex surface (surface energy increases) to get equilibrium with outer wall. Now consider the tin with atmospheric air inside and lowered in water. Here, tin is lowered against buoyancy of fluid in support of gravity by the author. So, surface energy increases at outside wall by outside water is a result of external work done by the author.
Short Communication
Pages: 1 - 2Vincent O Otieno, Moranga P Samwel and Beatrice A Abutto
Climate variability and change has been found to be one of the factors that affect economies leading to food insecurity in various parts of the world. Kenya is no exception. This study looks at how climate variability has contributed to food insecurity in Kisii County, Kenya. The objectives of this study is therefore to, (i) to examine the rainfall and temperature trends in Kisii County for a period of 30 years, (ii) to examine the effect of climate variability on food production and (iii) to assess the perception of local farmers on weather and climate information, (iv) to evaluate the coping strategies adopted at household level to bridge the gap on food deficit and (v) to assess the nutritional status of children and the elderly in Kisii County. The data used was mainly rainfall and temperature data from meteorological stations and sample data gathered from selected groups. The study population comprised of children between 6 months and 59 months, household heads, elderly people and agricultural officers. Purposive sampling was used to select agricultural officers while multistage sampling was used to select respondents at household level. Primary data was collected by use of a pre-tested questionnaire. The Measurement of Upper Arm Circumference (MUAC) tape was used to collect nutritional status of children while Body Mass Index (BMI) data was obtained from elderly people. Mann Kendall statistic was used to determine whether the trend of rainfall and temperature observed is significant while Chisquare test was used to determine whether the coping strategies observed varied significantly at household level. From the analysis, rainfall has not shown any significant change in Kisii County while temperature trend has been significantly increasing over the years at 95% confidence level. This could explain the observed reduction in river levels. Analysis of crop production and price trends of major food crops in Kisii County showed a decreasing trend of food production leading to increase in price over the years. This meant that farmers could not produce enough to take them to the next harvesting season, making farmers to adopt different coping strategies at household level which differed significantly according to Chi-Square test. Malnutrition status of both elderly people above 59 years and children between 6-59 months were similar with 23% of both children/elderly being severely malnourished. This study has only looked at climatic factors such as rainfall and temperature. Other aspects such as depth of underground water, pH level of soil and the effects of land fragmentation also need to be looked at. This study is important to both farmers in choosing the right crop to plant, and policy makers and planners in formulating the best mitigation and intervention strategies for Kisii County food insecurity problem. This will further contribute to national efforts towards achievement of vision 2030.
Keywords: Climate variability; Food security; Climate change adaptation; Malnutrition
Introduction
The Horn of Africa region has been attracting the attention of many researchers and donors as well due to the food crisis that led to famine conditions and severe food shortage in most parts of Somali, Ethiopia and eastern parts of Kenya during 2011 and 2012 boreal summer [1-6]. While many parts of the world also faced different weather challenges during 2011 and 2012; for instance, July-September Thailand floods in 2011 [7], March-August Texas USA drought [8], high temperatures over western Europe [9], February 2012 European cold spell [10] and the record winter drought of 2011–12 in the Iberian Peninsula [11] among others, the Horn of Africa situation was exacerbated mostly by non-climatic factors such as high global food prices, political instability, chronic poverty, and poor infrastructure among others. Nonetheless, climatic stresses associated with back-to-back failures in both the boreal winter and the boreal spring of 2007, 2008, 2009, 2011 and 2012 played a critical role [3]. Having recognized that climate variability and change is a major driving factor in most economic activities in the region, most governments such as the Kenyan government [12] integrates climate information in her policies. Climate change is quite noticeable, and it is intensifying at an alarming rate in terms of temperature increase and rainfall irregularity in Kenya [13]. For instance, [14] analyzing precipitation and temperature over the Greater Horn of Africa during the 20th and 21st century based on a sample of Coupled Model Intercomparison Project version 3 (CMIP3) models output found that the equatorial eastern Africa region (including the entire Greater Horn of Africa (GHA)) have been experiencing a significant increase in temperature beginning in the early 1980s, in both A1B and A2 scenarios. They further showed that minimum temperatures were projected to increase by more than 2°C above the Long-Term Mean (LTM) by the mid of the 21st century. This was further corroborated by Otieno and Anyah [15] who showed that temperatures were projected to increase at a rate of 0.3/0.40 C/decade under RCP4.5/8.5 scenarios in both equatorial GHA region leading to an approximate temperature increase of 2/2.50 C by the middle of twenty first century. Apart from the weather effect, food insecurity and famine can be caused by a number of factors such as low harvest, post-harvest losses, under nutrition [16,17], increase in food prices and population increase. While global population is set to grow to approximately 9 billion people by 2050 from the present 7 billion, which would require increased volume of food production, it is estimated that by 2080 the agricultural output in developing countries would decrease by 20% due to climate change [16,18]. In Africa; for instance, about 250 million people are likely to face food insecurity due to crop failure, loss of livestock and lack of water as result of climate change by 2020. It is also estimated that by 2040 drought is likely to reduce the area under cultivation of maize, millet or sorghum by 40-80% in sub-Saharan Africa [19,20].
In Kenya more than 500,000 farmers of tea have experienced erratic rainfall, greater frost and high temperatures that have threatened their livelihood [21,22], forcing most of them to device ways of coping with the shortages. In Bungoma County; for example, residents have devised many ways of reducing the impact of food insecurity by reducing the number of meals taken per day, working for cash or food, borrowing money to buy food, sell assets and some resorted to borrowing from sellers which makes them poorer [23]. Post-harvest food losses, the measurable quantitative and qualitative food loss in the post-harvest system [24], have also been a major factor contributing to the net harvest. Controlling post-harvest food loss is a key component in ensuring food security. Losses in post-harvest stage can occur due to various factors such as storage, handling, pests and weather conditions. In sub-Saharan Africa post-harvest losses are approximately at 40% of the total harvested cereals [24]. Once crops have been harvested, the unusual rains can dampen the crop yields and result in mould growth, a common phenomenon in developing countries due to reliance on weather (sun) for drying farm produce. If unfavorable weather conditions prevent the crops from drying, the post-harvest losses become high and at times mycotoxin producing moulds such as Aspersillus flavus may produce aflatoxin which can lead to health-related problems if consumed [25]. Nonetheless, in Kenya post-harvest loss is approximated to be at 50% mainly due to weather impact [24]. The aim of this study is to test the capacity of a novel technique for solar pasteurisation in order to assess its suitability for safely processing water for drinking purposes in developing countries. The device is to be used in environments where it is critical to pasteurise the water by reaching sufficient temperatures. Depending on what temperatures are reached and for how long, this would then provide safe drinking water [6]. In addition, conclusive results will allow for the pasteurisation device to be combined with a Passive Solar- Thermal Pumping system, currently being developed at University College London (UCL). This low-cost technology can be used for purifying drinking water, cooking or alternatively as a fuel-saving device, used to heat up water as an alternative to mainstream expensive, unreliable and unsustainable options. the cause of food insecurity in the County. For instance, Kumba and Francis [26] analyzed the influence of agricultural land use on household food security situation in Kisii central. From their study, natural grass or napier grass had a significant influence on household food security while crops and fruits were not [27] looking at the effect of land fragmentation index, quantity of planting fertilizer and the type of seed used found out that all these factors influence technical efficiency in food production [28]. Also, looking at the implication of land use/cover changes on food production and insecurity in Kisii County found out that the reduction of forest land due to rising demand for more agricultural land and settlement had impacted negatively on soil fertility leading to a decline in food production. While these studies have looked at the aspect of land use/cover change and type of agricultural land use, they didn’t consider the aspects of climate and its effects on food insecurity in Kisii County. Characterizing precipitation and temperature and further assessment of climate variability/change is a fundamental step in providing a baseline for understanding the effects of climate variables on food insecurity in Kenya, especially in Kisii County. This will be important for future climate change impact

assessment and for the management of food situation in Kisii County. The County with a population density ranging from 759 -1009 per square kilometer (Figure 1) and being one of the bread basket regions in Kenya is of utmost interest. Hence in this interrogates (i) the trend of precipitation and temperature in Kisii County for the past 30 yrs, (ii) the effect of the changes in temperature and precipitation on food production in Kisii County, (iii) The perception of farmers on climate and weather information (iv) coping strategies adopted at different household level in Kisii County and (v) nutritional status of the elderly above 59 years and children between 6 to 59 months. In the next section the different data types used and their acquisition method and a discussion of the overall methodological approach is outlined. Section 3 provides a discussion of the overall results. A summary of the overall findings and the main conclusions drawn from the study are provided in section 4.
Data and Methodology
Data
Data used in this study were categorized into two; secondary and primary data. Secondary data which consisted of rainfall and temperature data for the past 30 years (1983-2013) was obtained from Kenya meteorological stations in Kisii County and agricultural production details were obtained from sub-county agricultural offices of Marani and Bomachoge chache. Primary data consisting of Body Mass Index (BMI), nutritional status and trend in river levels were collected through pretested questionnaires. The study population consisted of household heads, children between 6-59 months, Adults over 60 years, County and sub-county agricultural officers involved in food production in Kisii County. The children below 60 months and adults over 60 years were chosen since they are more likely to suffer malnutrition [29].
Sample size and sampling technique: A Purposive sampling
Short Communication
Pages: 1 - 10Beidou Xi
China’s effort to mitigate soil organic carbon (SOC) loss caused by rapid land use changes over the last two decades faces great challenges. Generally, land use change projects in China have been performed without considering the mechanisms involved in the link between land use change and SOC dynamic. Such situation will likely increase the climatic and environmental risks brought by land use changes. In this paper, we illustrate why most studies over the past several decades in China have been unable to provide significant guiding information for what kind of land use can be adopted to benefit the climate and ecological environments. In addition, we recommend the combination of soil organic matter fractionation with radiocarbon assessment, which researchers are working on to better predict the dynamic trends of SOC under land use change and present several proposals in regard to how to sequester more carbon in soils after land use change.
Keywords: Land use change; Radiocarbons; Fractionation of soil organic matter; Soil carbon sequestration
Introduction
Land use change and SOC dynamics Globally, soils store more than twice the amounts of carbon present in atmospheric CO2 . SOC stock is determined by the balance of net carbon inputs to the soil (e.g. organic matter) and net carbon losses from the soil (e.g. CO2 , dissolved organic carbon, and the loss through erosion). Land use change is identified as the main driving for the balance between carbon inputs and losses in soil [1,2]. Therefore, changes in land use and land management are important causes of SOC store variation; such variation could lead to a marked climate change because altering in climate patterns is associated with atmospheric CO2 concentration [3]. Approximately 545 Gt of carbon have been released in the atmosphere by land use change and the use of fossil fuels, which resulted in an increase in the atmospheric CO2 concentration from the range of 275 ppm to 281 ppm in 1750 to 390 ppm in 2011 and 400 ppm in 2013 [4]. the coping strategies adopted at household level to bridge the gap on food deficit and (v) to assess the nutritional status of children and the elderly in Kisii County. The data used was mainly rainfall and temperature data from meteorological stations and sample data gathered from selected groups. The study population comprised of children between 6 months and 59 months, household heads, elderly people and agricultural officers. Purposive sampling was used to select agricultural officers while multistage sampling was used to select respondents at household level. Primary data was collected by use of a pre-tested questionnaire. The Measurement of Upper Arm Circumference (MUAC) tape was used to collect nutritional status of children while Body Mass Index (BMI) data was obtained from elderly people. Mann Kendall statistic was used to determine whether the trend of rainfall and temperature observed is significant while Chisquare test was used to determine whether the coping strategies observed varied significantly at household level. From the analysis, rainfall has not shown any significant change in Kisii County while temperature trend has been significantly increasing over the years at 95% confidence level. This could explain the observed reduction in river levels. Analysis of crop production and price trends of major food crops in Kisii County showed a decreasing trend of food production leading to increase in price over the years. This meant that farmers could not produce enough to take them to the next harvesting season, making farmers to adopt different coping strategies at household level which differed significantly according to Chi-Square test. Malnutrition status of both elderly people above 59 years and children between 6-59 months were similar with 23% of both children/elderly being severely malnourished. This study has only looked at climatic factors such as rainfall and temperature. Other aspects such as depth of underground water, pH level of soil and the effects of land fragmentation also need to be looked at. This study is important to both farmers in choosing the right crop to plant, and policy makers and planners in formulating the best mitigation and intervention strategies for Kisii County food insecurity problem. This will further contribute to national efforts towards achievement of vision 2030.
Keywords: Climate variability; Food security; Climate change adaptation; Malnutrition
Introduction
The Horn of Africa region has been attracting the attention of many researchers and donors as well due to the food crisis that led to famine conditions and severe food shortage in most parts of Somali, Ethiopia and eastern parts of Kenya during 2011 and 2012 boreal summer [1-6]. While many parts of the world also faced different weather challenges during 2011 and 2012; for instance, July-September Thailand floods in 2011 [7], March-August Texas USA drought [8], high temperatures over western Europe [9], February 2012 European cold spell [10] and the record winter drought of 2011–12 in the Iberian Peninsula [11] among others, the Horn of Africa situation was exacerbated mostly by non-climatic factors such as high global food prices, political instability, chronic poverty, and poor infrastructure among others. Nonetheless, climatic stresses associated with back-to-back failures in both the boreal winter and the boreal spring of 2007, 2008, 2009, 2011 and 2012 played a critical role [3].
Having recognized that climate variability and change is a major driving factor in most economic activities in the region, most governments such as the Kenyan government [12] integrates climate information in her policies. Climate change is quite noticeable, and it is intensifying at an alarming rate in terms of temperature increase and rainfall irregularity in Kenya [13]. For instance, [14] analyzing precipitation and temperature over the Greater Horn of Africa during the 20th and 21st century based on a sample of Coupled Model Intercomparison Project version 3 (CMIP3) models output found that the equatorial eastern Africa region (including the entire Greater Horn of Africa (GHA)) have been experiencing a significant increase in temperature beginning in the early 1980s, in both A1B and A2 scenarios. They further showed that minimum temperatures were projected to increase by more than 2°C above the Long-Term Mean (LTM) by the mid of the 21st century. This was further corroborated by Otieno and Anyah [15] who showed that temperatures were projected to increase at a rate of 0.3/0.40 C/decade under RCP4.5/8.5 scenarios in both equatorial GHA region leading to an approximate temperature increase of 2/2.50 C by the middle of twenty first century. Apart from the weather effect, food insecurity and famine can be caused by a number of factors such as low harvest, post-harvest losses, under nutrition [16,17], increase in food prices and population increase. While global population is set to grow to approximately 9 billion people by 2050 from the present 7 billion, which would require increased volume of food production, it is estimated that by 2080 the agricultural output in developing countries would decrease by 20% due to climate change [16,18]. In Africa; for instance, about 250 million people are likely to face food insecurity due to crop failure, loss of livestock and lack of water as result of climate change by 2020. It is also estimated that by 2040 drought is likely to reduce the area under cultivation of maize, millet or sorghum by 40-80% in sub-Saharan Africa [19,20].In Kenya more than 500,000 farmers of tea have experienced erratic rainfall, greater frost and high temperatures that have threatened their livelihood [21,22], forcing most of them to device ways of coping with the shortages. In Bungoma County; for example, residents have devised many ways of reducing the impact of food insecurity by reducing the number of meals taken per day, working for cash or food, borrowing money to buy food, sell assets and some resorted to borrowing from sellers which makes them poorer [23]. Post-harvest food losses, the measurable quantitative and qualitative food loss in the post-harvest system [24], have also been a major factor contributing to the net harvest. Controlling post-harvest food loss is a key component in ensuring food security. Losses in post-harvest stage can occur due to various factors such as storage, handling, pests and weather conditions. In sub-Saharan Africa post-harvest losses are approximately at 40% of the total harvested cereals [24]. Once crops have been harvested, the unusual rains can dampen the crop yields and result in mould growth, a common phenomenon in developing countries due to reliance on weather (sun) for drying farm produce. If unfavorable weather conditions prevent the crops from drying, the post-harvest losses become high and at times mycotoxin producing moulds such as Aspersillus flavus may produce aflatoxin which can lead to health-related problems if consumed [25]. Nonetheless, in Kenya post-harvest loss is approximated to be at 50% mainly due to weather impact [24].
The aim of this study is to test the capacity of a novel technique for solar pasteurisation in order to assess its suitability for safely processing water for drinking purposes in developing countries. The device is to be used in environments where it is critical to pasteurise the water by reaching sufficient temperatures. Depending on what temperatures are reached and for how long, this would then provide safe drinking water [6]. In addition, conclusive results will allow for the pasteurisation device to be combined with a Passive Solar- Thermal Pumping system, currently being developed at University College London (UCL). This low-cost technology can be used for purifying drinking water, cooking or alternatively as a fuel-saving device, used to heat up water as an alternative to mainstream expensive, unreliable and unsustainable options. the cause of food insecurity in the County. For instance, Kumba and Francis [26] analyzed the influence of agricultural land use on household food security situation in Kisii central. From their study, natural grass or napier grass had a significant influence on household food security while crops and fruits were not [27] looking at the effect of land fragmentation index, quantity of planting fertilizer and the type of seed used found out that all these factors influence technical efficiency in food production [28]. Also, looking at the implication of land use/cover changes on food production and insecurity in Kisii County found out that the reduction of forest land due to rising demand for more agricultural land and settlement had impacted negatively on soil fertility leading to a decline in food production. While these studies have looked at the aspect of land use/cover change and type of agricultural land use, they didn’t consider the aspects of climate and its effects on food insecurity in Kisii County. Characterizing precipitation and temperature and further assessment of climate variability/change is a fundamental step in providing a baseline for understanding the effects of climate variables on food insecurity in Kenya, especially in Kisii County. This will be important for future climate change impact
assessment and for the management of food situation in Kisii County. The County with a population density ranging from 759 -1009 per square kilometer (Figure 1) and being one of the bread basket regions in Kenya is of utmost interest. Hence in this interrogates (i) the trend of precipitation and temperature in Kisii County for the past 30 yrs, (ii) the effect of the changes in temperature and precipitation on food production in Kisii County, (iii) The perception of farmers on climate and weather information (iv) coping strategies adopted at different household level in Kisii County and (v) nutritional status of the elderly above 59 years and children between 6 to 59 months. In the next section the different data types used and their acquisition method and a discussion of the overall methodological approach is outlined. Section 3 provides a discussion of the overall results. A summary of the overall findings and the main conclusions drawn from the study are provided in section 4.
Data and Methodology
Data
Data used in this study were categorized into two; secondary and primary data. Secondary data which consisted of rainfall and temperature data for the past 30 years (1983-2013) was obtained from Kenya meteorological stations in Kisii County and agricultural production details were obtained from sub-county agricultural offices of Marani and Bomachoge chache. Primary data consisting of Body Mass Index (BMI), nutritional status and trend in river levels were collected through pretested questionnaires. The study population consisted of household heads, children between 6-59 months, Adults over 60 years, County and sub-county agricultural officers involved in food production in Kisii County. The children below 60 months and adults over 60 years were chosen since they are more likely to suffer malnutrition [29].
Sample size and sampling technique: A Purposive sampling
Short Communication
Pages: 1 - 3Emmanuel Oppong Peprah
There has always been a cordial relationship between human beings and nature. Whereas humans’ treat nature with respect and approached the earth with responsible behavior, the earth reciprocated the gesture with the abundant provision of all human needs. However, this relationship has been marred mainly because of human activities. The level of irresponsibility in terms of pollutants and blatant disregard for common precautionary measures in the handling of the gifts nature has given human beings has led to a host of catastrophes the inhabitants of the earth must endure. Although there has been several campaigns and advocacies all over the world to guide human behavior to stop polluting the environment, these pleas seem to have fallen on deaf ears. Hence the time has come to implement some radical educational campaigns to guide people to respond responsibly to end or lessen the degradation of the earth. This paper by the use of the Cognitive Evaluation Theory proposes that wrongdoing should be extrinsically awarded with the plan to gradually take away the award remuneration which will lead to the removal of former intrinsic motivation to do the wrong things and eventually win the war on man-made pollution of this planet.
Keywords: Environment; Reward; Intrinsic; Extrinsic; Motivation
Introduction
The relationship between humans and nature
Humans have depended on nature for all their needs. Therefore there had been a deep connection between humans and nature since human existence. In contemporary times however, due to industrial influence and other human activities, this connection between human and nature has been weakened [1]. It therefore could rightly be deduced that early human beings were a part of nature. No one would reject the fact that humans have been completely dependent on nature throughout the history of this planet. Humans actually have a fundamental physical, emotional, and intellectual dependence on nature [2]. Hence the relationship between humans and nature in the beginning was very good.
It can be said that human beings have a deep connection to nature, and although this connection has been weakened by humans’ gradual dependence on industry, humans’ physical and psychological essential needs from nature persist. Nature has been the source of psychological well-being and physical health for human beings from the beginning of their existence. Humans also depend on the natural environment for their basic needs such as food, shelter, and clothing. Some researchers believe that there is a state of human self, which will only be awakened through humans’ connection to the natural environment. Hence the natural setting in our planet have a unique effect on human beings.
Subsequently, the aim of this study is to propose a radical solution that will help to bridge the gap that has been created between humans and nature. Hence this paper’s applied methodology is basically to find and suggest a suitable solution which if implemented, will change the bad and pollution-causing attitude of people. Research in this area of study have primarily being fundamental and thereby explore components of pollution, the effects of pollution to the environment and predictions of the environment in future if pollution of any kind is not halted. This paper is therefore different in the sense of moving a step further to propose a feasible solution to curb any form of pollution. This paper by exploring the Cognitive Evaluation theory will arrive at its suggested solution to explain how extrinsic motivation (easier to control) can take away intrinsic motivation (difficult to control) to pollute ones surroundings. Consequently, this study contributes to literature by demonstrating how theories from other discipline can be used to find solution to problems in other disciplines: this paper uses a theory in psychology to solve a problem in environmental science.
Human and nature on separate path
The relationship between human beings and nature became sourer mainly after the industrial revolution. After the industrial revolution, everything surrounding human beings started to become humanmade; buildings, railways, roads, cars, and others. This phenomenon made humans veer off the road to nature completely. Basically postmodernity is gradually alienating the natural environment from human dwellings [3]. The relationship of man and the environment is bi-directional. That is, human beings are affected by the environment and they also affect the environment. Therefore human activities affect the distribution, quantity, and chemical quality of a lot of natural resources.
Pollution of the environment is a major challenge being faced by every country. Hence natural resources are depleting rapidly, which will surely create scarcity problem for the next generation. Also, environmental problems are becoming complicated due to excessive use of resources as every country is trying to increase economic growth to improve the living standard of its people. Today, developed countries are using excessive resources to produce surplus goods for exports while poor countries are exploiting their existing resources to feed their growing population and end poverty level. This race of resources exploitation is creating a dangerous situation all over the world and has made the lives of people and animals vulnerable.
Biophysical research has established that since the end of the 18th century, especially since 1950, terrestrial and marine ecosystems have suffered profound transformations. Atmospheric changes have been thoroughly documented as well. The conversion of practically unaltered ecosystems and the use of new production technologies account for most of the transformation observed in terrestrial ecosystems. In marine environments, excessive fishing is pointed out as a direct driver of recent transformation, while freshwater ecosystems have been profoundly affected by changing water regimes and pollution. Nitrogen and phosphorus application directly related to human activities have generated clear environmental imbalances. In addition, the ongoing climate change has been decisively linked to greenhouse gas emissions.
Effects of Inappropriate Human Activities on the
Environment and Adverse Consequences
Due to human activities, there has been a tremendous change in the natural seasons as well as the ecosystems, pushing all natural order and occurrences to the extremes. These natural changes are having direct adverse effect on human beings in various forms in terms of psychological, environmental and even health wise. For example, it has been observed that people are becoming more irritable and aggressive during hot and sunny weather seasons due to the sun ’s direct ultraviolet radiation rays which are not being absorbed anymore due to their wiping out as a result of human activities. This phenomenon by extension is what is causing the increase in “road rage” cases during the summer months.
Efforts to restore the broken relationship between humans and the planet
Since the discovery of man’s activities that lead to the degradation of this planet, leading to the horrible consequences being faced now, several conferences as well as organizations have been working around the clock to come out with solutions to sever this situation. The first worldwide meeting of heads of state in response to the concerns for the environment took place at the Earth Summit, formally known as the United Nations Conference on Environment and Development (UNCED) in Rio de Janeiro in 1992. This conference reflected worldwide concern about the quality of our environment. International Environment Education Programme is the outcome of the 1992 conference and since then efforts are being made globally to educate people at all levels of society about the environmental concerns and consequences of our actions. The environment in which we live and work affects our thoughts, feelings, and behaviours.
The Proper Things to be done
Nature has gifted humans on this planet with abundant resource which must be used judiciously. Humans have to learn to judiciously use and conserve all the gifts that nature has given them such as air, water, food, fuel, etc. Disposal of waste materials produced, ranging from poisonous and harmful sewage to garbage, need special attention. People must be ready and able to conserve water by harvesting rain water for instance to augment water supply. Also, the quality of air has been adversely affected by automobile and industrial emission. Large quantities of emissions from such sources have increased the presence of harmful and toxic gases in the breathable air like carbon monoxide, nitrogen dioxide, and Sulphur dioxide. Therefore innovative directions such as the usage of electric vehicles should be encouraged to clear the air of toxic substances as well as destroying helpful elements in the atmosphere. On waste disposal, wise and innovative ways should be encouraged and devised instead of flushing them into water bodies untreated.
Proposal to Addressing Issue
The backing theory: Cognitive evaluation theory
This theory proposes that the introduction of extrinsic rewards for work that was previously intrinsically rewarding tends to decrease overall motivation. Cognitive evaluation theory explains the effects of extrinsic motivators on intrinsic motivation. Intrinsic motivation involves people doing an activity because they find it interesting and derive spontaneous satisfaction from the activity itself. Extrinsic motivation, in contrast, requires an instrumentality between the activity and some separable consequences such as tangible or verbal rewards, so satisfaction comes not from the activity itself but rather from the extrinsic consequences to which the activity leads. Deci and Ryan’s Cognitive Evaluation Theory (CET) specifically addresses the social and environmental factors that facilitate versus undermine intrinsic motivation and point to three significant psychological needs that must be present in the individual in order to foster self-motivation. These needs are competence, autonomy, and relatedness. According to [4], a sense of competence comes from success experiences and overall positive feelings about an activity. Human beings by nature are driven by a need for competence. Humans experiment with and manipulate objects around them, and the joy they feel when they figure it all out is demonstrative of intrinsic satisfaction. Humans also constantly test their knowledge by embracing concepts they have already mastered with new stimuli, creating personal challenges for themselves [4,5]. A sense of competence and the ability to take on optimal challenges all foster the development of intrinsic motivation [6]. Conversely, any negative intrusion toward this process, whether it be in the form of criticism or control, may undermine feelings of intrinsic motivation. Autonomy on the other hand dictates that in order for intrinsic motivation to flourish, a sense of competence must also be accompanied by a sense of autonomy [4]. When an individual is given a sense of choice, or an opportunity for self-direction, feelings of intrinsic satisfaction are enhanced. However, when a reward is offered as an incentive, learning and autonomy decrease, as do feelings of selfmotivation [6,7]. This simply depict that human behavior can be controlled with the right motivation psychologically. In spite of the support autonomy gives, relatedness goes hand in hand with autonomy, as both influence cognitive and affective outcomes [8]. A number of studies have confirmed that teachers or superiors who are more involved with their students or those they are directing are highly motivated and self-directed [9-11]. This notion invariably signifies the importance of policy makers’ involvement in programs which are geared towards influencing people to behave in a certain way.
Backing story: Proving how CET can work
China. He loved to take naps in the afternoon. However, these naps became impossible because some of the village kids decided to move their football playing field to the old man’s piece of land directly in front of his house. The constant noise coming off their feet and hitting the wall as well as the shouts for unfair tackling and the shout for goal, kept the old man up from enjoying his nap. He will therefore come out and drive the kids away. But as soon as he went back to his room, the kids will be back again and the cycle continues. He even changed his demeanour from speaking nicely to rebuking the kids but the kids kept on coming and even increased their number. Hence the more he shouted, the tougher the kids became to resisting him.
Then he thought of a plan and decided to change his tactics. The next day, as usual, the kids came to their ‘field’ in front of the old man’s house just when it was about to hit noon and starting playing their football, intentionally even raising their voices the more to probably anger the old man the more. Surprising to them, the old man came out with a smile on his face, took a seat by his door and watched them play, occasionally cheering the goal scorers. When the kids were done playing their strength out, he gathered them, gave them candies and gave them money (2RMB) each, and promised to always give them money whenever they come to play. The kids as expected kept on coming day after day and took their cash reward. Then one afternoon, instead of 2RMB, they were given 1.50RMB. The old man explained to them that he did not have enough money to afford 2RMB each this time around. The kids murmured, but took the money. When they were given the same 1.50RMB the next day, the enthusiasm they came to play with went down. After their workout, the old man reduced the monies to 1RMB and explained to them he did not have enough to afford 1.50RMB each. They grudgingly took their monies and went home.
The next day the old man realized one of the kids did not show up to play football, apparently because he was angry the old man has reduced their ‘allowance’. The old man after that day too further reduced their cash reward to 0.80RMB. The kids snapped the coins from the old man’s hand without even expressing their appreciation. As expected the number reduced the next day. Their monies after the next day was again reduced to 0.50RMB at which point some of them left out of anger without even taking the money and assuring the old man they will not come back until their original amount has been restored. Eventually when their monies were reduced to 0.10RMB, they all stopped coming.
The point of background theory and story
There has been numerous campaigns of how some human activity and bad behavior is destroying this planet, all over the world by various governments and concern groups, spending millions of dollars on such pleas and programs. However, these campaign pleas seem to have fallen on deaf ears. This could partly be because of our greed, lack of knowledge, dishonesty, not caring for others and the like, which will lead people to engage in all sort of unethical and illegal conducts. It is a firm belief of the researcher of this paper as demonstrated, that introducing extrinsic motivators to motivate people into doing the wrong things that is plaguing our planet and taking the extrinsic motivators away gradually will also take away the intrinsic motivation people have.
Conclusion
Throughout human history, people have been threatened by floods, earthquakes, and other natural disasters. In spite of enormous scientific development, humans on this planet have not been able to control the effect of natural calamities and have not been able to control natural disasters either. In modern times, technological innovations and advances have brought about new potential manmade threats on the environment. Such man-made activities in the form of pollutants and others threatening the environment are numerous. Although lots of efforts are been made by world and country leaders to dissuade people from engaging in irresponsible behaviors which are harmful to nature, it seems not to be working. Hence the use of Cognitive Evaluation Theory to propose new radical educational contents to address this issue. Within the framework of Cognitive Evaluation Theory (CET), rewards carry the most risk of undermining intrinsic motivation. When an individual is given a reward for something they may have done anyway, that reward can have detrimental effects on the quality and creativity associated with the individual’s performance, and on the individual’s subsequent motivation to perform the activity once the extrinsic reward has been received. Rewards that are deemed controlling can undermine intrinsic motivation. Bottom line is, extrinsically rewarding people (example cash price) for doing the wrong thing and gradually taking away the reward, will take away the intrinsic motivation to do the wrong thing.
Review Article
Pages: 1 - 11Samwel K Olekao
Understanding the way the Maasai pastoralists' Traditional Ecological Knowledge (TEK) affects management of natural resources in dry lands is of practical importance, failure to recognize its contribution in resources management and use can result into mismatch of varied land uses leading to loss of biodiversity and deterioration of livelihood conditions. The study was done in Kiteto district (Maasai Steppe), data was collected using Participatory Rural Appraisal (PRA), Focus Group Discussions and key informants interviews. Statistical Package for Social Sciences (SPSS) was used to analyze quantitative data, PRA data was analyzed by the help of communities and content analysis was used to analyze qualitative data. Findings show that socio-economic factors; sex, age, education level, income from livestock, household size and time spent in keeping livestock influenced the perceived usefulness of TEK. Practices such as herd splitting, grazing patterns, livestock mobility, co-existence of wildlife and livestock, water sources management and construction of settlement played role in management. TEK thus, enables pastoralists to control and manage rangeland resources by regulating access to users and sanctioning abusers. Using medicinal plants to treat some diseases and ailments instead of conventional medication could be due to high costs or availability of drugs and proximity to health centers. Government and actors should work on policies that undermine pastoral ways of life and range ecologists should design a TEK model to be used in dry lands ecosystems management.
Keywords
Ecological knowledge; Dry land ecosystems; Maasai pastoralists; Kiteto; Tanzania
Introduction
Understanding the way the Maasai Pastoralists' Traditional Ecological Knowledge affects (positively or negatively) the management of natural resources in the dry lands is of practical importance for maintaining ecosystem function and resource availability. Failure to recognize the contribution of this traditional knowledge in resources management and use to enhance biodiversity and the livelihood of people can result into a mismatch of varied land uses that may lead to loss of biodiversity and deterioration of people’s livelihood conditions. The TEK as a system of understanding the environment based on observations and experience built over generations because of people being dependent on the land for their food materials [1] is one of the central contributions of indigenous people to conservation. Hesse et al. [2] stipulated that, pastoralists are highly specialized livestock herders and breeders and have skills and indigenous knowledge of direct national value. They rely on scarce natural resources under shifting conditions, demanding considerable knowledge of animal husbandry, sustainable rangeland management and informal livestock markets. Traditional knowledge is described by Pierotti et al. [3] as the knowledge, innovations and practices of indigenous and local communities around the world developed from past experiences gained over centuries and adapted to local culture and environment.
Traditional knowledge is transmitted orally from generation to generation and is collectively owned by members of a particular indigenous community taking the form of stories, songs, folklore, proverbs, cultural values, beliefs, rituals, community laws, local language, crop and animal husbandry practices including development of plant species and animal breeds (Ibid). According to Whyte [4], the concept of TEK is better explored in terms of the role it plays in facilitating or discouraging cross-cultural and cross-situational collaboration among actors working for indigenous and non-indigenous institutions of environmental governance, such as tribal natural resources departments, federal agencies working with tribes, and co-management boards.
Local people have a very good understanding of ecological zones representing a system of interactions among plants, animals, soils and the people themselves [5]. Also, Searle [6] reported that species preferred by villagers for forestation are those wood species which are indigenous to the area out of which some species are scientifically identified but other species may have vernacular names. According to Niamir [7], local people can identify more species and varieties of plants than well qualified botanists, probably due to the fact that they have had more time to search and find all the plants in their area. This cuts across most societies whose livelihood is dependent upon the natural resource base for survival; the pastoralists fall in this category. Pastoralism is analyzed as a way of life depending primarily on livestock keeping or an extensive system of livestock production that involves different degrees of movements (mobility), and where families depend on livestock and their by-products for a substantial level of their subsistence and income by over 50 per cent [8,9]. Pastoralism is defined as a mode of production which depends on natural forage and pastoralists are found in many parts of the African continent from North to South and from West to East and mostly live in arid or semi-arid lands [10]. There is undeniable fact that pastoralists have been involved in farmer-herder conflicts in Tanzania and elsewhere in Africa. Of recent, clashes between the parties in Kilosa, Kiteto, Kilindi, Kilombero and Bagamoyo are an example of escalation of resource use conflicts in the country. Eviction of pastoralists in some parts of the country to pave way for agriculture expansion, state-backed investment and conservation such as in Ihefu, Mbarali and Loliondo are the signs of demise of pastoralism and that can lead to further conflicts between the two. Mwamfupe [11] argued that pastoralists have lost considerable amount of their land due to lack of security of tenure. Despite the role played by pastoralists in management of rangelands, the modern science of range management has often neglected pastoralists’ participation, largely due to the perception of official resource managers that herder knowledge lacks objectivity [12]. Furthermore, though the Maasai pastoralists have a longtime experience on the use of dry land ecosystems, the management of the rangelands is expert-based and part played by traditional knowledge is not given proper attention for sustainability. The study thus aimed to describe well the role played by this ecological knowledge of the Maasai in management of dry lands and to argue on a highly charged criticism from ecologists that all pastoral systems contributed greatly to destruction of environments. Research findings will help to inform policy makers at different levels on potential role of pastoralists' TEK on dry lands conservation, management and improvement of land use planning process in Kiteto and elsewhere in the country. Findings will thus serve as input when preparing strategies to address challenges of dry land ecosystem management. Also, the findings will help to bridge the gap between scientific conservation methods and indigenous conservation practices of Maasai Pastoralists.
Methodology
Study area description
Kiteto District, one of the five administrative districts of Manyara Region in Northern Tanzania, lies between 6°7'16"S, and 36°37'30"E shown in Figure 1. Although there are remarkable variations in the amount of precipitation, the district receives an average of 350 mm to 700 mm of rainfall annually and there is one rainfall season (Uni-modal) between the months of January and May. The dry months are August, September, October and November and it is considered to be semi-arid to arid.
Journal of Pollution received 64 citations as per Google Scholar report
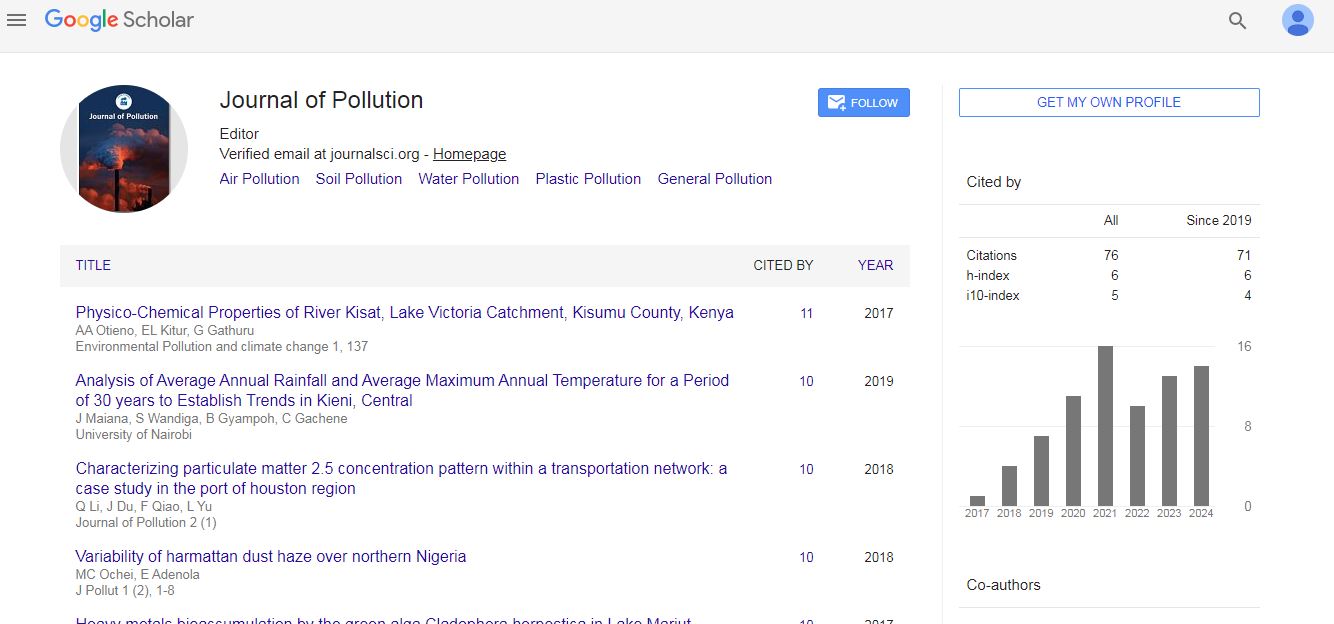
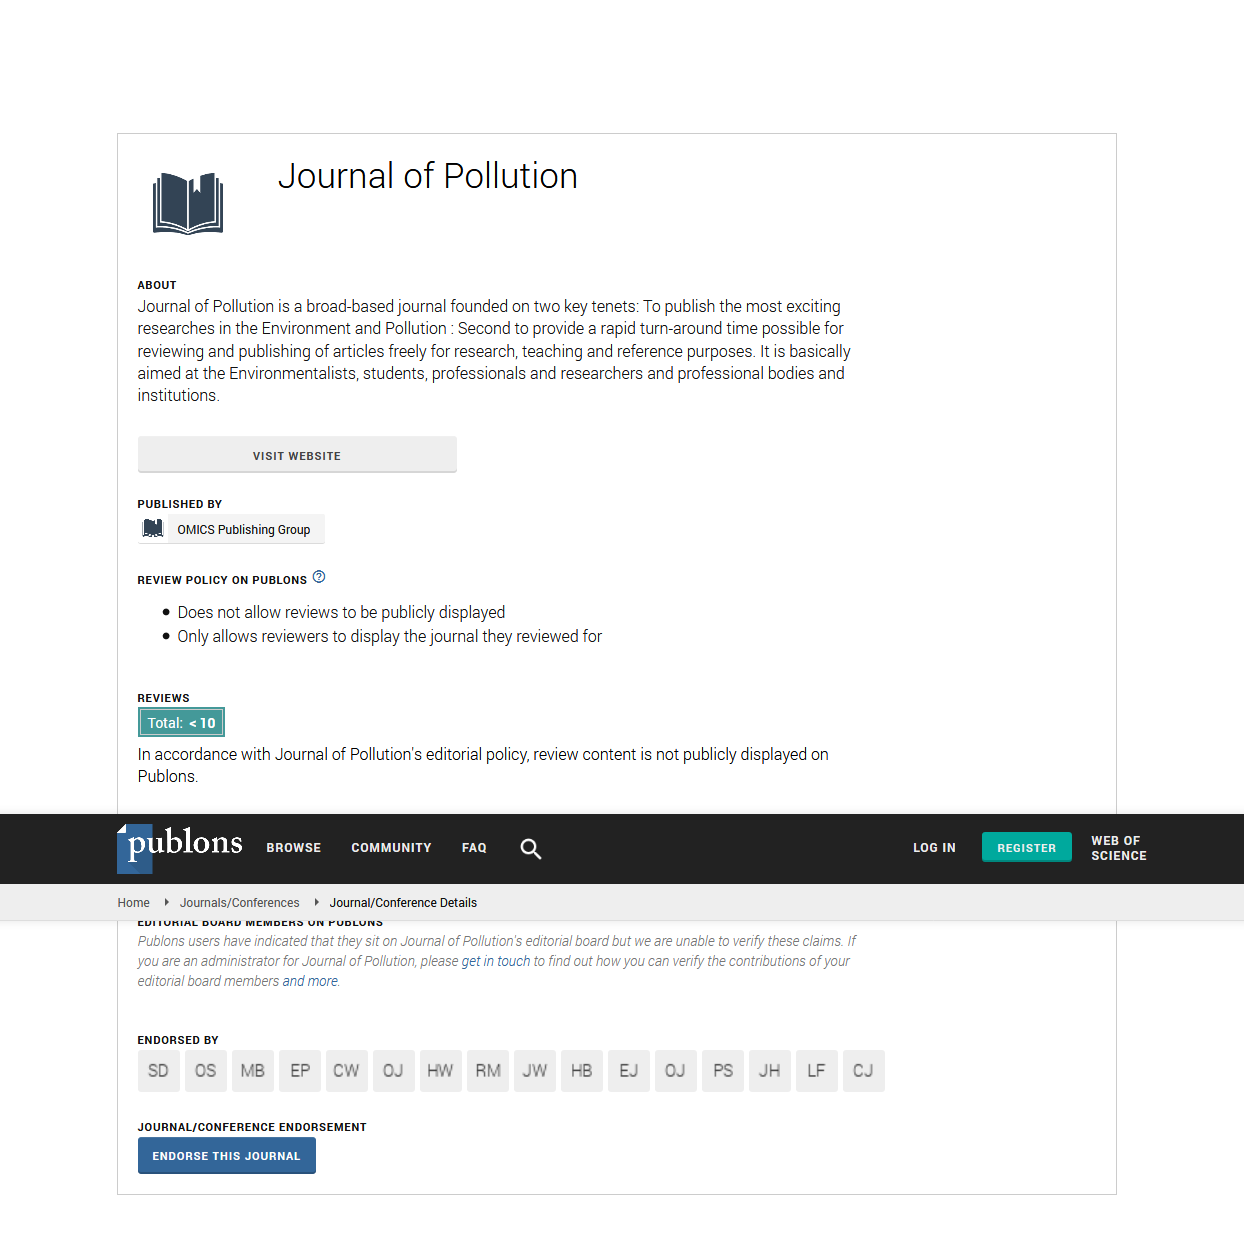
 Spanish
  Chinese
  Russian
  German
  French
  Japanese
  Portuguese
  Hindi
Hindi 