Jedidah Maina
Keywords: Average annual rainfall; Average maximum temperature; Trends; Climatological standard normal; Datasets; Climate change
Introduction
Establishment of rainfall and temperature trends of the agricultural area is important especially to the communities living in the area since they can be able to adapt by changing their farming practices and hence increasing their livelihoods from increased resilience in the face of climate change. The Intergovernmental Panel on Climate Change (IPCC) reported that most countries will experience increased average temperatures, more stressed water resources and unreliable precipitation [1,2].
Susceptibility of a country to climate change on the different sectors is related to the state of development, as indicated by the different impacts of climate change on the different sectors of a country’s economy [3,4]. Agriculture is one of the key economic sectors that are highly venerable to the impacts of climate change [5]. The agricultural sector contributes approximately 32.6% of the country’s GDP and employs more than 40% of the total population and more than 70% of the rural population in Kenya [6]. This means any major negative effect of climate change on agriculture would have serious consequences for the rural economy and the national economy as a whole.
Central Kenya, one of the country’s food baskets has been experiencing significant changes in temperature and precipitation trends. Recent research in Nyeri County demonstrates that rainfall received has been decreasing every 3 to 4 years [7]. Since the 1960s, the region’s minimum and maximum temperatures have been in the magnitude of 0.8-2.0 and 0.1-0.7°C respectively [8]. According to the Kenya Economic Survey Report Highlight, growth in Kenya’s agricultural sector fell from 4.2% in 2012 to 2.9% in 2013 and this was attributed to inadequate rainfall received in some grain-growing areas. In Kieni, constituency, Nderitu et al., reported declining long rains that fall from March to May between 1985-2015.
The research sought to collect and analyse average annual rainfall and average maximum annual temperature data for a period of 30 years to establish the trends which would then show the presence or the absence of climate change in the area. This would be benefiting the community since the presence of climate change brings about ways of adapting their farming practices to increase livelihoods and become more resilient.
Materials and Methods
Study area
The area of study is located in the greater Nyeri country. From the 2009 Kenya Housing and Population Census [9,10], Kieni had a population of 175,812 and covers an area of 1,378.10 Sq. Km. The amount of rainfall received in the area is affected by Mt. Kenya which is >4,000 m above sea level to the east and Aberdare Ranges to the west which is >3,000 m above sea level. The lowest area (1830m above sea level) receives about 850 mm of rainfall per year and rises to 2300 mm near the slopes of Mt Kenya to 3100 mm in the Aberdare area. Kieni East District where the study was carried out receives annual precipitation of 500 mm and is therefore classified as a semi-arid region. These Arid and semi-arid lands where Kienisub-county falls under are characterized generally by hot and dry climate, low and erratic rainfall that varies widely across space and time. The region experiences a bimodal pattern of rainfall with long rains falling around March/April and short rains falling in October/November.
Analytical methods
Rainfall trends: To establish rainfall trends in the study area, the annual monthly and the total annual average rainfall were computed for the years 1984-2013 using excel spreadsheets. The annual monthly average rainfall moving averages were computed and thereafter graphs drawn to show the overall trend over the 30-year period. According to the World Meteorological Organisation, in the absence of a climatological standard normal, a provisional normal can be computed from at least 10-12 years of the prior observations taken before the period under review. In this case, average rainfall records used were from Nanyuki meteorological station which had observations from 1959 therefore the normal was computed for a 25-year period from 1959 to 1983 and was used as the baseline [11]. The computed normal was subtracted from 1984-2013 the total annual monthly average, as well as the average rainfall computed each month within the period to obtain the annual and monthly anomalies and graphs, are drawn of the same were drawn.
Temperature trends: Temperature data available from Nanyuki meteorological station was from 1997 to 2014 with many gaps in between. For this reason, it was decided to analyse the data from the Nyeri meteorological station which was available from 1976 therefore the data under review was for the 1981-2012 period. The same procedure as the rainfall data of determining the annual average and the monthly average maximum temperature for the period under review was followed. However, due to the lack of enough data, the provisional normal was computed from 1976 to 1985 a 10-year period. The annual monthly maximum temperature was plotted against the years between 1981 and 2012 to obtain the average maximum temperature trends within the period. The graphs were also plotted of the annual anomalies as well as the average monthly anomalies.
Results and Discussion
Average annual rainfall trend analysis Rainfall data records were analysed for 1984-2013, a 30-year period. The annual total and average rainfall were calculated for each year and the average rainfall plotted against its corresponding year as shown in Figure 1 below. The average annual rainfall for the 30-year period was 646.4 mm while the total monthly average was 53.9 mm per month. The highest total annual average was 967.8mm in 1997 followed by 925.3 mm in 1988 and coming third with 924.7mm in 1998. Within the 30-year period the lowest average annual rainfall was in 2000 when only 287.1mm of rainfall fell, 1984 with 318.7 mm and 1993 with 370.0 mm.
Share this article
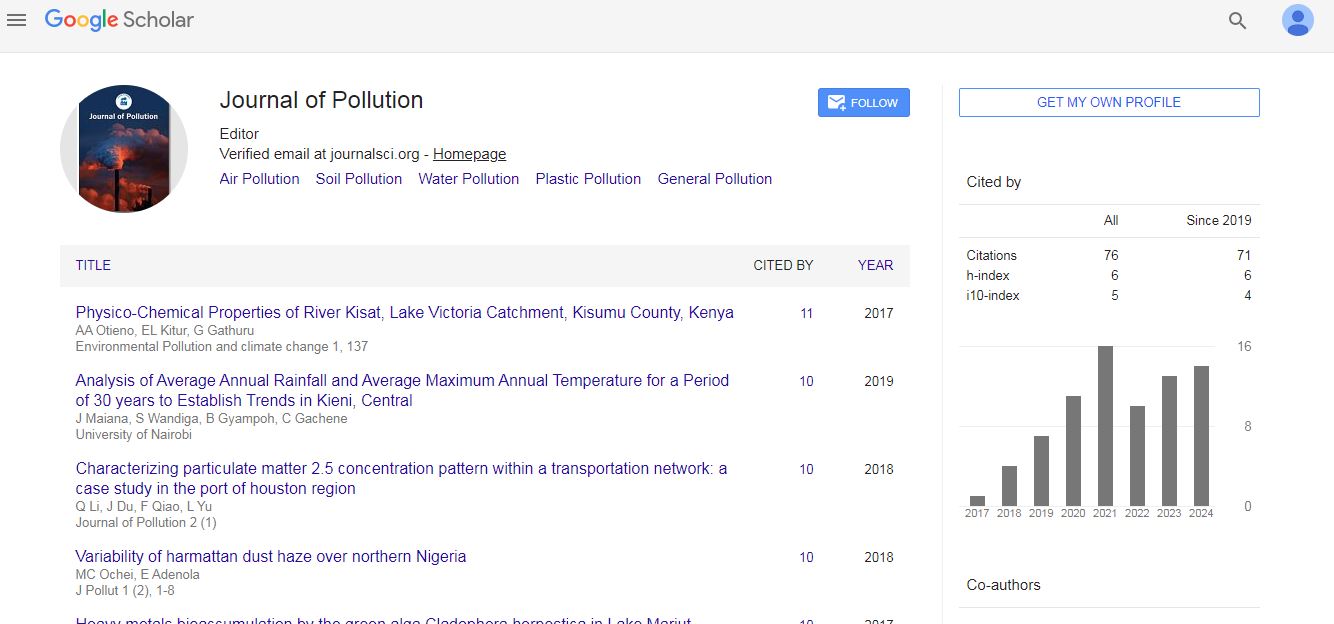
Journal of Pollution received 64 citations as per Google Scholar report