Research Article - (2023) Volume 12, Issue 2
Received: 02-Dec-2019, Manuscript No. JME-23-5178;
Editor assigned: 05-Dec-2019, Pre QC No. P-5178;
Reviewed: 19-Dec-2019, QC No. Q-5178;
Revised: 30-Jun-2023, Manuscript No. R-5178;
Published:
28-Jul-2023
, DOI: 10.37421/jme.2023.12.630
, QI Number: JME-23-5178
Citation: Mousavi, Rouhollah, ME Bahrololooma and F
De lorianc. "The Effect of Electrodeposition Parameters on the Parabolic
Behaviour of Composite Coating Properties." J Material Sci Eng 12 (2023):
630.
Copyright: © 2023 Mousavi R, et al. This is an open-access article distributed under the terms of the creative commons attribution license which permits unrestricted
use, distribution and reproduction in any medium, provided the original author and source are credited.
Ni-Mo/Al composite coatings were obtained by electrodeposition from a Ni-Mo plating bath containing suspended Al particles. The factors including temperature, current density, and stirring rate affecting coating composition, wear, roughness and morphology have been studied. It was found that properties like as hardness, roughness, wear and the deposited Al particle content of coatings show parabolic behavior by changing each parameter. It means that there is a critical value for mentioned parameters in which properties of coatings become maximum.
Ni-Mo/Al • Composite coating • Parabolic behavior • Chemical composition • Morphology • Electrodeposition parameter
Composite electrodeposition consists of the electrolysis of plating solutions in which micron- or submicron-sized particles are suspended; variable amounts of these particles are transported by faradic and electrophoretic mechanisms to the cathode to become embedded in the composite electrodeposit [1].
In the field of electrochemistry, single-step-production of completely dense materials without extraneous porosity and significant capability of reproduction have been considered as outstanding characteristics [2]. Electrodeposition is a simple, low cost and low-temperature process for the preparation of coatings [3]. The structure and chemical composition of composite coatings are not only affected by the concentration, size, distribution and nature of the reinforcing particles, but are also powerfully affected by the operating features of electrodeposition like current density, stirring rate, temperature and amount of particles in the solution [4]. By changing each parameter, it is possible to obtain a coating with different properties.
There are many reports that show that the amount of particles in the deposit reaches a maximum, beyond which, the level decreases at higher temperature. Many researchers demonstrated that deposited particle content is increased up to a maximum and then decreases with increasing current density. Among all the parameters, bath agitation during electrodeposition of composite coating is particularly important. During electrodeposition, bath agitation helps to maintain the particles suspended in the electrolyte and transport the particles to the cathode surface by convective-diffusion. It seems that the incorporation of particles in the coating becomes high if the stirring rate is sufficiently high [5]. As seen in the literature, the amount of deposited particles is increased up to a maximum value and then decreased by increasing the stirring rate regardless of the values of the current density and the temperature. Consequently, an operational parameter describing the electroplating bath composition or process conditions can have a positive or negative effect on the particle content of the deposited composite coating. As mentioned above, there is a critical value for each parameter, beyond which the effect of each parameter on the included particle content of the deposit becomes opposite. Ni-Mo/Al composite coating was previously electrodeposited and the effect of amount of Al particles in the bath solution was investigated. The results were published. In this work, the effect of mentioned operating parameters, except of the amount of Al particles, on some properties of Ni-Mo/Al composite coating was investigated [6].
Solutions were prepared from analytical grade purity chemicals dissolved in distilled water. The composition of the main bath and operating parameters have been presented in Table 1. The pH of solutions was adjusted at 4 by addition of NaOH or H2SO4 [7].
| Parameter | Levels |
|---|---|
| Trisodium citrate (M) | 0.15, 0.3 |
| Temperature (°C) | 25, 40, 50, 60 |
| Nickel sulphate (M) | 0.5 |
| Sodium molybdate (M) | 0.01 |
| Al content (g/l) | 1, 5, 10, 25 |
| CTAB (g/l) | 0.3 |
| SDS (g/l) | 0.5 |
| Stirring rate (rpm) | 500 |
| pH | 4 |
Table 1. Chemical and operating parameters and their values.
A pure nickel plate was used as the anode and a Q‐panel of carbon steel (SAE 1008/1010; 0.13 max C, 0.25-0.60 Mn) with an area of 1 cm2 was used as a substrate or working electrode. All surfaces of the substrate except one surface were covered with a non-conducting epoxy resin. The distance between the anode and cathode was kept constant [8].
Before each deposition, emery paper up to 1200 grade was used to polish the working electrode. The substrate after being mechanically polished, was electropolished in 95 vol% acetic acid+5 vol% perchloric acid for 3 minutes. At last, before electrodeposition, the substrate surface was activated in dilute sulfuric acid for 20 seconds. In the process between each step, distilled water was used to wash the specimens. Electrodeposition was done in a 250 ml glass beaker with parallel electrodes which was horizontally placed inside the electrolyte (the cathode was placed under the anode). Before doing each trial, a few amount of the electrolyte and the sufficient quantity of the surfactant were added to the particles to form a paste, then the volume of the electrolyte was increased up to the required volume and ultrasonically stirred for 70 minutes for homogenizing before deposition. During deposition, the particles were kept at suspension by continuous stirring of the solution with a magnetic stirring bar at the bottom of the beaker [9].
The morphology of coatings was examined by a Scanning Electron Microscope (SEM) and the elemental composition of the coatings was identified using Energy Dispersive Spectroscopy (EDS). X-Ray Diffraction (XRD) patterns were obtained using X-ray Cukα radiation (λ=1.5406 Å) [10].
The Vickers Hardness (HV) of deposited coatings was measured by means of the vickers microhardness technique under a load of 50 gf for 15 sec. Values stated in this study are averages from at least 3 different indentations scattered over the sample. The vickers diamond pyramid indenter is in the shape of a squared pyramid with an angle of 136° between faces. To estimate the hardness number of vickers diamond pyramid, both diagonals of the indentation were calculated and the mean of these values along with the load was considered to identify the amount of HV [11].
The wear tests for determination of the wear resistance of coatings were performed using a Pin-On-Disc machine (POD) under unlubricated conditions. All the wear tests were carried out at room temperature in air with a chromium coated steel pin of 6 mm diameter having a hemispherical tip [12]. The pin and the coated sample were weighed with an accuracy of 0.1 mg before each wear test. After that, they were fixed to their proper places in the wear testing machine so that the pin was vertically above the horizontal sample touching its surface. Samples coated under different conditions were rotated for 9554 revolutions which give a sliding distance of 180 m for the wear track of 6 mm diameter. The sliding velocity of the machine was kept at 0.03 m/s in all the experimental runs [13]. In the horizontal plane, the stationary pin was pressed with the load of 300 gf to the disk rotating. The whole friction measurement was automated and a data-logging system was used to monitor the differences in the coefficient of friction during the sliding process. After doing the wear test, an electrical balance with 0.1 mg weight scale accuracy was used to weigh the pin and coated samples to identify the wear weight loss. Finally, the difference between its weight before and after each test was calculated. This weight loss of the coated sample was taken as a factor for its wear behavior. The wear damage was evaluated through studying the width of the wear track for Ni-Mo/Al composite coating by using Optical Microscopy (OM) and SEM microscopes. Wear damage was represented by the width of the wear track for Ni-Mo/Al composite coating and the wear rate of the counter body was calculated from the worn volume. The friction coefficient was continuously recorded along with the sliding distance [14].
The Volumetric Wear Rate (VWR) of the samples shown in equation 1 was obtained using the Al particles concentration measured by EDS, assuming the density of the coating obeys the rule of mixtures.

Where m is the average mass loss (g), F is the force applied (N), L is the sliding distance (m) and ρ is the density of the materials (g/m3).

Where XAl is the weight fraction of Al particles in the coating. ρNi, ρMo and ρAl are taken as 8.9 g/cm3, 10.2 g/cm3 and 2.7 g/cm3, respectively.
The weight change of the ball was very small in all experiments, within the measurement error and therefore not reported here.
The Roughness average (Ra) was applied to measure the surface roughness in this study. This parameter has also been known as the arithmetic mean roughness value, arithmetic average or centerline average. In the current examination, the concept of surface roughness was concentrated on the universally identified Ra which has been the most popular international parameter of roughness. Ra was measured two times for each sample and the average of them was reported as final roughness number. The roughness measurement of the composite coatings was carried out using a Mitutoyo roughness testing instrument [15].
Temperature effect
As Figure 1 shows, the Al content is decreased when temperature increases beyond 40°C. The decreasing trend after a critical temperature value may also be due to the decrease in the current efficiency of nickel deposition at higher temperatures. The temperature dependence of the molybdenum content in the deposited alloy is also illustrated in Figure 1. The curve has a Gaussian form like the curve of Al with a maximum temperature at 40°C. Raising the temperature normally lowers the polarization, reduces the concentration of metal in the cathode diffusion layer and may influence the cathode current effectiveness of the deposition of metals, especially those deposited from complex ions [19].

Figure 1. The Al and Mo contents in the deposited Ni coating as a function of temperature.
Lopez-Valdivieso et al., determined the zeta potential of α-Al2O3 in 0.01 mol dm-3 aqueous NaNO3 at 10°C, 20°C, 30°C and 40°C as a function of pH. They found that the zeta potential of particles, at any pH, is shifted to more negative potentials as the temperature increases. Halter also reported that for a given pH value, an increase in temperature decreases the zeta potential which also indicates proton desorption from the surface. Generally, increasing temperature usually causes a shift of the Isoelectric Point (IEP) to lower values (at the Isoelectric Point (IEP), the net charge of the particles becomes zero and they stop migrating). Consequently, the ability of corporation into deposition and the range of stability of positive particles are decreased which are not favorable for electrophoresis. As maximum incorporation of each particle appears at a special temperature, particles under such conditions should have positive surface charge up to that temperature and negative surface charge beyond that temperature. These results show that increasing temperature does not favor particle adsorption.
Micrographs of the surface morphology of the Ni-Mo/Al composite coatings are presented in Figure 2. The coatings were crack-free, however, one can see that Al particles tend to form agglomerates when the temperature is increased to 60°C. On the other hand, it seems that the distribution of Al particles and the morphology of the coatings obtained at temperatures less than 50°C is more uniform than the other coating obtained at other temperatures. For all conditions which were reported in this article, a tendency to agglomerate was due to high surface free energy of fine Al metallic particles.

Figure 2. SEM images of Ni-Mo/Al composite coating obtained at current density 30 mA/cm2, Al content in the solution 5 g/l, stirring rate 500 rpm and different temperatures (°C): (A) 25, (B) 40, (C) 50 and (D) 60.
The details of wear resistance, estimated by VWR method, for different Ni-Mo/Al composite coatings obtained at different operating conditions are given in Table 2. From the data shown in Figure 3, it is clear that the wear loss gradually decreases with increase in temperature, attains a minimum at 40°C-50°C and then increases with further increase in temperature.
| Parameter | Values | VWR (m3/Nm) | Microhardness (VHN) | Roughness (Ra) | Thickness (mm) | Efficiency (g) (weight of Ni+Mo) |
|---|---|---|---|---|---|---|
| Temperature (oC) | 25 | 0.0019 | 296 | 1.1133 | 40 | 0.13 |
| 40 | 0.0012 | 434.3 | 0.2533 | 48 | 0.14 | |
| 50 | 0.0012 | 471.7 | 0.3467 | 45.3 | 0.13 | |
| 60 | 0.0017 | 345 | 0.72 | 39.5 | 0.11 | |
| Current density (mA/cm2) | 15 | 0.001 | 623.3 | 0.31 | 50 | 0.21 |
| 30 | 0.0012 | 434.3 | 0.2533 | 48 | 0.17 | |
| 50 | 0.0024 | 329 | 0.36 | 47.5 | 0.19 | |
| 60 | 0.0036 | 279.3 | 0.4433 | 35.7 | 0.14 | |
| Stirring rate (rpm) | 350 | 0.0017 | 417.3 | 0.3 | 29.3 | 0.07 |
| 500 | 0.0012 | 434.3 | 0.2533 | 48 | 0.14 | |
| 650 | 0.0003 | 562 | 0.2033 | 43 | 0.17 | |
| 800 | 0.0004 | 482.7 | 0.2733 | 37 | 0.18 | |
| Al content (g/l) | 1 | 0.0011 | 500.1 | 0.2567 | 43.2 | 0.14 |
| 5 | 0.0012 | 434.3 | 0.2533 | 48 | 0.14 | |
| 10 | 0.0013 | 374.8 | 0.2533 | 43.7 | 0.08 | |
| 25 | 0.0013 | 351.7 | 0.37 | 38.4 | 0.06 |
Table 2. The results of effect of parameters on some properties of Ni-Mo/Al composite coatings.

Figure 3. VWR of Ni-Mo/Al composite coatings obtained at different temperatures.
Surface roughness also influences the tribological performance of a mechanical system. Figure 4 shows the roughness values of the Ni-Mo/Al composite coatings obtain at different temperatures. As seen, the roughness of the composites shows the same behavior like wear properties with increasing temperature. It is reduced and reach a minimum at 40°C-50°C and then increases with further increase in temperature. Higher roughness indicates the presence of agglomerates which is confirmed by SEM image. A higher roughness value leads to easy pull off of the particles in wear testing. The resulting surface roughness increases the friction coefficient that leads to the loss of much more weight of coatings.

Figure 4. Surface roughness of Ni-Mo/Al composite coatings obtained at different temperatures.
The microhardness of Ni-Mo/Al composite coatings under the same condition is also shown in Table 2 and Figure 5. The microhardness of the Ni-Mo/Al composite coatings increases up to 471 VHN at 50°C and then decrease to 345 VHN with further increase in temperature. The results suggested that the wear resistance was increased with the increase of the hardness and decrease of the roughness. These results show that there is a relation between roughness and hardness with wear resistance. This achievement was approved by some references. Confirmed that the wear rate of the coatings increased significantly with increase in the substrate surface roughness. Eslami et al., also reported that the grain size and microhardness of coatings are decreased and increased, respectively, by adding particles to the matrix of coatings. According to the literatures, there are three reasons for the increase in hardness: 1) particle strengthening, 2) dispersion strengthening and 3) grain refining. Particle strengthening is related to the incorporation of hard particles and volume fraction above 20% and dispersion strengthening is associated with the incorporation of fine particles (<1 μm) and volume fraction lower than 15%.
In this case, the Al particles are softer than Ni matrix, so the load is not carried by the Al particles and the particles cannot restrain the matrix deformation and hinder dislocation motion. Consequently, the first and second strengthening mechanisms cannot be accepted as the main strengthening mechanisms in this case. The third mechanism is related to the nucleation of small grains on the surface of the incorporated particles. Based on the third mechanism, reported a mechanism for strengthening by Al metallic particles. Since the A1 particles are electrically conductive, they effectively become part of the cathode surface. Based on this property, they claimed that when the A1 particles are incorporated into a growing Ni matrix, new grains nucleate on the surface of the A1. The small grains produce a refined microstructure in comparison to a pure nickel coating deposited under similar conditions. Investigation of surface morphology of Ni/Al composite coating was provided further evidence that the A1 particles act as sites for enhanced growth of the nickel deposit. Thus, it has been concluded that additions of A1 particles to the Ni matrix can produce hardening by a structural refinement mechanism. The existence of smaller grains hinders the dislocation motion leading to an expansion in microhardness. Increasing the wear resistance by increasing the hardness, due to the reduction of grain size, has been often expressed by Archard’s law, which gives the relationship between wear volume loss (V), applied load (L), sliding distance (S) and hardness of the wearing surface (H).

Figure 5. Microhardness of Ni-Mo/Al composite coatings obtained at different temperatures.

This equation represents that there is an inverse correlation between the wear behavior and surface hardness and accordingly, the coating wear reduces as its surface hardness raises. This relation has been in agreement with the results of the current study.
As seen in Figure 1 and Figure 5, although the amount of Al content in the coating at 60°C is less than that at 50°C, the microhardness of composite coating was decreased. Generally, wear rate is considerably affected by porosity in a material. It seems that according to Figure 2 (D), agglomeration of Al particles and porosity at this temperature are the main reason for decreasing microhardness. On the other word, the aluminum particles have a complex effect on hardness. Since Al is a soft metal, for coatings with higher amounts of Al particles, each indentation will touch several A1 particles along with the Ni matrix and hence the hardness of the A1 particles begins to affect the overall hardness.
The XRD patterns of Ni-Mo/Al composite coatings obtained at various temperatures are shown in Figure 6.

Figure 6. The XRD patterns of Ni-Mo/Al composite coatings obtained at different temperatures.
It was demonestrated that Ni-Mo/Al composite coatings around 40°C-50°C show a maximum wear resistance and microhardness with further increase in temperature. As is seen in Figure 6, two planes Ni (111) and Ni (200) have the main intensity and confirm that these two planes compose the most surface area of coatings. As can be seen, the intensity of Ni (111) and Ni (200) peaks were decreased and increased with increaseing temperature, respectively and both peaks reached a minimum and maximum around 40°C-50°C, respectively. It is clear that with face centered cubic crystals the slip plane, which is the crystallographic plane in which adjacent atomic layers can slide over each other with minimum friction, is the (111). Consequently, in spite of that (200) planes have lower planar density and lower wear resistance than that of the (111) planes in the fcc structure, the wear resistance of Ni-Mo/Al composite coatings at 40°C-50°C with the predominant (200) planes are high. Therefore, it is decided that the chemical composition of the Ni-Mo matrix has two different detrimental and beneficial effects on the wear resistance of Ni-Mo/Al composite coatings. As a consequence, besides the chemical composition, phase structure is also another considerable factor affecting the wear property of composite coatings. On the other hand, besides the negative effect of the presence of the low density (200) planes with high friction, another reason for decreasing the wear rate and increasing microhardness of the Ni-Mo/Al composite coatings with increasing temperature up to 40°C-50°C, could be related to their grain sizes which was explained by reference. As it was shown in Figure 1, by increasing the temperatures beyond the 40°C, the deposited Al content in the coating decreases which can be followed by increasing in grain size. Because by increasing temperature beyond the 50°C and decreasing Al content, the wear rate is intensively increased. It is known that the Hall-Petch equation can empirically describe the relationship between flow stress and grain size. This equation relates the grain size, d, with the hardness, H, of a metal.
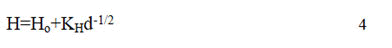
The terms, Ho and K are experimental constants and are different for each metal. Ho is the value characteristic of dislocation blocking and is related to the friction stress. KH takes account of the penetrability of the boundaries to moving dislocations and is related to the number of available slip systems.
The values of thickness obtained at different temperatures were also assigned in Table 2 and Figure 7. The thickness of coatings is reached to a maximum value at 40°C and then decreased with further increase in temperature. Decreasing thickness can be related to the current efficiency. Raising the temperature usually leads to the decreases in polarization, improves the concentration of the metal in the cathode diffusion layer and may influence the cathode current effectiveness in depositing metals, especially those deposited from complex ions. It seems that by increasing the temperature up to 40°C in this case, the concentration of metallic ions in the cathode diffusion layer is increased and then decreases by further increases in the temperature. The total of metallic part of coatings is reached a maximum at 40°C and then started to reduce by further increases in the temperature, which confirmed that the most part of deposition current was consumed by hydrogen evolution and metallic ions could not deposit much more.

Figure 7. Thickness of Ni-Mo/Al composite coatings obtained at different temperatures.
The current efficiency of the bath at different temperatures is also shown in Figure 8. For this purpose, at the first step, the weight of the Al powder was subtracted from the total weight of coating and the remaining weight was the weight of Ni and Mo elements which consume electrons and electrical current. As can be seen, the highest efficiency is obtained at 40°C. As is shown, the efficiency is deteriorated with further increase in temperature.

Figure 8. Current efficiency of Ni-Mo/Al composite coatings obtained at different temperatures.
Current density effect
According to the Smoluchowski equation, each charged particle will have a velocity (vE) in an electric field, which can be expressed as:

Where E is the applied electrical field strength, uE is the electrophoretic mobility of the particle, ζ is the zeta potential, ε is the dielectric constant of the electrolyte and η is the viscosity of the suspension.
According to equation 5, if the applied electrical field increases, the electrophoretic velocity of the charged particles, vE increases. This means that the amount of deposited particles is higher than that under a low applied electrical field condition. Many articles have reported that the particle content of deposit is drastically changed when current density is modified. Showed that SiC content increases up to a maximum value then decreases with increasing current density have reported a similar trend. It was also seen that during electrodeposition of Ni-Mo/Al composite coating, Al particles show a similar behavior. Al content in the deposit increases up to a maximum (approximately 39.9 wt%) at 50 mA/cm2 and then decreases with increasing current density (Figure 9). Decreasing Al deposited at higher current densities (>50 mA/cm2) is due to the rapid deposition of the metal matrix and fewer particles are embedded in the coating. Therefore, this is the reason why the lower content of the co-deposited Al particulates was produced at higher current density (60 mA/cm2).

Figure 9. The Al and Mo contents in the coating as a function of current density.
SEM images of the surface morphology of the Ni-Mo/Al composite coatings are presented in Figure 10.

Figure 10. SEM images of Ni-Mo/Al composite coating obtained at temperature 40°C, Al content in the solution 5 g/l, stirring rate 500 rpm and different current densities (mA/cm2): (A) 15; (B) 30; (C) 50 and (D) 60.
The coatings were crack-free. The details of VWR estimated by weight loss method different of Ni-Mo/Al composite coatings obtained at different current densities are given in Table 2. Generally from the data shown in Figure 11, it is clear that the wear loss gradually increases with increase in current density up to 30 mA/cm2 and then sharply increases with further increase in current density.

Figure 11. VWR of Ni-Mo/Al composite coatings obtained at the same condition.
As can be seen in Figure 12, the roughness of the composites is increased with further increase in current density. Like the effect of temperature, the resulting surface roughness increases the friction coefficient that leads to loss of much more weight of the coatings [22].

Figure 12. Roughness of Ni-Mo/Al composite coatings obtained at different current densities.
The microhardness of Ni-Mo/Al composite coatings under the same condition was shown in Table 2 and Figure 13. The microhardness of the Ni-Mo/Al composite coating is decreased from 614 VHN to 280 VHN with further increase in current density from 15 to 60 mA/cm2. The result suggests that the wear resistance is decreased with decreasing microhardness and increasing roughness. These results show that there is a relation between roughness and hardness with wear resistance.

Figure 13. Microhardness of Ni-Mo/Al composite coatings obtained at different current densities.
The crystallite size refinement and the texture evolution played important roles in the improvement of the wear property. Thus, it will be discussed in the following.
As shown in Figure 14, XRD line profiles of Ni-Mo/Al composite coatings change with increasing current density. By increasing the current density, the strongest diffraction reflection is changed from (111) (for a pure nickel) to (200) diffraction peak, implying the texture evolution of the electrodeposited Ni-Mo matrix coatings. A twocomponent texture of the (100) and (111) is frequently observed in nanocrystalline Ni and its alloys. However, as it is seen, with the increasing of current density, the intensity percentage of (200) increases and the intensity percentage of (111) decreases. As the current density increased, the (111) orientation disappeared. The same results were reported by other references. The Al peaks were also observed for coatings deposited at different current densities. As it was also mentioned in the section of temperature effect, since the total number of atoms present on the surface of (200) is less than the (111) plane, the friction force on these kind of surfaces will be high compared to the (111) planes with high packing factor. Therefore, it is reasonable to decide that the wear rate is increased due to increasing the predominant (200) planes and surface roughness of Ni-Mo/Al composite coating with increasing current density. However, the presence of the predominant (200) plane and high roughness values cannot be accepted as the main reasons for this low microhardness. Despite the fact that the (200) plane was also the predominant crystallographic orientation for increasing temperature in the section of temperature effect, the composite coating had the highest wear resistance and microhardness and thus it was concluded that decreasing grain size with increasing temperature was the predominant strengthening mechanism.
According to this interpretation, the grain coarsening by increasing current density can be considered as the main reason for decreasing wear resistance and microhardness and increasing roughness. Consequently, it seems that the grain size of coatings is simultaneously affected by current density and Al particles in which each of them has opposite effect on the grain size. It means that grain size is increased and decreased by increasing current density and Al particles content by two different rates, respectively. The rate of grain coarsening due to increasing current density is more than that of grain refining. There are evidences which show that the rate of grain coarsening is the predominant mechanism and can be considered as follow: The first evidence is that the peak width increases by increasing the current density, as is seen in Figure 14. Careful examination shows that the XRD peaks of Ni-Mo/Al composite coatings at low current density e.g. 15 mA/cm2 is wider than that of the coating obtained at high current density e.g. 60 mA/cm2.
The second reason can be attributed to the decreasing microhardness with further increase in the current density. The relationship between wear resistance and microhardness, in this case, is also satisfied the Archard’s law, which was discussed in the section of temperature effect. Consequently, it can be decided that decreasing microhardness of Ni-Mo/Al composite coating is due to the grain coarsening which happens during increasing current density. From the above results, it could be concluded that the deterioration of wear resistance of Ni-Mo/Al coatings was linked to the combined effect of incorporation of grain coarsening and texture evolution from (111) plane to predominant (200) plane.

Figure 14. The XRD pattern of Ni-Mo/Al composite coatings obtained at different current densities.
The values of thickness obtained at different current densities were also assigned in Table 2 and Figure 15. As is shown, the thickness of coatings decreases with increasing current density. Decreasing thickness with increasing current density can be linked to the current efficiency which decreased by increasing current density. The current efficiency of the bath at different current densities is also shown in Figure 16. For this purpose, at the irst step like the temperature effect section, the weight of the Al powder was subtracted from the total weight of coating and the remaining weight was the weight of Ni and Mo elements which consume electrons and electrical current. As can be seen, the most efficiency is obtained at low current density, 15 mA/cm2. As is shown, the efficiency is deteriorated with further increase in current density. It means that the current parameter deteriorates the current efficiency and decreases thickness. At a higher current density, the reaction of hydrogen evolution could become increasingly dominant. This could lead to a smaller current used for the deposition of Ni and Mo as metallic elements to form the matrix. As it is shown in Figure 16, the weight of coating as a criterion for efficiency is reduced by increasing current density which is shown that a part of current was consumed by hydrogen evolution.

Figure 15. Thickness of Ni-Mo/Al composite coatings obtained at different current densities.

Figure 16. Current efficiency of Ni-Mo/Al composite coatings obtained at different current densities.
Stirring rate effect
Many investigations have found that incorporating particles in an electrodeposited coating increases up to a maximum then decreases by increasing stirring rate. This means that excessive agitation may lead to a lower particle loading in the metal deposits. On the other hand, there is a critical stirring rate after which the stirring rate can have a negative effect on the incorporation of particles in the coatings. This effect can be related to the effect of hydrodynamic forces proposed. They proposed that, depending on the Reynolds number, laminar, transition or turbulent flow regimes are possible. According to their reported results, at the beginning before a critical value, the flow regime is either laminar or transition and the amount of deposited particles will be constant or increase at higher stirring rate, respectively. Beyond a critical stirring rate, increasing the stirring rate in the suspension may also sweep away loosely adsorbed particles from the cathode surface and decrease the concentration of deposited particles in the composite coating. It is shown in Figure 17 that the stirring rate strongly affects the weight percentage of the co-deposited Al particles since Al should be transported to the cathode surface for the codeposition with the Ni- Mo matrix. The behavior of Al particle in this work is the same with the results reported by literature. As stirring rate increases further, deposited particles decrease drastically.

Figure 17. The deposited Al and Mo contents in the coating as a function of stirring rate.
SEM micrographs presented in Figure 18 illustrate different morphologies of the Ni-Mo/Al composite coating. It is evident that the co-deposited Al particles are uniformly distributed in the Ni-Mo matrix by electrodeposition. It is important to disperse the Al particles very well in the electrolyte. As long as the Al particles in the coatings are uniformly distributed, Ni-Mo/Al composite coatings could possess excellent mechanical and corrosion resistance properties.

Figure 18. SEM images of Ni-Mo/Al composite coating obtained at current density 30 mA/cm2, temperature 40°C, Al content in the solution 5 g/l and different stirring rates (rpm): (A) 350; (B) 500; (C) 650 and (D) 800.
From the data shown in Figure 19 and presented in Table 2, it is clear that the wear loss gradually decreases with increase in stirring rate, attains a minimum at 650 rpm and then increases with further increase in stirring rate.

Figure 19. VWR of Ni-Mo/Al composite coatings obtained at same condition.
Figure 20 shows the roughness values of the Ni-Mo/Al composite coatings obtained at different stirring rates. As it is seen, the roughness of the composites shows the same behavior like wear property with increasing stirring rate. Higher roughness indicates the presence of agglomerates which is confirmed by SEM image. A higher roughness value leads to easy pull off of the particles in wear testing. The resulting surface roughness increases the friction coefficient that leads to loss of much more weight of coatings [22]. It is clear that the roughness was decreased by increasing stirring rate and reached a minimum at 650 rpm, then increased by increasing stirring rate.

Figure 20. Surface roughness of Ni-Mo/Al composite coatings obtained at same condition.
The microhardness of Ni-Mo/Al composite coatings obtained at different stirring rates are shown in Table 2 and Figure 21.

Figure 21. Microhardness of Ni-Mo/Al composite coatings obtained at same condition.
The results suggest that the wear resistance increased with the increasing microhardness and decreasing roughness. These results show that there is a relation between roughness and hardness with wear resistance. It is seen in Figure 21, the microhardness of coatings is increased by increasing stirring rate, reaches a maximum at 650 rpm and then decreases by further increases in the stirring rate.
Similar to the last two sections, the crystallite size refinement played important roles in the improvement of the wear behavior. Thus, it will be discussed in the following paragraph.
As shown in Figure 22, XRD line profiles of Ni-Mo/Al composite coatings change with increasing stirring rate. By increasing the stirring rate, the most powerful diffraction reflection is changed from 200 to 111 diffraction peak, implying the texture evolution of the electrodeposited Ni-Mo matrix coatings. As it is seen, with increasing stirring rate, the intensity percentage 200 decreased and the intensity percentage 111 increased. As the stirring rate increased, the 111 orientation became a predominant peak which was a peak with very weak intensity at low stirring rates e.g. 350 rpm. This behavior is very favorite to obtain a coat with high microhardness and wear. Because the total number of atoms present on the surface of 111 is more than the 200 plane, the friction force on these kinds of surfaces will be low compare to the 200 planes with high packing factor. Therefore, it is reasonable to decide that the wear rate should be decreased due to increasing the predominant 111 planes and decreasing surface roughness of Ni-Mo/Al composite coating with increasing stirring rate.

Figure 22. XRD patterns of Ni-Mo/Al composite coatings obtained at same condition.
However, the presence of the predominant 111 plane and low roughness values cannot be accepted as the main reasons for this high microhardness. According to the Archard’s law, the grain refining by increasing stirring rate can be considered as the main reason for increasing wear resistance and microhardness and decreasing roughness. It was also demonstrated and reported frequently that the grain size of coatings is reduced by increasing the amount of inclusion particles in the composite coatings and vice versa. On the other hand, it was seen in Figure 17, the Al content was intensively decreased by increasing stirring rate. Consequently, the grain refining cannot be linked to the presence of Al particles in the coating, because the amount of Al particles is reduced by increasing stirring rate. Consequently and contrary to the temperature and current density parameters in which the Al particles had mainly effect on the grain refining, it seems that the grain refining is mainly affected by stirring rate.
As it is seen in the XRD patterns in Figure 22, in spite of decreasing Al content in the coatings, peak broadening which shows that the grain size is reduced, occurred by increasing stirring rate. It is observed from Figure 22 that an increase in stirring rate up to 650 rpm leads to an increase in the intensity of 111 plane. Grain refining with increasing stirring rate was confirmed by different references. The proportionate rates of the formation of crystal nuclei and the growth of the existing crystals powerfully affected the crystal structure obtained from an electrodeposition process. The conditions that favor crystal nuclei formation lead to the finer-grained deposits, while larger crystals are formed in those cases that support the growth of the existing crystals. Thus, it seems that agitation promotes the formation of crystal nuclei. Because the agitation can directly affect the composition of the alloy by reducing the thickness of cathode diffusion layer. Figure 23 confirms this idea. As it is seen, the weight of metallic ions or current efficiency was increased by increasing stirring rate which reveals that the concentration of metallic ions in the diffusion layer was increased. A fine-grained matrix may impede the easy movement of dislocations and resist plastic flow. This resistance to deformation is shown by an increasing hardness value which is in agreement with microhardness results in Figure 21.

Figure 23. Weight of total deposited metallic ions of Ni-Mo/Al composite coatings obtained at same condition.
As can be observed, the highest efficiency is obtained at a high stirring rate, 800 rpm. It means that the stirring rate parameter has a beneficial effect on the current efficiency while decreases contradictory thickness. The values of thickness obtained at different stirring rates were also assigned in Table 2 and Figure 24. As is seen, the thickness of coatings is reached a maximum value at 500 rpm and then decreased with further increase in stirring rate. Decreasing the thickness is related to the decreasing the amount of Al particles in the coatings. Participation of particles in the coatings has a direct effect on the thickness value.

Figure 24. Thickness of Ni-Mo/Al composite coatings obtained at same condition.
Ni-Mo/Al composite coatings were made by using a citrate bath containing Al particles. The effect of some operating parameters was investigated on the wear, microhardness, roughness, current efficiency, Al particles content in the coatings and morphology properties of Ni-Mo/Al composite coating. It was seen that mentioned properties specially the Al particles content in the coatings show parabolic behavior by changing investigated operating parameters. It means that there is a critical value for mentioned parameters in which properties of coatings become maximum. Among all parameters, the stirring rate powerfully influences the weight percentage of the co-deposited Al.
Journal of Material Sciences & Engineering received 3677 citations as per Google Scholar report