Research Article - (2025) Volume 16, Issue 1
Received: 02-Sep-2024, Manuscript No. BEJ-24-147111;
Editor assigned: 05-Sep-2024, Pre QC No. BEJ-24-147111 (PQ);
Reviewed: 20-Sep-2024, QC No. BEJ-24-147111;
Revised: 02-Jun-2025, Manuscript No. BEJ-24-147111 (R);
Published:
09-Jun-2025
, DOI: 10.37421/2151-6219.2025.16.547
Citation: Zain, Amir Makhmud NST, and Dian Pernama Sari. "The Effect of Career Development and Rewards on Employee Achievement at Pt. Bank Sumut Central Medan." Bus Econ J 16 (2025): 552.
Copyright: 2025 Zain AMNST, et al. This is an open-access article distributed under the terms of the creative commons attribution license which permits unrestricted use, distribution and reproduction in any medium, provided the original author and source are credited.
This study aims to determine whether career development and rewards either partially or simultaneously have a significant effect on employee performance at PT. Central Sumatra Bank Medan and how big the percentage. The method used in this study is a quantitative method with several tests, namely reliability analysis, classical assumption deviation test and linear regression. This means that the hypothesis in this study is accepted, as evidenced by the value of t-count
Career development • Reward • Work achievement
Career development is basically oriented to the development of the organization/company in the future. Every company must accept the fact that its future existence depends on human resources. Without competitive HR, an organization/company will experience setbacks and may eventually be sidelined or out of business. Therefore, it is necessary to maintain employees in the form of career development. With career development, employees will be serious in working to achieve a better career process. Employees will feel unmotivated to work if the company closes access for employees to develop their abilities at work. An employee will tend to look for another job that has a better career path [1,2].
PT. Bank Sumut is a financial services company owned by Regional Owned Enterprises (BUMD), another name for PT. Bank of North Sumatra is PT. North Sumatra Regional Development Bank. In carrying out its management PT [3]. Bank Sumut expands its company beyond Sumatra. Based on the author's observations that there are problems felt by employees regarding career development and the rewards given, namely regarding career development that the work given by the manager is a level 4 job even though the employee given the job is a level 2 employee and an employee with level 2 never gets a promotion. level increase. Then in terms of employee rewards, the management has not realized it for unclear reasons [4].
Formulation of the problem
Based on the description of the background and identification of the problems described above, the problems that will be studied in this research are:
• Do career development and rewards, either partially or simultaneously, have a significant influence on employee performance at PT. Central Sumatra Bank, Medan?
• How big is the percentage level of career development and rewards on employee performance at PT. Central Sumatra Bank, Medan?
Research purposes
A research must have a purpose, while the objectives of this research are:
• To find out whether career development and rewards, either partially or simultaneously, have a significant effect on employee performance at PT. Central Sumatra Bank, Medan.
• To find out how big the percentage level of career development and rewards on employee performance at PT. Central Sumatra Bank, Medan.
Career development
According to Yuniarsih and Suwatno quoted by Suwatno and Priansa career development is a formal approach used by organizations to ensure that employees with the right qualifications and experience are available when needed [5]. Singodimedjo quoted by Sutrisno, career is a sequence of activities, behaviors related to work, attitudes, and aspirations that are related during one's life.
According to Handoko quoted by Sutrisno, the term career has been used to denote people in their respective roles or statuses. Sutanto quoted by Sutrisno there are three factors that are considered important for career success, including: 1) Being able to place oneself in the right conditions, without sacrificing life principles, 2) Being brave to face risks and challenges with full responsibility, and 3) Able to communicate smoothly with various parties [6].
Rewards
According to Irmayanti as quoted by Syaputra, he explained that rewards are also called intrinsic rewards, namely rewards that are part of the work itself, rewards that include enthusiasm. According to Kadarisman quoted by Syaputra, he argues that reward is a form of return, both financial and non-financial. According to Sutrisno, quoted by Rendra, he argues that rewards are remuneration provided by the company to employees on the basis of the sacrifice of time, energy and thoughts [7].
Work performance
In general, work performance is defined as a person's success in carrying out a job Maier. Even more assertive are Lawler and Porter, who state that job performance is a "successful role achievement" that a person gets from his actions. The level of success of a person in carrying out his work tasks is called the level of performance by Vroom [8].
Research sites
This research was conducted at PT. Central Sumatra Bank, Medan, having its address at Jl. Imam Bonjol No. 18 Madras Hulu village, Medan Polonia district, Medan city, North Sumatra Province.
Research time
Considering that this research is the first time for the author, the writer takes a long time to complete it. This research is planned to be carried out for 6 (six) months starting from March to August 2020.
Population and Sample
According to Ircham Machfoedz, states that: "The population is the whole subject of research". According to Sekaran and Bougie the population is a group of people, events, or interesting things and then the researcher wants to investigate and make an opinion. According to Cooper and Emory as stated by Syaiful the population is the entire collection of elements that can be used to make some conclusions. Meanwhile, according to Ety Rochaety, "Population is the entire unit of analysis/measurement results which are limited by a certain criterion". The population in this study were all employees at PT. Bank Sumut Central Medan as many as 295 people.
The sample is part of the population taken through certain ways which also have certain characteristics. Samples will be taken if the researcher is not able to conduct research by taking data directly from the Efferin population proposed by Syaiful. According to Furchan as stated by Syaiful the sample is part of the population, or a small group being observed. Given the large population of 295 people.
So the sample in this study were 75 people. The distribution of questionnaires was sent to employees. The sampling technique used was accidental sampling. According to Machfoedz, "Accidental techniques are carried out based on chance, anyone encountered, as long as it complies with the desired data requirements".
Data analysis technique
The data analysis technique that will be used by the author in this study is a statistical technique. According to Moh. Nazir, "Statistics play an important role in research, both in modeling, in formulating hypotheses, in developing data collection tools and instruments, in preparing research designs, in determining samples, and in data analysis".
Some of the statistical techniques used to analyze the data in this study are:
• Reliability analysis.
• Classical assumption deviation test.
• Linear regression.
Reliability test
Furthermore, to obtain a reliable instrument, a reliability test was conducted. The reliability test is intended to see the extent to which the results of an instrument measurement can be trusted and accounted for. Reliability test was conducted to see the consistency of the answers. Testing reliability with internal consistency by trying the instrument only once and analyzed using the Cronbach Alpha technique (Table 1).
| Research variable | Number of questions | Cronbach’s alpha | Result description |
| Career development (X1) | 10 | 0,929 | Well |
| Rewards | 10 | 0,821 | Well |
| (X2) | 10 | 0,899 | Well |
Table 1. Reliability test results.
According to Uma, "Reliability less than 0.6 is not good, while 0.7 is acceptable and above 0.8 is good".
Statistical test analysis
Normality test: Normality test is a test carried out with the aim of assessing the distribution of data in a group of data or variables, whether the distribution of the data is normally distributed or not. Normality test is useful for determining the data that has been collected is normally distributed or taken from a normal population. The classical method of testing the normality of a data is not so complicated.
Based on the empirical experience of several statisticians, the data with more than 30 numbers (n>30), can be assumed to be normally distributed. Commonly referred to as a large sample. However, to provide certainty, whether the data is normally distributed or not, the normality test should be used. Because data that is more than 30 can be ascertained to be normally distributed, and vice versa, data that is less than 30 is not necessarily not normally distributed, for that we need a proof.
To see whether the data is normally distributed or not, the author uses the Kolmogorov-Smirnov analysis test with the criteria for the significance value having to be greater than 0.05 to say that the data is normally distributed (Table 2).
| One-sample Kolmogorov-Smirnov test | Unstandardized residual | |
| N | 75 | |
| Normal Parametersa,b | Mean | 0E-7 |
| Std. deviation | 2.1747083 | |
| Most extreme differences | Absolute | 0.14 |
| Positive | 0.109 | |
| Negative | -0.14 | |
| Kolmogorov-Smirnov Z | 1.211 | |
| Asymp. sig. (2-tailed) | 0.106 | |
| Note: aTest distribution is normal. bCalculated from data |
||
Table 2. Normality test results.
From the table of normality test results above, it is known that the significance value of 0.106 is greater than 0.05 so it can be concluded that the tested data is normally distributed.
Multicollinearity test
Multicollinearity is a situation that shows a strong correlation or relationship between two or more independent variables in a multiple regression model. If there is multicollinearity, then a variable that is strongly correlated with other variables in the model, the predictive power is not reliable and unstable and the meaning of multicollinearity actually lies in the presence or absence of correlation between independent variables.
One way to see the presence or absence of multicollinearity symptoms is to look at the tolerance and Variance Inflating Factor (VIF) values. If the tolerance value>0.1 and VIF<10, it can be indicated that there is multicollinearity and vice versa. The following are the results of the multicollinearity test that were tested using SPSS Version 20 software (Table 3).
| Coefficientsa | ||||||||
| Model | Unstandardized coefficients | Standardized coefficients | t | Sig. | Collinearity statistics |
|||
| B | Std. error | Beta | Tolerance | VIF | ||||
| (Constant) | 5.441 | 3.244 | 1.677 | 0.098 | ||||
| 1 | Development career |
0.031 | 0.05 | 0.039 | 0.609 | 0.544 | 0.971 | 1.03 |
| Reward | 0.841 | 0.065 | 0.834 | 12.929 | 0 | 0.971 | 1.03 | |
| Note: aDependent variable: Achievement.Work | ||||||||
Table 3. Multicollinearity test results.
From the table of multicollinearity test results above, it can be explained that the Tolerance value is 0.971>0.1 and the VIF value is 1.030<10. These results indicate that there is no multicollinearity in the regression model.
Autocorrelation test
Autocorrelation is a correlation between observation members arranged according to time or place. A good regression model should not have autocorrelation. To see whether or not there is autocorrelation in the regression model, the author uses the Durbin- Watson test with the following criteria:
Positive autocorrelation detection
• If dw
• If dw>dU then there is no positive autocorrelation.
• If dL
• If (4–dw)
• If (4–dw)
| Model summaryb | |||||
| Model | R | R square | Adjusted R square | Std. error of the estimate | Durbin-Watson |
| 1 | .842a | 0.709 | 0.701 | 2.20471 | 1.856 |
| Note: aPredictors: (Constant), Reward, Development.Career bDependent variable: Achievement.Work |
|||||
Table 4. Autocorrelation test results.
From the table of autocorrelation test results above, it can be seen that the Durbin-Watson value is 2.016 and the value is positive. To find out whether the regression model in this study has autocorrelation, it must be included in the test criteria as follows:
• 1,856<1,570 then there is a positive autocorrelation (False).
• 1.856>1.680 then there is no positive autocorrelation (True).
• 1.570<1.856<1.680 then the test is not convincing (False).
Thus it can be concluded that the regression model in this study does not have a positive autocorrelation.
Heteroscedasticity test
Heteroscedasticity is the residual variance that is not the same in all observations in the regression model. A good regression should not occur heteroscedasticity. The heteroscedasticity test in this study was tested using the graph method. The reason is because it is more practical, where when we do the heteroscedasticity test, the heteroscedasticity test results can automatically be seen immediately. The following are the results of the heteroscedasticity test using the graphical method.
Linear regression
Multiple linear regression analysis
The results of multiple linear regression analysis can be seen in the Table 5.
| Coefficientsa | ||||||||
| Model | Unstandardized coefficients | Standardized coefficients | t | Sig. | Collinearity statistics | |||
| B | Std. error | Beta | Tolerance | VIF | ||||
| 1 | (Constant) | 5.441 | 3.244 | 1.677 | 0.098 | |||
| Development. Career | 0.031 | 0.05 | 0.039 | 0.609 | 0.544 | 0.971 | 1.03 | |
| Rewards | 0.841 | 0.065 | 0.834 | 12.929 | 0 | 0.971 | 1.03 | |
| Note: aDependent variable: Achievement.Work | ||||||||
Table 5. Multiple linear regression analysis.
The multiple linear regression equation is obtained as follows:
Y=5.441+0.031 X1+0.841 X2+e
Constant (a)=5.411 shows a constant value, where if the career development variables (X1) and reward (X2)=0 then the work performance of the employees of Bank Sumut Central Medan (Y)=5.441.
Regression coefficient X1=0.031 indicates that career development has a positive effect on work performance so that if the career development of Bank Sumut Central Medan employees is increased by 1 unit, work performance will increase by 0.031.
The regression coefficient X2=0.841 indicates that the reward given has a positive effect on work performance. So that if the reward is increased by 1 unit then work performance will increase by 0.841.
Partial hypothesis testing (t test)
In the coefficientsa table, the t value is also obtained. The calculated t value is then compared with the t table value at=0.05. The value of t table in df (n-k) where n is the number of samples and k is the number of variables, both independent and dependent variables, then 75-3=72. In df 72 with=0.05 the value of t table is 1.993.
The t-count value of the career development variable (X1) is 0.609, thus t-count
The t-value of the reward variable (X2) is 12,929, thus t-count>t table, then H0 is rejected and H1 is accepted, which means that the reward variable (X2) has a significant effect on employee performance.
Simultaneous hypothesis testing (F test)
ANOVA or analysis of variance is a joint regression coefficient test (F test) to test the significance of the effect of several independent variables on the dependent variable. The results of the F test can be seen in the Table 6.
| ANOVAa | ||||||
| Model | Sum of squares | df | Mean square | F | Sig. | |
| 1 | Regression | 852.214 | 2 | 426.107 | 87.663 | .000b |
| Residual | 349.972 | 72 | 4.861 | |||
| Total | 1202.187 | 74 | ||||
| Note: aDependent Variable: Achievement.Work bPredictors: (Constant), Reward, Development.Career |
||||||
Table 6. ANOVA or analysis of variance is a joint regression coefficient test.
In the ANOVAb table, the calculated F value is 87.663 while the F table value is 3.12. Thus, F-count>F-table means that the career development and reward variables together have a positive and significant effect on the work performance of Bank Sumut Central Medan employees.
Coefficient of determination test (R2)
The coefficient of determination (R2) of the regression results can be seen in the Table 7.
| Model summaryb | |||||
| Model | R | R square | Adjusted R Square | Std. Error of the Estimate | Durbin-Watson |
| 1 | .842a | 0.709 | 0.701 | 2.20471 | 1.856 |
| Note: aPredictors: (Constant), Reward, Development.Career bDependent variable: Achievement.Work |
|||||
Table 7. Coefficient of determination test.
The value of the coefficient of determination (R2) from the regression result is 0.709, meaning that the career development and reward variables contribute to the effect of 70.9% on employee performance at Bank Sumut Pusat, Medan. This result is the result of (R2 x 100%), while the remaining 29.1% is influenced by other variables not examined in this study.
From the research results that have been discussed by processing and questionnaires and using several tests, the following conclusions can be drawn:
Partially, the career development variable (X1) has a significant effect on the work performance of Bank Sumut Central Medan employees. This means that the hypothesis in this study is rejected, as evidenced by the value of t-count
Simultaneously, career development variables (X1) and rewards (X2) have a positive and significant influence on the work performance of Bank Sumut Central Medan employees. This means that the hypothesis in this study is accepted, as evidenced by the calculated F-value>F-table (87.663>3.12).
The career development level variable (X1) and reward (X2) are able to contribute to the influence of the employee performance variable by 70.9% while the remaining 29.1% is influenced by other variables not examined in the study.
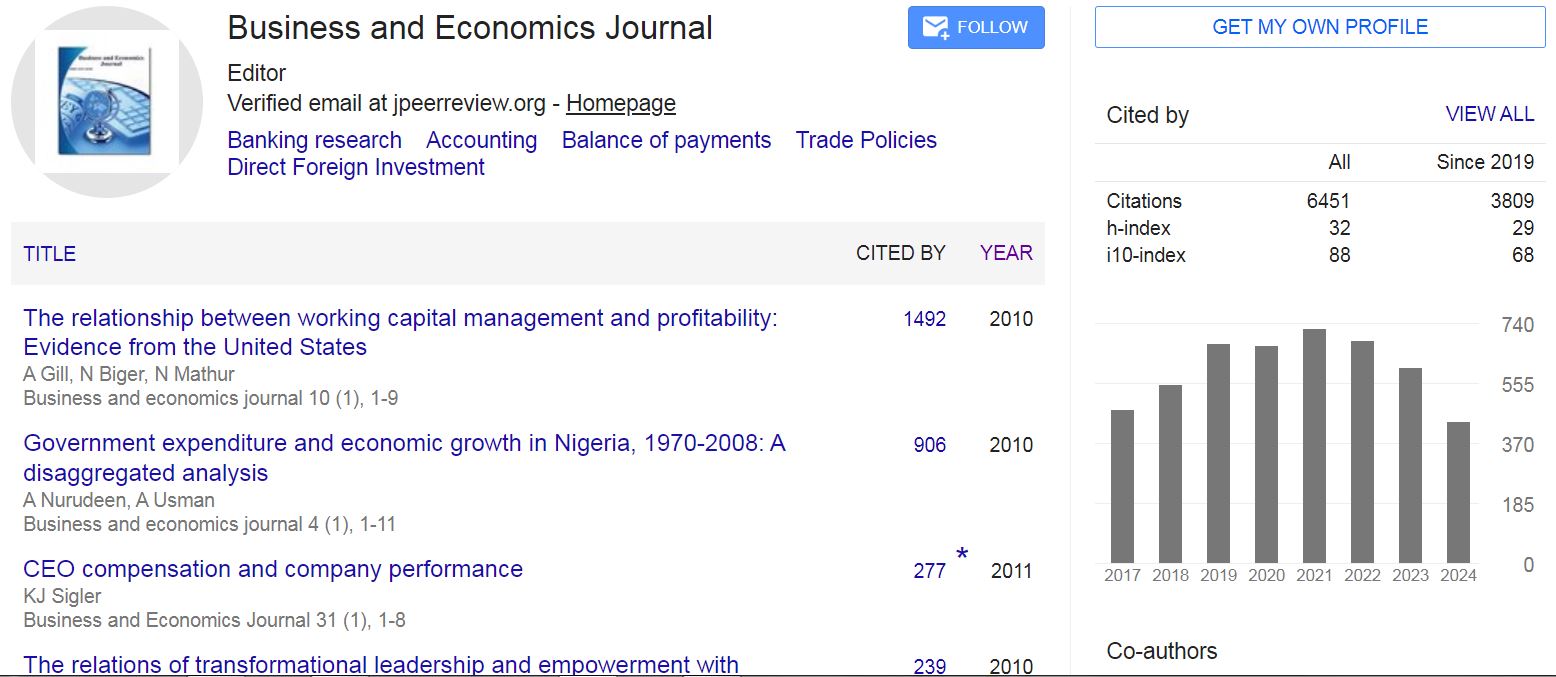
Business and Economics Journal received 6451 citations as per Google Scholar report