Research Article - (2025) Volume 16, Issue 3
Received: 02-Oct-2024, Manuscript No. JAR-24-149397;
Editor assigned: 07-Oct-2024, Pre QC No. JAR-24-149397 (PQ);
Reviewed: 22-Oct-2024, QC No. JAR-24-149397;
Revised: 03-Jun-2025, Manuscript No. JAR-24-149397 (R);
Published:
10-Jun-2025
, DOI: 10.37421/2155-6113.2025.16.969
Citation: Dagnachew, Yalemwork Desta, and Awoke Seyoum Tegegne. "Factors Associated with the Risk of Anemia and Underweight among under-Five Children in Ethiopia; Application of Bivariate Binary Logistic Regression Models." J AIDS Clin Res 16 (2025): 969.
Copyright: © 2025 Dagnachew YD, et al. This is an open-access article distributed under the terms of the creative commons attribution license which permits
unrestricted use, distribution and reproduction in any medium, provided the original author and source are credited.
Sources of funding : This research did not receive any specific grant from funding agencies in the public, commercial, or not-from-profit sectors.
Background: Anemia and underweight are public health problems affecting both developed and developing nations worldwide with a significant consequence of health and economic growth. Thus, this study aimed to identify factors affecting anemia and underweight in under five children in Ethiopia.
Method: This study was done using 2016 EDHS data considering a sample of 8,439 under-five children. The study was conducted across the country using the cross-sectional survey. Hemoglobin level <11 g/dl and Z-score below -2 SD were used to investigate anemia and underweight respectively.
Result: The prevalence of anemia and underweight in this study was 57.5% and 25.4% respectively. This study also revealed that the spatial distribution of anemia and underweight were random in Ethiopia with Moran’s index statistics -0.012288 and -0.025832 with corresponding pvalue of 0.956670 and 0.801798 respectively. In bivariate binary logistic regression analysis, variables such as children who had large size at birth (AOR=0.861, 95% CI: (0.510, 0.873)), Children from rich families were less likely to be anemic (AOR=0.690, 95% CI: (0.486, 0.957). Children from educated families were less likely to be anemic (AOR=0.802; 95% CI: (0.594, 0.949) and such children were also less likely to be underweight (AOR=0.661; 95% CI: (0.619, 0.898).
Conclusion: Child age, size of child at birth, birth type, fever, parent’s education, wealth index, and region were significant factors affected for severity of anemia and underweight status of under-five children in the study area. Health related education should be conducted for those households with anemic and underweight children.
Anemia • Underweight • Spatial analysis • Bivariate binary logistic regression • Under-five Children
EDHS: Ethiopian Demographic Health Survey; AOR: Adjusted Odds Ratio; SE: Standard Error; CI: Confidence Interval; ref: reference category; SNNP: South Nations Nationalities and Peoples; HHs: House Holds; WHO: World Health Organization; GLM: Generalized Linear Model; GIS: Geographical Information System
Nutrition is a process by which individuals achieve physical and mental growth throughout their lifetimes [1]. Nutritional status is the result of complex interactions between food consumption and the overall status of health and healthcare practices [2]. Malnutrition and shortage of balanced diet are the biggest risk factors for the global burden of disease [3]. Every country, in developing nations is facing a serious public health challenge from malnutrition. Hence, one in three people is malnourished and approximately 45% of the deaths of children are related to malnutrition and its economic consequences represent 11% losses of Growth of Domestic Product (GDP) every year in Africa and Asia [4].
Anemia is the most common nutritional problem and the most widespread public health micronutrient deficiency disorder, affecting over 2 billion people worldwide. More than 89% of the cases are from low and middle-income countries. It has serious consequences for human health as well as social and economic development in both developed and developing countries. Anemia can strike everyone at any age, but under-five children and pregnant women are particularly vulnerable groups [5].
Underweight is a composite measure of stunting and wasting. Children whose weight for age Z-score is below minus Two Standard Deviations (−2 SD) from the median of the World Health Organization (WHO) reference population are considered to be underweight. Children are underweight for their age, wasted, stunted, or both [6]. Thus, underweight serves as an overall indicator of the population’s poor nutritional health status [6]. Underweight reflects current undernutrition status and can be acute, chronic, or both. It can manifest alone or in combination with other forms of under nutrition in underfive children [7]. Underweight children have low immunity to infections and a higher risk of dying from communicable diseases, while those who survive are exposed to recurring illnesses and have poor growth. These children are more likely to have a lower intelligence quotient which affects academic success [8].
Anemia and underweight show a significant association confirming that the two diseases should be considered interrelated health problems in children where these diseases are more likely to coexist and inter influence their manifestations. Thus, coordinated interventions aiming to improve both underweight and anemia are likely to produce synergetic effects on child health. Underweight can also lead to anemia or a deficiency in essential vitamins. A child who is underweight is more likely to have low blood cell counts, known as anemia [9]. Anemia and underweight remain major health problems worldwide, especially in developing countries. These conditions intersect and are linked to morbidity and mortality worldwide, particularly in under-five children [10].
According to the WHO report for under-five children, the threshold Hemoglobin (Hb) level for being anemic is less than 11 g/dl [1]. Anemia is an indicator of both poor nutrition and poor health. The health implication of anemia is numerous. It is associated with impaired mental, physical, motor, and language development; and poor cognitive skill, coordination, scholastic achievement, and immune function. In addition, the outcomes of anemia can be considered from a variety of perspectives, including detrimental impacts on economic and social development [12]. According to a WHO report in 2020, there were 85.4 million underweight children around the world, from this, Asia accounts for 49% and Africa contains 31% [13].
In the African region, 59.3% of under-five children were anemic [14]. It is one of the major health challenges in Sub-Saharan African countries, affecting more than 40% of children, and is considered as a severe public health issue in the country [15,16].
Ethiopian is one of the African countries suffering from Anemia and under-weight of under-five children [17]. The burden of malnutrition in under-five children remains an important child health issue where significant regional variations are observed in Ethiopia [18]. Currently, Ethiopia plan to reduce children’s under-nutrition, but no significant improvement due to multidimensional and complex factors [19]. Yearly under-nutrition is a cause of 24% of child mortality [20].
Many studies have been conducted previously about anemia and underweight of children separately. Some of the studies are region wide and some are zonal level and did not give country level prevalence and covariates associated with the two response variables. Such studies are fragmented and difficult to develop country wide policy issues. The country level information related to the two basic issues may be important for policy makers. Therefore, the main objective of current study was to investigate the spatial prevalence of underweight and anemia in the country and covariates associated with the two responses. This study also aimed to assess whether the covariates affected the two responses in developed country also affecting in developing countries like Ethiopia.
Description of study area
The study area for the current study was in Ethiopia. It is located at 3 degrees and 14.8 degrees’ latitude, 33 degrees and 48 degrees’ longitude in the Eastern part of Africa laid between the Equator and the Tropic of Cancer. The country features a high central plateau that varies in elevation from 4550 meters above sea level to 110 meters below sea level, and the land covers 1.1 million square kilometers. It is bordered with Eritrea to the North, Djibouti, and Somalia to the East, Sudan, and South Sudan to the West, and Kenya to the South.
Based on the statistical report conducted in 2012, Ethiopia is administratively fragmented into nine regions and two city administrations, consisting of 74 zones, 817 woredas, and 16,2530 kebeles which are the smallest administrative divisions. The country contains more than 80 ethnic groups and many languages. Ethiopia has an estimated population of 114,963,588 with nine regions and two city administrations.
Source of data and study population
The data source for EDHS 2016 in this study can be obtained https://dhsprogram.com/Data/terms-of-use.cfm. The data were collected by the Central Statistical Agency (CSA) at the request of the Federal Ministry of Health (FMoH). Data collection took place from January 18, 2016, to June 27, 2016. The EDHS was carried out every five years to provide health and health-related indicators at the national and regional levels in Ethiopia. The study population was under–five children living in Ethiopia.
Sampling technique and sample size determination
A community-based cross-sectional study design was conducted across the country. Stratified random sampling technique was used considering the urban and rural areas as strata. The enumeration areas were selected independently where two-stage sampling approaches were conducted in each stratum. In the first stage, a total of 645 Enumeration Areas (EA) (202 in urban areas and 443 in rural areas) were selected with probability proportional to EA size (based on the 2007 population census). A household listing operation was carried out in all of the selected EAs. The resulting lists of households served as a sampling frame for the selection of households in the second stage. In the second stage of selection, a fixed number of 28 households per cluster were selected with an equal probability of systematic selection from the newly created household listing.
The survey included a total of 18,008 selected household samples, and in these households, 9,504 under-five children were found. However, only about 8439 of them satisfied the inclusion criterion.
Inclusion/exclusion criteria: In this study, under-five children who had recorded hemoglobin level and anthropometry measurements were included. Whereas, children with no recorded hemoglobin level, no anthropometry measurement, no maternal or household data and under-five children with missing values were excluded.
Variables under study
The response variables in this study were anemia and underweight status of under-five children.
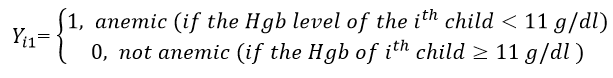
Anemia status was determined based on hemoglobin concentration in the blood adjusted to the altitude. This was dichotomized as anemic and not anemic. Individuals considered to be not anemic were defined as the adjusted concentration of blood hemoglobin greater than or equal to 11 g/dl and those individuals with less than 11 g/dl were anemic. Underweight was measured by weight for age Z-score. Weight and age measurements of children were converted into Z-scores based on the National Center for Health Statistics (NCHS) reference population recommended by the WHO, which is dichotomized into “Yes=1” if the children's WAZ was <-2 SD in the WHO growth curve and “No=0” if the WAZ is >= -2 SD.
Let Yij be the two response variables for the current study, where i=1, 2, 3,…….., n and j=1,2, then
The predictors included under this investigation were age in month, sex of child, no of children per household, birth order, weight at birth, birth type (single, twin), breast feeding status, diarrhea status, cough status, maternal age, maternal BMI, family size, education level of parents, wealth index, residence area, access of drinking water, access of toilet and region of a child. The categories of each qualitative data are indicated in Table 1.
Variable selection
Variable selection was conducted using step-wise selection method that starts from a model that contains all variables under consideration and then starts removing the least significant variables one after the other until a pre-specified stopping rule is reached or until no variable is left in the model.
Data analysis
Different statistical techniques have been used in the analysis of the collected data depending up on the nature of responses. Hence, descriptive and inferential statistics were used in data analysis of the current study. Descriptive measures were used to summarize the characteristics of the study participants using tables, graphs, weighted frequencies, and percentages. The Chi-square test statistics were employed using the SPSS version 25 to evaluate the association between each dependent variable and the explanatory variables. In this study, SAS version 9.4 with PROC GLIMMIX with LAPLACE approximation and ArcGIS version 10.8 software’s were used.
Spatial analysis
Spatial analysis is a statistical method that is useful to specific geographical areas with high or low rates of events occurrence and variability over the zone, region, or country. To provide accurate and meaningful conclusions based on the analysis, statistical methods of spatial data analysis must take the spatial arrangement and the resulting correlations of observations into account.
Spatial autocorrelation
In spatial analysis, the special autocorrelation between areas was conducted using global Moran’s I and local Moran’s I. Global Moran’s I quantify the spatial autocorrelation as a whole, whereas Local Moran’s I measure the degree of spatial autocorrelation at each specific location. Global Moran's I was applied to measure spatial autocorrelation related to feature locations and feature values simultaneously.
The value of Global Moran’s I ranges from −1 to 1. Moran’s I value close to -1 indicates the spatial distribution of anemia and the underweight pattern is dispersed, whereas Moran’s I value close to +1 indicates the spatial distribution of anemia and underweight pattern are clustered, and Moran’s I value of 0 means anemia and underweight pattern are distributed randomly.
Hotspot analysis (Getis-Ord Gi*)
The Getis-Ord Gi* hot spot analysis was used to identify spatial clusters of high values (hot spot) and a spatial cluster of low value (cold spot). Hotspot analysis was conducted to determine how the spatial distribution of anemia and underweight varies across Ethiopian administrative zones.
Spatial interpolation
Geo-statistical approaches such as kriging and ordinary Kriging were used for spatial interpolation in the current study.
Logistic regression analysis
Since the natures of response variables were dichotomous in nature, a binary logistic regression model was used for identifying predictors of the two variable of study. The random component for the (success, failure) outcomes has a binomial distribution, and also the link function is the logit function log [π/(1−π)] of π, symbolized by “logit (π).” Logistic regression models are often called logit models. Whereas π is restricted to the 0–1 range, the logit can be any real number.
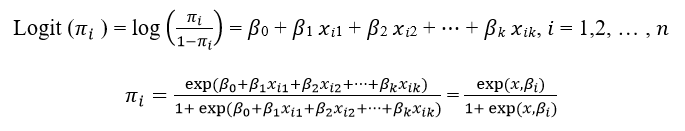
where: β′ is the regression coefficient for the explanatory variables.
The odds and odds ratios
Logistic regression utilizes odds and Odds Ratio (OR) associated with each predictor value of the variable. The odds are defined as the ratio between the probability of the occurrence of an event and the non-occurrence of an event, whereas the odds ratio is the ratio of two odds. This odds ratio measures the association of each outcome with independent variables.
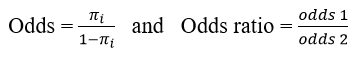
The odds ratio is an estimate of the risk of an exposed group relative to a control group or unexposed (reference) group. An odds ratio of less than 1 indicates a negative relationship, an odds ratio greater than 1 indicates a positive relationship and an odds ratio=1 indicates a difference between the exposed and control group.
Bivariate binary logistic regression
Bivariate Binary Logistic Regression (BBLR) is one of the families of multivariate logistic regression models and it is used to model the relationships between two correlated binary responses with one or more covariates. Let Y1 and Y2 be two bivariate binary responses and y=[Y11 Y10 Y01 Y00]T be a vector of responses. The elements of y have the probabilities of π11, π10, π01, and π00, respectively.
Method of parameter estimation
The most commonly used method of estimating the parameters of a logistic regression model is the method of Maximum Likelihood (ML).
In logistic regression, the likelihood equations are a non-linear explicit function of unknown parameters. The ML method seeks to maximize the log-likelihood, LL, which reflects how likely it is (the odds) that the observed values of the outcome may be predicted from the observed values of the predictors.
Goodness of fit test
The measure of goodness of fit test indicates how well the model fits the data. In logistic regression analysis after fitting the model, the adequacy of the model should be checked. There are many ways to test the goodness of fit, such as deviance, and Pearson Chi-square test. Deviance is introduced with GLM to measure the goodness of fit for a model.
Descriptive results
Table 1 indicates the frequency distribution of each predictor over the status of child anemia conditioned on underweight. The frequency distribution in Table 1 indicates that about 92.8% were children aged from 12-59 months and the rest were under one-year age. The proportion of underweight and anemic children was higher among the number of under-five children living in the household was 2 and less as compared to 3 and above under-five children living in the household (80.6% vs. 19.4%). The percentage of child anemia and underweight status also differs with birth order of children; a higher percentage of anemia and underweight was found for the child who has 4 and above birth order 761 (55.1%) and a lower percentage was found the child who has first birth order 213 (15.4%). The highest proportion of underweight and anemic children was observed among children whose mothers and fathers have no education as compared to those who have an education. On the other hand, lowest proportion of underweight and anemic children was observed among children whose mothers and fathers have secondary and above education levels. Moreover, children from poor household wealth index had the highest proportion of having both anemia and underweight status as compared to children who have rich and middle household wealth index. The majority of children who have both anemia and underweight status lived in rural as compared to urban which is 1296 (93.9%) vs. 84 (6.1%). The proportion of child anemia and underweight status who have unimproved toilet facilities was higher as compared to those who have improved toilet facilities, which is 1289 (93.5%) vs. 90 (6.5%). The proportion of children who are anemic and underweight was about 649 (47.0%), 258 (18.7%), and 248 (18.0%) were from Oromo, SNNPR, and Amhara respectively.
| Independent variables | Categories | No U and No A frequency (%) | No U and A frequency (%) | U and No A frequency (%) | U and A frequency (%) |
| Age of child in months | -11 | 202 (7.2) | 644 (18.5) | 24 (3.1) | 128 (9.3) |
| 12-59 | 2617 (92.8) | 2830 (81.5) | 741 (96.9) | 1252 (90.7) | |
| Sex of child | Male | 1426 (50.6) | 1754 (50.5) | 427 (55.7) | 767 (55.6) |
| Female | 1393 (49.4) | 1722 (49.5) | 339 (44.3) | 613 (44.4) | |
| The number of U5C live in the hh | 1-2 | 2439 (86.5) | 2821 (81.2) | 665 (86.9) | 1112 (80.6) |
| 3 and above | 380 (13.5) | 655 (18.8) | 100 (13.1) | 267 (19.4) | |
| Birth order of the child | First | 536 (19.0) | 614 (17.7) | 119 (15.6) | 213 (15.4) |
| 2-3 | 912 (32.4) | 1075 (30.9) | 227 (29.7) | 406 (29.4) | |
| 4 and above | 1371 (48.6) | 1786 (51.4) | 419 (54.8) | 761 (55.1) | |
| Size of a child at birth | Large | 992 (35.2) | 1220 (35.1) | 179 (23.4) | 370 (26.8) |
| Average | 1263 (44.8) | 1435 (41.3) | 335 (43.7) | 523 (37.9) | |
| Small | 564 (20.0) | 821 (23.6) | 252 (32.9) | 486 (35.2) | |
| Type of birth | Single | 2767 (98.2) | 3417 (98.3) | 719 (94.0) | 1328 (96.3) |
| Multiple | 52 (1.8) | 58 (1.7) | 46 (6.0) | 51 (3.7) | |
| Breastfeeding | No | 1067 (37.9) | 1013 (29.1) | 248 (32.4) | 419 (30.4) |
| Yes | 1752 (62.1) | 2463 (70.9) | 517 (67.6) | 960 (69.6) | |
| Had diarrhea in the last two weeks | No | 2508 (89.0) | 3045 (87.6) | 656 (85.8) | 1142 (82.8) |
| Yes | 311 (11.0) | 430 (12.4) | 109 (14.2) | 237 (17.2) | |
| Had fever in the last two weeks | No | 2468 (87.5) | 2925 (84.1) | 664 (86.7) | 1103 (79.9) |
| Yes | 351 (12.5) | 551 (15.9) | 102 (13.3) | 277 (20.1) | |
| Had a cough in the last two weeks | No | 2264 (80.3) | 2722 (78.3) | 616 (80.4) | 1075 (78.0) |
| Yes | 555 (19.7) | 754 (21.7) | 150 (19.6) | 304 (22.0) | |
| Age of mothers | 15–24 | 517 (18.3) | 797 (22.9) | 132 (17.2) | 308 (22.3) |
| 25–34 | 1516 (53.8) | 1908 (54.9) | 407 (53.1) | 740 (53.7) | |
| 35–49 | 785 (27.9) | 770 (22.2) | 227 (29.6) | 331 (24.0) | |
| Mothers marital status | Others | 190 (6.7) | 198 (5.7) | 30 (3.9) | 100 (7.3) |
| Married | 2629 (93.3) | 3278 (94.3) | 735 (96.1) | 1279 (92.7) | |
| Body mass index of the mother | Underweight | 505 (17.9) | 733 (21.1) | 190 (24.8) | 361 (26.2) |
| Normal | 2109 (74.8) | 2530 (72.8) | 560 (73.1) | 970 (70.3) | |
| Overweight | 205 (7.3) | 212 (6.1) | 16 (2.1) | 48 (3.5) | |
| Mother education | No education | 1770 (62.8) | 2237 (64.4) | 575 (75.1) | 1072 (77.7) |
| Primary | 806 (28.6) | 1028 (29.6) | 172 (22.5) | 267 (19.3) | |
| Secondary and above | 243 (8.6) | 211 (6.1) | 19 (2.5) | 41 (3.0) | |
| Wealth index of the household | Poor | 1062 (37.7) | 1641 (47.2) | 406 (53.0) | 845 (61.3) |
| Middle | 641 (22.7) | 733 (21.1) | 194 (25.3) | 246 (17.8) | |
| Rich | 1116 (39.6) | 1101 (31.7) | 166 (21.7) | 288 (20.9) | |
| Residence | Urban | 390 (13.8) | 339 (9.8) | 44 (5.8) | 84 (6.1) |
| Rural | 2430 (86.2) | 3136 (90.2) | 721 (94.2) | 1296 (93.9) | |
| Source of drinking water | Improved | 1603 (56.9) | 1940 (55.8) | 423 (55.3) | 714 (51.8) |
| Unimproved | 1216 (43.1) | 1535 (44.2) | 342 (44.7) | 665 (48.2) | |
| Toilet facility | Improved | 296 (10.5) | 339 (9.8) | 46 (6.0) | 90 (6.5) |
| Unimproved | 2523 (89.5) | 3136 (90.2) | 719 (94.0) | 1289 (93.5) | |
| Region/Administrative city | Tigray | 200 (7.1) | 233 (6.7) | 63 (8.2) | 75 (5.4) |
| Afar | 15 (0.5) | 36 (1.0) | 6 (0.8) | 25 (1.8) | |
| Amhara | 692 (24.5) | 456 (13.1) | 259 (33.9) | 248 (18.0) | |
| Oromia | 1021 (36.2) | 1792 (51.6) | 247 (32.3) | 649 (47.0) | |
| Somali | 44 (1.6) | 190 (5.5) | 13 (1.7) | 90 (6.5) | |
| Benishangul | 35 (1.2) | 21 (0.6) | 16 (2.1) | 18 (1.3) | |
| SNNP | 715 (25.3) | 641 (18.4) | 155 (20.3) | 258 (18.7) | |
| Gambela | 7 (0.2) | 8 (0.2) | 1 (0.1) | 3 (0.2) | |
| Harari | 4 (0.1) | 8 (0.2) | 1 (0.1) | 2 (0.1) | |
| Addis Ababa | 81 (2.9) | 75 (2.2) | 2 (0.3) | 4 (0.3) | |
| Dire Dawa | 7 (0.2) | 15 (0.4) | 2 (0.3) | 8 (0.6) |
Table 1. Description of variables under study.
Spatial analysis
Spatial distribution of anemia and underweight: In this study, about 69 administrative zones were used from EDHS 2016 to analyze the spatial distribution of the status of child anemia and underweight and the rest three couldn’t be used due to the data on anemia and underweight status was not collected among those zones. Each point on the map was characterized by the prevalence of anemia and underweight in each zone. The green color indicates the zones with a low distribution of anemia and underweight, whereas the red color indicates zones with a high distribution of anemia and underweight (Figure 1).

Figure 1. Spatial distribution of anemia (left) and underweight (right) in Ethiopian administrative zones.
Spatial interpolation of anemia and underweight: Spatial kriging interpolation analysis was used to predict the prevalence of anemia and underweight for un-sampled areas (zones) based on sampled areas (zones). Using the ordinary kriging interpolation technique, the red color on the map indicates the predicted highest prevalence of anemia and underweight, whereas the green color on the map indicates the lowest predicted prevalence of anemia and underweight. According to the 2016 EDHS data set, Oromia Zone was predicted to have more prevalent zones of anemia among under-five children as compared to other zones, whereas Awi, West Wellega, West Harerghe, Welwel and Warder, Yem Special Woreda, Dawuro and Burji Special woreda were predicted to have less prevalent zones of anemia. Likewise, Zone 3AF and Konta Special Woreda were predicted to have more prevalent zones of underweight among underfive children as compared to other zones, Whereas Oromia Zone and Yem Special Woreda were predicted to have less prevalent zones of underweight (Figure 2).

Figure 2. Kriging interpolation of children’s anemia (left) and underweight (right) in Ethiopia from EDHS-2016.
Spatial autocorrelation analysis of anemia and underweight: Moran’s I index measures the spatial autocorrelation, this index allows for detecting whether or not the risk of anemia and underweight in a given zone were similar to the neighboring zone. The estimated global Moran’s indexes in this study were -0.012288 and -0.025832 for anemia and under-weight respectively, which indicates that the spatial distribution of anemia and underweight are random in Ethiopian administrative zones. Moran’s I p-values result for anemia and underweight were 0.956670 and 0.801798 respectively, which are both greater than 0.05. Hence, the Global Moran’s test revealed that there is no spatial autocorrelation in the risk of anemia and underweight among under-five children between zones (Figure 3).

Figure 3. Spatial autocorrelation analysis for children’s anemia (left) and underweight (right), in Ethiopia (EDHS-2016).
Model fitting and parameter estimation: Before fitting the model, Chi-square test statistics and multicollinearity should be executed for the data to explore the relationship between the dependent variables and each categorical independent variable. Multicollinearity mainly can be detected with the help of tolerance and its reciprocal Variance Inflation Factor (VIF). Values of VIF exceeded 10 referred as multicollinearity and this further indicates that no multicollinearity problem. Variables such as child age, sex of children, size of child at birth (birth weight), number of under-five children living in the household, birth type, fever, father education level, occupation status of the mother, wealth index, and region were entered into the model by the stepwise variable selection method of 15% significance level for entry and 20% significance level for stay.
Goodness of fit test and diagnostic test: Before making inference about population using a fitted model, it is necessary to determine whether the fitted model describes the data well. The Pearson Chisquare over the degree of freedom for the bivariate binary logistic regression model was 1.09. This is close to one, indicating that the variability in the outcomes was modeled properly and there is no under-dispersion and over-dispersion. Therefore, the model fitted the data well.
Bivariate binary logistic regression analysis: Table 2 shows the joint and marginal probabilities of anemia and underweight. The Odds Ratio (OR) is a natural measure used to describe the association between the two binary responses and a value of unity denotes statistical independence. In this study, the Odds Ratio (OR) was greater than one (1.461) or different from unity, which indicates that there was dependency between the two outcomes.
| Anemia status | Marginal of underweight (%) | Odds Ratio (OR) | |||
| Not anemic (%) | Anemic (%) | ||||
| Underweight status | Not underweight | 2819 (0.34) | 3475 (0.41) | 6294 (0.75) | 1.461 |
| Underweight | 766 (0.09) | 1379 (0.16) | 2145 (0.25) | ||
| Marginal of anemia (%) | 3585 (0.43) | 4854 (0.57) | 8439 (1) | ||
Table 2. Joint and marginal probability of anemia and underweight of under-five children in Ethiopia.
After the dependency between anemia and underweight was checked the effect of each predictor on anemia and underweight was identified. Then, using predictors the odds ratio becomes 3.617. This differs from unity, which means there was a dependency between outcomes with the effects of predictors. Therefore, the bivariate logistic regression analysis of anemia and underweight with other predictors was presented (Table 3).
| Variables | Anemia | Underweight | ||||
| Estimate (SE) | AOR | 95% CI for AOR | Estimate (SE) | AOR | 95% CI for AOR | |
| Intercept | 1.490 (0.135)** | 4.436 | 1.226, 6.754 | -0.976 (0.149)** | 0.377 | 0.268, 0.683 |
| Age of child (Ref. <=11 months) | ||||||
| Dec-59 | -0.422 (0.093)** | 0.656 | 0.305, 0.839 | 0.575 (0.106)** | 1.778 | 1.567, 1.983 |
| Sex of child (Ref.=Male) | ||||||
| Female | -0.071 (0.048) | 0.931 | 0.764, 0.982 | -0.262 (0.052)** | 0.769 | 0.565, 0.959 |
| Number of U5C in the hh (Ref.=1-2) | ||||||
| 3 and above | 0.187 (0.068)** | 1.206 | 1.055, 1.620 | -0.096 (0.073) | 0.909 | 0.738, 1.047 |
| Size of a child at birth (Ref.=Small) | ||||||
| Average | -0.192 (0.061)** | 0.825 | 0.510, 0.873 | -0.443 (0.063)** | 0.642 | 0.567, 0.820 |
| Large | -0.150 (0.064)* | 0.861 | 0.676, 0.923 | -0.701 (0.069)** | 0.496 | 0.337, 0.666 |
| Birth type (Ref.=Single) | ||||||
| Multiple | -0.353 (0.154)* | 0.703 | 0.554, 0.952 | 0.079 (0.153)** | 1.082 | 1.009, 1.278 |
| fever (Ref.=No) | ||||||
| Yes | 0.249 (0.068)** | 1.283 | 1.117, 1.382 | 0.355 (0.071)** | 1.426 | 1.216, 1.494 |
| Parent education (Ref.=No education) | ||||||
| Primary | -0.099 (0.053) | 0.906 | 0.202, 1.005 | -0.144 (0.057)* | 0.866 | 0.656, 0.932 |
| Seco. and above | -0.221 (0.088)* | 0.802 | 0.594, 0.949 | -0.413 (0.110)** | 0.661 | 0.619, 0.898 |
| Wealth index (Ref.=Poor) | ||||||
| Middle | -0.346 (0.062)** | 0.708 | 0.467, 0.924 | -0.337 (0.067)** | 0.714 | 0.469,0.906 |
| Rich | -0.371 (0.058)** | 0.69 | 0.486, 0.957 | -0.631 (0.067)** | 0.532 | 0.363, 0.710 |
| Region (Ref.=Tigray) | ||||||
| Afar | 0.091 (0.280)** | 1.095 | 1.043, 1.339 | 0.302 (0.258) | 1.353 | 1.204, 1.508 |
| Amhara | -0.419 (0.104)** | 0.658 | 0.622, 0.716 | 0.281 (0.116)* | 1.324 | 1.054, 1.508 |
| Oromia | 0.567 (0.097)** | 1.763 | 1.378, 1.956 | 0.009 (0.110) | 1.009 | 0.206, 1.223 |
| Somali | 0.387 (0.177)** | 1.473 | 1.141, 1.632 | 0.225 (0.162) | 1.252 | 0.093, 1.542 |
| Benishangul | -0.404 (0.239) | 0.668 | 0.872, 1.065 | 0.774 (0.246)** | 2.168 | 1.292, 3.256 |
| SNNP | -0.047 (0.102) | 0.954 | 0.247, 1.154 | 0.039 (0.117) | 1.04 | 0.191, 1.269 |
| Gambela | 0.262 (0.489) | 1.299 | 0.697, 1.221 | -0.125 (0.601) | 0.882 | 0.303, 1.053 |
| Harari | 0.661 (0.566) | 1.937 | 0.448, 1.771 | 0.031 (0.650) | 1.032 | 0.242, 1.305 |
| Addis Ababa | 0.061 (0.192) | 1.063 | 0.315, 0.438 | -1.681 (0.458)** | 0.186 | 0.079, 0.383 |
| Dire Dawa | 0.058 (0.420)* | 1.06 | 0.035, 1.681 | 0.354 (0.415) | 1.425 | 0.460, 1.168 |
| The measure of dependency odds ratio=3.617 | ||||||
| Note: : **p<0.01, *p<0.05 | ||||||
Table 3. Parameter estimation of bivariate binary logistic regression model of child anemia and underweight.
Table 3 revealed the effect of covariates on the status of anemia and underweight by taking into account the dependency of anemia and underweight using a bivariate binary logistic regression model. Among the predictors child age, size of child at birth (birth weight), birth type (child is a twin), fever, father education level, wealth index, and region were simultaneously statistically significant explanatory variables for both outcomes namely anemia and underweight. Whereas the number of under-five children living in the household and the mother’s occupation status were significant predictors only in terms of anemia. Sex of the child was significant predictor only in terms of underweight.
The expected odds of being anemic for children in age groups 12-59 months were decreased by 81.5% as compared to children with age group less than 12 months. On the other hand, the expected odds of being underweight for children in age groups 12-59 was 2.507 times more likely to be underweight as compared to age group of children less than 12 months, given the other conditions constant.
Sex of the child was also significant for the variation of underweight. Hence, comparing females with males, the expected odds of being underweight for females was 0.769 times that of male children, which reflects, the expected odds of being underweight for female children was decreased by 23.1% as compared to male children, keeping all other conditions constant.
The estimated odds of being anemic for under-five children with households having 3 and above children were 1.206 times those households having 2 or fewer children, given the other conditions constant.
Comparing average size and large size children at birth with small size children at birth, the expected odds of being anemic for average and large size children at birth were decreased by 17.4% and 13.9% respectively as compared to small size children. Similarly, the expected odds of being underweight for average and large size children at birth were decreased by 35.8% and 50.4% respectively as compared to small size children, given that the other condition is constant.
The expected odds of being anemic among under-five children with multiple births were 0.703 times those children with single birth. Whereas the expected odds of being underweight among under-five children who had multiple births were 2.661 times those children who had single birth, keeping all other conditions constant.
The expected odds of being anemic for those children with fever were increased by 28.3% as compared to children without fever. Similarly, the expected odds of being underweight for children with fever were increased by 42.6% as compared to children without fever, keeping all other conditions constant.
The expected odds of being anemic for children from secondary and above educated family were decreased by 20%as compared to children from non-educated families, keeping all other conditions constant. Likewise, the expected odds of being underweight for those children from secondary and above educated family were decreased by 34% as compared to those children from non-educated families, given that other conditions constant.
The other variable that was significant for the variables of interest was the wealth index. Hence, the expected odds of being anemic for children from middle and rich were decreased by 29.2% and 31% respectively as compared to children from poor families.
Similarly, the expected odds of being underweight for children from middle and rich families were decreased by 28.6% and 46.8% respectively as compared to poor families, keeping all other conditions constant.
In the current study, the overall prevalence of anemia among under-five children was 57.5% which is almost parallel to the EDHS report of 57%. Similarly, the overall prevalence of underweight among under-five children was 25.4%.
The spatial hot spot analysis evidenced that West Harerghe, South Gondar, East Gojam, Zone 3AF, Oromia zone, Zone 5AF, Shinile, Dire Dawa, Hundene and West Gojam administrative zones were a high-risk areas of anemia, and Awi administrative zone was a highrisk area of underweight.
This study also found that the prevalence of anemia and underweight among under-five children were significantly associated with age of children. As the ages of a child proceed from the lowest to the highest age group, the expected odds of being anemic is decrease. This result was consistent with other studies done by Safiri S, et al, Whereas, in the case of underweight, as the age group of the child increased, the risk of being underweight also increased. This finding is consistent with other studies. The possible justification might be due to the low concentration of iron in breast milk, which could be insufficient to meet daily iron requirements for breastfeeding children and this may contribute to anemia. And the increase in child underweight with age indicates the need for proper and timely initiation of complementary/supplementary feeding to meet the growing nutritional requirements of the children.
The number of under-five children in the HHs affects childhood anemia. Large number of children with in the given house hold leads for children being anemic as compared to a house hold with less number of children [14]. This finding is consistent with the studies conducted in Nepal, and another study conducted in Ethiopia [15]. This could be due to an increase in the number of children might lead to a risk of communicable disease transmission, and competition for food, consequently, nutritional deficiencies.
This study found that children who had average size and large size at birth are less likely to be anemic and underweight as compared to small size children. This result is similar to other studies on anemia and Belay DG, et al. on underweight.
The finding of this study showed that children with multiple births were more likely to be anemic as compared to children with single birth. This finding is contradicted with the study conducted [16]. The possible reason for this contradiction might be even if a mother gives birth to twins, if she has better economic resources and takes proper care of them, they may not experience any anemia. This result is consistent with the result reported by Nouri F, et al.
This study demonstrated that children experienced with fever were more likely to be anemic and underweight as compared to children without fever. This study was consistent with other studies conducted in Nepal, Ethiopia, and urban and rural communities in Tigray. This could be due to systemic infections in the body that might affect the hemoglobin level in the blood, and also this could be because infection adversely affects nutritional status and malnutrition affects the ability of the host to resist infection. For instance, fever increases the metabolic or energy needs of the child and interferes with a child’s ability to nurse or eat and hence reduces food intake so this might increase the likelihood of anemia and being underweight.
This study found that children from poor households are more likely to be exposed to both response variables namely anemia and underweight as compared to those children from rich households. This study was consistent with other studies conducted in Ethiopia, and another study conducted in Cape Verde on anemia; and a study conducted in Ghana and Debre Tabor town Amhara region of Ethiopia on underweight. The possible reason for this might be that communities with rich economic levels can provide basic needs such as clean water, medical care, and sufficient food/nutritional requirements needed for the proper health of children compared to those families with poor economic levels who are unable to provide the basic needs.
The odds of being underweight are higher for male children compared to female children. This finding is consistent with other studies. Whereas this finding is contradicted by the finding in the rural area of Kancheepuram district in Tamil Nadu, India, and Sodo Zuria district, south Ethiopia. The possible reason for this contradiction might be the sample size used for the investigation, study area, and study time.
Parents’ education is an important socioeconomic characteristic of anemia and underweight status; that is, the prevalence of anemia and underweight among under-five children in the country decreases as the parent's education level increases. This finding is consistent with the previous study done in Ethiopia on anemia; and Sodo Zuria district, south Ethiopia, and Debre Tabor town Amhara region of Ethiopia. The possible reason for this might be that educated parents are more likely to have a better understanding on the use of balanced diet, give attention to their children's health status and to have more knowledge about child caretaking. The result of this study revealed that women who were currently working had less likely to have anemic children. This finding is consistent with the previously conducted study.
The findings of this study indicated that child age, size of child at birth (birth weight), birth type, and existence of fever, education of father, wealth index, and region had significant effects on the two outcome variables anemia and underweight. In this study, there was a significant correlation between the two response variables namely anemia and underweight. The result of the global Moran’s I index showed that no autocorrelation among the administrative zones of Ethiopia. Children from poor households were more likely to be anemic and underweight.
Strategically accepted intervention should be conducted to reduce children's underweight and anemia. Hence, it is advisable that the implementation of child health-related programs, policies, and strategies established by the government would give special attention for those administrative zones with high prevalence of under-weight and anemia. Based on the finding of this study, both anemia and underweight were more probable in the poorest families. So, policymakers should prioritize initiatives that increase the special support of a household with low income to secure adequate food production. Thus, improving children’s nutritional status necessitates multifaceted initiatives such as poverty reduction and food security. Finally, further research is recommended to identify other factors that affect and contribute to anemia and underweight among under-five children.
The large size population based study conducted across the country in this study can be mentioned as one of the strengths of the current investigation. A bivariate analysis was also used to identify the risk factors affecting anemia and underweight simultaneously. This study was not without limitation. One of the limitations is that the data used was EDHS 2016 and hence the results may not necessarily reflect the current situation of Ethiopia in 2023. Important variables which may be important for current investigation are not included during data collection by central statistical association. Hence, this research recommends future researches with the inclusion of important variable related to underweight and anemia.
Authors acknowledged all the EDHS staffs for the data they supplied.
This study used secondary data collected by Ethiopian Demographic Health Survey. To use such secondary data, the Ethical review committee at EDHS gave permission to use it via the link; https://dhsprogram.com/Data/terms-of-use.cfm. Hence, the work reported in the manuscript was performed according to the national and international institutional rules concerning animal experiment, clinical studies and biodiversity rights.
This research did not receive any specific grant from funding agencies in the public, commercial, or not-from-profit sectors.
Authors declare that there is no conflict of interest between authors or between authors and institutions.
YDD contributed in developing the proposal, supervision of data collection and data analysis, AST participated in data analysis, writing the manuscript and editing the whole document.
The data used for the current investigation is available in hands of the corresponding author. For further information, the data used under current investigation are submitted to the journal as supplementary material.
[Crossref] [Google Scholar] [PubMed]
[Crossref] [Google Scholar] [PubMed]
[Crossref] [Google Scholar] [PubMed]
[Crossref] [Google Scholar] [PubMed]
[Crossref] [Google Scholar] [PubMed]
[Crossref] [Google Scholar] [PubMed]
[Crossref] [Google Scholar] [PubMed]
[Crossref] [Google Scholar] [PubMed]
[Crossref] [Google Scholar] [PubMed]
[Crossref] [Google Scholar] [PubMed]
[Crossref] [Google Scholar] [PubMed]
[Crossref] [Google Scholar] [PubMed]
[Crossref] [Google Scholar] [PubMed]
[Crossref] [Google Scholar] [PubMed]
[Crossref] [Google Scholar] [PubMed]
[Crossref] [Google Scholar] [PubMed]
[Crossref] [Google Scholar] [PubMed]
Journal of AIDS & Clinical Research received 5264 citations as per Google Scholar report