Mini-Review - (2022) Volume 12, Issue 5
Received: 01-Sep-2022, Manuscript No. jttr-22-78530;
Editor assigned: 03-Sep-2022, Pre QC No. P-78530;
Reviewed: 16-Sep-2022, QC No. Q-78530;
Revised: 19-Sep-2022, Manuscript No. R-78530;
Published:
26-Sep-2022
, DOI: 10.37421/2161-0991.2022.12.221
Citation: Koutsokera, Angela. “Mortality after Heart Transplantation and Fragility.” J Transplant Technol Res 12 (2022): 221.
Copyright: © 2022 Koutsokera A. This is an open-access article distributed under the terms of the Creative Commons Attribution License, which permits unrestricted use, distribution, and reproduction in any medium, provided the original author and source are credited.
Frailty, a state of susceptibility and deterioration in function across several physiological bodily systems, is becoming recognised as a useful criterion to help clinicians forecast the likelihood of unfavourable outcomes in adult transplant candidates. The International Society for Heart Lung Transplantation proposes frailty testing in its listing criteria for heart transplantation from 2016. We set out to compile information on the value of frailty assessment in heart transplant candidates or recipients that has been published in the literature.
Lung transplantation outcomes • Cystic fibrosis • Frailty
Age-related frailty is a state of increased susceptibility to negative outcomes. The deficit accumulation/frailty index and the frailty phenotype are the two most common frailty metrics. The phenotype analyses frailty categorically by evaluating five criteria (unintentional weight loss, tiredness, low grip strength, slow walk speed and low physical activity) that are either selfreported or evaluated prospectively. A frailty index (FI) calculates a continuous score by counting health deficiencies (such as symptoms, signs, comorbidities, disabilities and laboratory values); higher values signify a higher degree of frailty. The ratio of actual deficits to those estimated for a particular person is used to calculate the FI. With more factors included in the FI, estimates become more accurate. By using this method, deficits are not given any weight in the FI and frailty can be viewed as a network in which the destruction of connecting nodes (representing deficits) increases the likelihood of further destruction [1].
Particularly in older persons, the FI shows a dose-response connection with mortality. Its relevance in predicting mortality in younger people is uncertain, probably because to their typically low death rate. We currently know very little about frailty's prevalence and effects in CF. An examination of the frailty phenotype was done on a small number of CF LT recipients. Frailty improvements, as measured by the Short Physical Performance Battery, were linked to reduced disability and enhanced quality of life. Although the frailty phenotype in LT candidates has been assessed in certain publications, there is no study that is CF-specific. In a study of 144 candidates for LT (2 had CF), it was found that a FI > 0.25 was linked to lower post-LT survival. Our team found people at risk for negative outcomes when using the FI in solid organ transplant candidates, including 28 patients with CF. The creation of frailty assessment tools has recently received support in consensus reports as a potential future line of inquiry for transplantation studies [2].
We postulated that, while LT would ameliorate pulmonary impairment, increased frailty and social/lifestyle vulnerability would have a negative impact on post-LT outcomes. The FI could incorporate the numerous factors commonly examined during CF and LT evaluation to estimate risk. Our goal was to create a FI that was particular to CF in order to risk-stratify CF patients who were designated for LT and to evaluate this method using a different cohort. This retrospective cohort study included adult CF patients who were listed in 2 separate cohorts: the Toronto LT Program between 2005 and 2015; and the Swiss LT centres (Zurich University Hospital and the Centre Universitaire Romand de Transplantation including Lausanne University Hospital and Geneva University Hospitals) between 2008 and 2017. Retransplantation and multi-organ transplantation were disqualifying factors at study admission. The Adult CF Center database, the Toronto LT Program database and clinical charts were used to retrieve the data. Patient records and the Thoracic Surgery Division database at Lausanne University Hospital were used to retrieve information about Swiss LT centres. Everyone had given their signed, informed agreement for the use of their information in research. The regional ethics committees gave their approval to the protocol [3].
Based on prior studies, a cut-off of the FI0.25 was adopted to determine frailty for descriptive statistics. The FI was treated as a continuous variable in all other analyses. To evaluate relationships between the indices, Spearman's correlation was used. The Mann-Whitney test and Spearman's correlation were used, respectively, to assess the association between each indicator and age and sex. The connection between the listing status and the indices was examined using the Kruskal-Wallis test. Kaplan-Meier graphs were used to summarise post-transplant survival. We calculated hazard ratios (HR) and 95% confidence intervals using univariate and multivariable Cox proportionalhazards models (CI). Martingale and Schoenfeld residuals were used to graphically evaluate the Cox proportional-hazards model's linearity and proportional hazards assumptions. Age at listing, sex and length of waitlist period were taken into account in the multivariable analyses (a) for each index and (b) for the entire model including all indices. To make it easier to understand the HR, each index was multiplied by 10 for these studies (i.e. hazard for every 0.1 unit increase in the LI, FI or LSVI). A sensitivity analysis for post-LT mortality limited to Burkholderia cepacia complex (BCC) negative individuals was also carried out in the Toronto cohort.
All analyses' overall survival was evaluated. a time-dependent ROC curve, an area under the curve, sensitivity, specificity, negative predictive value (NPV) and positive predictive value (PPV) after six months, one year, three years and five years following the LT The timeROC package in R was used to adjust for the data's filtered nature (version 0.4). Although Youden's index yielded a number close to the median, it was thought to indicate the ideal cut-point. Therefore, the median was chosen as the ideal cut-point for both cohorts in order to maintain uniformity. We present the receiver operating characteristic curves' area under the curves [4]. ICU and hospital stay durations were modelled using linear regression techniques. To reduce the variance, the length of the hospital stay was log-transformed. Since the time-point of the status change was unavailable, the waitlist's worsening state was modelled using logistic regression as a binary outcome. All p values are 2-sided and significance is determined at p 0.05. R version 3.3.0 was used to conduct the analyses [5].
FI risk categorization was strongly correlated with waitlist and post-LT outcomes in CF patients designated for LT. Understanding how frailty and deficit accumulation affect survival can be learned by studying frailty in young people with advanced disease.
None.
The author shows no conflict of interest towards this manuscript.
Google Scholar, Crossref, Indexed at
Google Scholar, Crossref, Indexed at
Google Scholar, Crossref, Indexed at
Google Scholar, Crossref, Indexed at
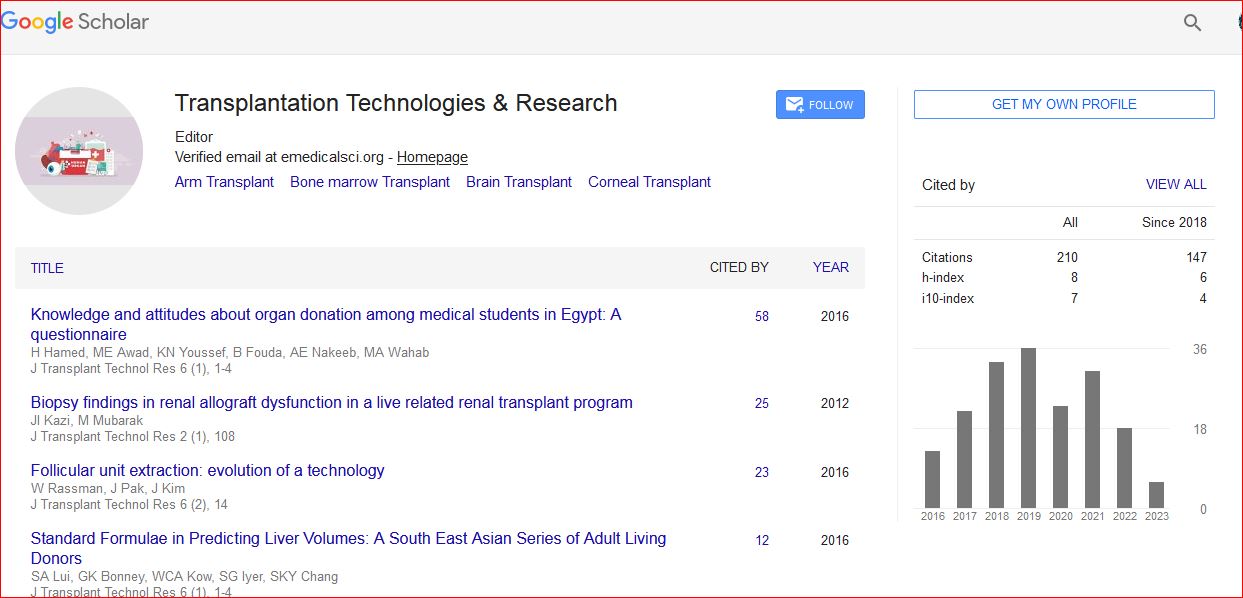
Transplantation Technologies & Research received 223 citations as per Google Scholar report