Research Article - (2022) Volume 10, Issue 4
Received: 01-Aug-2022, Manuscript No. jreac-22-70912;
Editor assigned: 03-Aug-2022, Pre QC No. P-70912;
Reviewed: 16-Aug-2022, QC No. Q-70912;
Revised: 22-Aug-2022, Manuscript No. R-70912;
Published:
30-Aug-2022
, DOI: 10.37421/2380-2391.2022.9.383
Citation: Ahmad, Kafeel, Zafar Iqbal Khan, Shamayem Aslam
and Sahar Monsoor, et al. “Lead and Zinc Evaluation in Cows Feeding on Forage
and Fodder Grown in Soil Contaminated with Waste Water in Sargodha, Pakistan.” J
Environ Anal Chem 9 (2022): 383.
Copyright: © 2022 Ahmad K, et al. This is an open-access article distributed under the terms of the creative commons attribution license which permits unrestricted use, distribution and reproduction in any medium, provided the original author and source are credited.
Three Tahsil; Jhanwarian, Sahiwal and Silanwaali of district Sargodha, Pakistan were selected for this project. Municipal waste water was used for irrigation to grow forages and fodder. The main target of this study comprises the assessment of Lead and Zinc in fodder and forage crops. Furthermore, the soil in which the forages are grown up was also appraised to acquire pollution load index. The concentration of Lead and Zinc was assessed in cows nurturing on the fodder being irrigated by wastewater. Concentrations of Lead and Zinc in fodder samples were found in the range from 9.50 mg kg-1 to 14.14 mg kg-1 and 16.49 mg kg-1 and 8.60 mg kg-1 respectively. The allowable limit level for Lead in plants is 3.0 ppm while the concentration of Lead in this study were found more than that limit (Allen, 1989). On the other hand, the concentration of Zinc was found within limit as prescribed by WHO; 50 mg/kg (2018). The concentration of Lead in wastewater was found in wide-ranging between 0.09-0.45 mg/L and zinc 3.41-5.83 mg/L. The levels of Lead in water were found to be higher than the WWF-recommended safe limit (0.10) (2007). Concentration of Lead and Zinc in soil varied between 10.11 mg kg-1 to 13.85 mg kg-1 and 27.76 mg kg-1 to 37.25 mg kg-1 respectively. In the blood of cows, the mean concentrations of Lead were found to be 0.136-1.918 mg kg-1 and concentration of Zinc was 0.136-1.918 mg kg-1. Pollution load index value of Lead and Zinc ranged between 1.25 to 1.69 and 1.25-1.699 respectively. Bio concentration factor of Lead and Zinc were found to be in the range from 0.82 to 1.12 and 0.25 to 0.54 respectively. DIM of Lead and Zinc ranges between 0.01615-0.024 and 0.0145-0.028 respectively. (2.25-3.0) and (0.024-0.016) values were measured for enrichment factor of Lead and Health risk index separately. Enrichment factor and health risk index of Zinc ranges between (0.1100-0.1811) and (0.0465-0.0934) respectively.
Lead • Zinc • Wastewater • WWF • Cows • Bio concentration factor
AAS: Atomic Absorption Spectrophotometer • DIM: Daily Intake of Metals • PDTI: Provisional Tolerable Daily Intake • HRI: Health Risk Index
Contaminated water is mostly used for irrigation of farmlands. It is possible that the irrigation causes the spread of pollutants in the polluted groundwater to the crops which are being irrigated by this water. In this way, arsenic and other heavy metals are absorbed by the crop and transfer to the forgers and fodders for animals through such contaminated water [1].
Industrial liquid wastes are the strong components which are responsible to pollute the water. The waste run-offs released by different industries have greater values of physico-chemical parameters, for example heat, electrical conductivity, rigidity, alkaline or basic properties, COD nitrates and elements like sodium, potassium and magnesium.
This waste water also comprises of noteworthy extent of heavy metals like cobalt and arsenic etc. [2]. Among these heavy metals some are helpful and some are not needed for crops growth and development but right after their accumulation in the soil these metals are easily transported to food chain that is from crops to animals to humans [3].
Normally, farmers do not have any awareness regarding the toxicity of metals and their ions. They do not have any idea and information that these metals can introduce toxicity to the crops being grown in such contaminated water [4].
If the metals percolate down the soil, they can also pollute ground water under the soil [5]. The farmers in the villages mostly use the water from boreholes that are being tunneled and dug near the drain that has exposure to the contamination through leakage. Due to rapid increase in water scarcity for agricultural land, framers must have to find a way to irrigate the crops.
As the volume of contaminated water is increasing in drains, farmers nearby these gutters find it appropriate to use this easily available and cost less water for the irrigation of their fields. When this unprocessed water is used for irrigation purpose, this water leaches into the topsoil and enables the access of a large number of diseases, causing organisms as well as heavy metals into the food chain. Forage, fodder and other yields developed with such contaminated water could also have elevated levels of heavy metals which may be reason of many infections when used up by persons and animals [2].
Ailments associated with deficiency of metals have been extensively recognized and some of those are disease of white muscle, reduced reproduction rate, reduced growth and impaired immunity etc [6]. The content of metals in forages, soil and muscles of animals can be used as analytical tools to find out the heavy metal status in grazing animals [7].
An adequate amount of metals is necessary to escape oxidative damages to numerous membranes due to different types of free radicals in the body of animals. Insufficiency of metals in the animals accelerates the weakening of various parts of body of the livestock animals [8]. Live-stock nurturing is one of the significant segments of agriculture in those countries in which agricultural sector plays a very important role in their economy [9]. It shows a prominent part in holding source of revenue of countryside populations through establishment of foodstuff, raw materials and income in the form of cash, and it also donates in the rural progress too [10].
The description that can properly define a ‘toxic heavy metal’ is not clear at all. In several writings, those metals which have a weight of >4 or 5 g/l are known as heavy metals. Though, due to this meaning of heavy metals some chemically different compounds like lanthanides and actinides will also become the part of heavy metals as they have density falling in this range. Mostly Nieboer & Richardson (1980) classification of heavy metals is considered by scientists.
It has three classes of elements i.e. A, B and borderline class, having a density of >5 g/l. Compounds of A Class consist of ligands with O. (for example: Manganese’s density is 7•42 g/l). Elements of B class consist of ligands containing N or S (for example: Cadmium has 8•65 g/l density). Elements of borderline class have in-between nature between first two classes i.e.: A and B. The chemical grouping of ‘heavy toxic metals’ into these classes depends significantly on their densities and physical and chemical properties.
In grazing animals Cadmium and lead are likely to be accumulated in the liver and kidneys of animals, and often (example; lead) accumulates in bone. Various elements hinder the crucial reactions of enzymes and function of vital organs and that’s why these elements have potential toxicity to the ruminants and humans.
Countless researches have demonstrated that livestock has noteworthy influence in the incomes of countryside poor people [5]. Similar to other emerging kingdoms of the world, Pakistan in facing circumstances alike them where most of the people lives in villages and count on agriculture for their livings. The pollution of grasslands and the buildup of potentially heavy metals (PTM) in livestock take place on soil that is already filled with metals, due to unintentional and intentional events [11], or due to the continued and long term usage of manure and sewage water [12].
In consideration of the long-standing toxic influences of heavy metals on fertility of soil and the laws suggested by EU on concentration of heavy metals and Pb in dietary material, it is highly significant to measure the concentration of heavy metals in agronomic soils. Moreover, it should be assessed that which soils are most exposed to contamination of heavy metal. In this way, they can be controlled suitably to decrease potential risks. Numerous studies have undergone to find out heavy metals in different locations.
Amongst countless locations the lead contamination of crops from industrial regions and proximate busy roads was greater than that of crops from agricultural regions [13]. Crops have a basic role in the biotransformation of metals from air, water and soil, though green crops are incapable to absorb much Hg from polluted soil [14]. Because of their young cells and low-density cell walls, heavy metals cannot pass through the root apices of plants. Metals are picked up from contaminated soil and transferred to above-ground portions by these devices. Cu is an important mineral for crops, but too much of it is poisonous to them [15]. Copper poisoning causes necrosis and chlorosis, as well as root development suppression, leaf discoloration, and checking [16]. Copper excess and shortage can disrupt plant growth and development by influencing the plant's different bodily systems [17-27].
Aim of the study was to evaluate the concentration of heavy metals in animal’s blood plasma consuming fodder and forages grown in sewage water contaminated soil and to determine various indices for evaluation of metal level.
Collection of sample
Sampling sites: Three tehsils; Silanwali, Sahiwal and jhawarian of District Sargodha were selected for the sampling of forages, fodder and blood of cows. The samples of Municipal wastewater being used for irrigation were also collected from these different tehsils of District Sargodha. From every site three duplicates of each sample were also taken. Sampling period was between November 2020 to May 2021.
Forage and fodder samples: Twenty-five samples of fodder/forage were collected from each site. Five replicates of every crop were sampled from every field. Samples of T. alexandrinum, M. sativa, P. glaucum, B. campestris and H. vulgare were gathered from each tehsil. Then the fodder/forage all these specimens were dried in air for many days. Then these samples were packed in paper envelops and dried in oven at 75°C for 72 hours. After this process of crop samples was completed, those crops were grinded to fine powder with pastel and mortar. Then the powdered crops samples were weighed 2 g for the complete digestion of samples.
Soil samples: From each point, about 1.0 kg of soil samples was collected where forge and fodders were grown. Thirty samples of soil were taken. Replicates of soil were taken carefully. Then it was weighed and content of moisture was noted. After that soil were kept in sunlight for drying purpose. For the complete removal of water from samples, samples were kept in oven. Then soil samples were ground finely and 2.0 g of each soil sample were taken for analysis.
Water samples: Water used for irrigation of sampled crops was collected in bottle from every field. 5.0 ml were put in storage for further process.
Metal investigation
Analysis of metal consists of following steps:
1. Digestion of samples
2. Dilution of digested sample
3. Filtration with the help of filter paper
4. Flame/Atomic absorption spectrophotometry
Digestion apparatus and chemical
Beaker, flasks, dropper, hotplate, hydrogen peroxide (H2O2) 50%, H2SO4 2.0 ml, Tripod stands, stirrer, filter paper, refined water, measuring jars and storage jars, labeling Tape.
Fodder, forage, soil and water sample digestion
Different process is involved in digestion of samples of fodder, forage, soil and water.
Fodder and forage: Fodder and forage sample (5.0 g) were taken in each beaker and then its weight was measured. Then sample was heated and the creation of residue Started and after this residue was dried it was retained for a day. Weight of residue was measured and 50.0 ml water was added and reserved it for evaluation metal.
Soil: Sulphuric acid 2.0 ml along with 5.0 g of soil sample was taken in digestion chamber. Heavy metal analysis was performed after digestion of soil. Nitric acid 2.5 ml, 0.5 ml 30% hydrogen peroxide and HCL 7.5 ml was utilized in this procedure (Kilburn, 2000).
Water: A limited droplet of sulfuric acid was poured to a beaker holding 5.0 ml of H2O, which was then boiled until smoke appeared, then 2.0 ml of hydrogen peroxide was given, and the cycle continues until the water became transparent, at which point it was strained and placed in a container.
Dilution and filtration
All of the digestion specimens were dissolved with newly made plain water to a volume of 50 ml. The filtering and tagging of the samples were used to track their dilution. After that, all of the samples were preserved in plastic containers.
Analysis of metal
After the digestion of samples, Atomic Absorption Spectrophotometer is used to discover concentration of Ni in these samples with the parameters shown in Table 1.
| Metal | Type of Flame | Slit Width | Lamp Current | Wavelength | |||
|---|---|---|---|---|---|---|---|
| (mA) | (mA) | (nm) | |||||
| Pb | Air acetylene | 0.7 | 6 | 283.3 | |||
| Zn | Air acetylene | 0.7 | 5 | 213.9 | |||
| Daily Intake of Metal | |||||||
| Animal | D food intake | C.F | B average weight | Animal | |||
| Cow | 12 mg/kg (Johnsen & Anely 2019) | 0.085 (Jan, et al. 2010) | 600 kg (Johnsen & Anely 2019) | Cow | |||
Statistical analysis
Average content of soil, fodder, and blood tasters were found out. Data was entered in SPSS and ANOVA ran to find out Variance and correlation.
Indices for effluence exposure calculation
i) 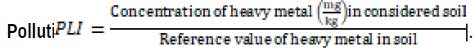
Reference value of Lead and Zinc in soil is 8.15 and 44.9 [18].
Cui Y, et al. [21] firstly used bio concentration factor (BCF) by following formula
ii) 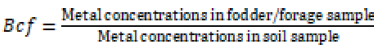
Enrichment factor (EF): It is formulated as follows:
iii) 
Standard concentration of lead (mg/kg) in forage and soil is 3 mg/kg [18] and 8.15 mg/kg (FAO/WHO 2001) respectively. Standard concentration of lead (mg/kg) in forage and soil is 99.4 mg/kg [18] and 44.19 mg/kg (FAO/WHO 2001) respectively
Daily intake of metal
In case of cow, D food intake is 12 mg/kg [19] C.F is 0.085 [20] and average weight of cow is 600 kg [19].
To calculate daily intake of metal DIM the formula is given below:
iv) 
Health risk index
HRI is used for the measurement of threat of heavy metals exposure by ingestion of fodder and forages. It expresses the hazard to cows which ingest contaminated fodder and forages ([21]; USEPA 2002).
DIM means Daily consumption of heavy metal while
Rf D means Oral reference dose.
Oral reference dose (mg/kg) for lead and is zinc is 0.004 mg/kg (FAO/ WHO 2013) and 0.3 mg/kg (USEPA 2010).
Lead and Zinc in water
Analysis of variance displayed significant (p <0.001) result on the concentration of Lead in water. Assessment of variances exhibited significant (p <0.001) effect on the conc. of zinc in water. Concentration of Lead in wastewater used for the irrigation of fodder and forages ranges from 0.09-0.45 m/L. Site 3 has the highest concentration of Lead in water while site 1 has the lowest range. Concentration of zinc wastewater ranges from 3.41-5.83 mg/L. Site 2 has the highest concentration of zinc in water while site 1 has the lowest range (Table 2). The amount of metal elements vary from place to place and source of water also varies. Due to different source it might be possible that one site has higher concentration than the other site. (Table 2)
| Sites | Site 1 | Site 2 | Site 3 |
|---|---|---|---|
| Mean concentration of Lead | 0.092000 ± 0.0043589 | 0.268000 ± 0.0667008 | 0.450000 ± 0.0458258 |
| Mean concentration of Zinc | 3.41 ± .0230940 | 5.83 ± .0260342 | 4.59 ± .0378594 |
Lead and Zinc in soil
All the treatments articulated significant (p <0.001) effect on the concentration of Lead according to the study of variance in all fodder and forages. All the treatments stated significant (p <0.001) effect on the conc. of zinc conferring to the analysis of variance in all fodder and forages (Table 3).
| Variables | Degree of Freedom | Mean Square of Lead | Mean Square of Zinc |
|---|---|---|---|
| Site | 2 | 30.609 | 121.727*** |
| Forage | 4 | 1.769 | 1.612*** |
| Site * Forage | 8 | 2.689 | 15.742*** |
| Error | 30 | .002 | .009 |
In the soil of B. campestris of site 3 the mean concentration of Lead was 13.85mg/kg and it was the highest concentration of Lead in the soil of feeding sites.10.11 mg/kg was the lowest mean concentration in Lead found in soil of B. campestris of site 1. Levels of Lead present in forages and fodder grown in three different sites irrigated with waste water ranged between 10.11 mg/ kg and 13.85 mg/kg. In the soil of H. vulgare of site 1 the mean concentration of Zn was 37.25 mg/kg and it was the highest concentration of Zn in the soil of feeding sites.27.76 mg/kg was the lowest mean concentration in zinc found in soil of p. glaucum of site 1. The sequence of zinc levels in 1st site was B. campestris > T. alexandrinum > M. sativa > P. glaucum > H. vulgare. The sequence of zinc levels in site 2 was: B. campestris > P. glaucum > T. alexandrinum > H. vulgare > M. sativa while in site 3 the observed sequence was H. vulgare > P. glaucum > M. sativa > T. alexandrinum > B. campestris. Levels of zinc present in forages and fodder grown in three different sites irrigated with waste water was fluctuated between 27.76 mg/kg and 37.25 mg/ kg. USEPA has given maximum permissible limit of 50 mg/kg in soil (Table 4) and final results were found to be lower than this. USEPA (1997). It can be observed of that the concentrations zinc in soil samples is greater than the concentrations of lead. Both metals are different so there availability in soil is also different. There are many factors which affect the availability of each metal like edaphic factor, soil pH and antagonistic behaviour of metals may affect the availability in soil. Zinc is widely used in industries such as galvanization, paint, batteries, smelting, fertilizers and pesticides, fossil fuel combustion, pigment, polymer stabilizers, etc, and the wastewater from these industries is polluted with zinc, due to its presence in large quantities while Zinc in domestic Wastewater is lower so is the case in this study.
The larger part of zinc in wastewater does not stem from point sources. It stems from larger surface waters containing the element. Zinc leaks from zinc pipes and rain pipes, consequential to circulation of carbon rich water. Car tires containing zinc and motor oil from zinc tanks release zinc compounds on roads. All these factors could be the significant reason for increasing concentrations of zinc in samples (Table 4).
| Soil | Concentration (mg/kg) of Lead in soil | Concentration (mg/kg) of Zinc in Soil | ||||
|---|---|---|---|---|---|---|
| Soil of Fodder/Forages | Site 1 | Site 2 | Site 3 | Site 1 | Site 2 | Site 3 |
| T. alexandrinum | 11.84 ± 0.014 | 12.82 ± 0.017 | 12.61 ± 0.017 | 30.45 ± 0.048 | 32.36 ± 0.060 | 34.44 ± 0.042 |
| M. sativa | 10.21 ± 0.012 | 12.71 ± 0.023 | 11.64 ± 0.012 | 29.57 ± 0.055 | 31.38 ± 0.076 | 36.48 ± 0.060 |
| P. glaucum | 11.44 ± 0.020 | 12.72 ± 0.008 | 12.81 ± 0.023 | 28.65 ± 0.056 | 33.54 ± 0.051 | 36.85 ± 0.046 |
| B. campestris | 10.11 ± 0.021 | 13.50 ± 0.020 | 13.85 ± 0.008 | 30.64 ± 0.049 | 34.44 ± 0.051 | 30.39 ± 0.064 |
| H. vulgare | 8.67 ± 0.081 | 13.63 ± 0.020 | 12.84 ± 0.017 | 27.76 ± 0.055 | 32.07 ± 0.041 | 37.25 ± 0.057 |
Lead and Zinc in forage and fodder
All the treatments expressed significant (p <0.001) effect on the concentration of Lead according to the analysis of variance in all fodder and forages. All the treatments show significant (p <0.001) effect on the concentration of zinc according to the analysis of variance in all fodder and forages (Table 5).
| Variables | Degree of Freedom | Mean Square Of Lead | Mean Square of Zinc |
|---|---|---|---|
| Site | 2 | 36.743*** | 4.704*** |
| Forage | 4 | 2.980*** | 12.691*** |
| Site * Forage | 8 | 2.663*** | 15.167*** |
| Error | 30 | .001 | .004 |
The maximum mean concentration of Lead was present in B. campestris grown in site 3 and the lowermost mean concentration was detected in P. glaucum grown at site 1. Lead concentration was in the range 9.50 mg/kg and 14.14 mg/kg in all the samples. The concentration of zinc in forages and fodder grown in soil irrigated with waste water was found to be lower than 99.4 mg/kg which is the maximum permissible limit given by FAO/WHO (2001). The maximum mean concentration of Zn was present in T. alexandrinum grown in site 1, and the lowermost mean concentration was detected in M. sativa grown at site 1. Zinc concentration in the range 16.49 mg/kg and 8.60 mg/kg in all the samples (Table 6).
| Soil of Fodder/Forages | Concentration (mg/kg) of Lead in Fodder and Forage | Concentration (mg/kg) of Zinc in Fodder and Forage | ||||
|---|---|---|---|---|---|---|
| Site 1 | Site 2 | Site 3 | Site 1 | Site 2 | Site 3 | |
| T. alexandrinum | 9.87 ± 0.005 | 10.63 ± 0.012 | 12.23 ± 0.018 | 16.49 ± 0.061 | 10.82 ± 0.056 | 10.93 ± 0.038 |
| M. sativa | 9.81 ± 0.011 | 12.06 ± 0.020 | 12.86 ± 0.008 | 8.60 ± 0.023 | 10.51 ± 0.029 | 10.85 ± 0.034 |
| P. glaucum | 9.50 ± 0.11 | 13.18 ± 0.021 | 10.73 ± 0.017 | 10.38 ± 0.051 | 13.57 ± 0.050 | 10.21 ± 0.040 |
| B. campestris | 9.70 ± 0.012 | 13.40 ± 0.015 | 14.14 ± 0.026 | 8.56 ± 0.025 | 11.62 ± 0.037 | 12.38 ± 0.027 |
| H. vulgare | 9.76 ± 0.012 | 12.14 ± 0.018 | 12.89 ± 0.017 | 8.61 ± 0.026 | 11.43 ± 0.029 | 9.41 ± 0.031 |
Lead in blood samples
The Lead levels of were found to be significant. The mean concentration of Lead in cow blood samples has range of 0.136-1.918 mg/kg. Maximum concentration of Lead was found in the blood of cows grazing at fodder and forages at site 3 while minimum at Site 1. The zinc levels of were found to be significant. The mean concentration of zinc in cow blood samples has range of 0.136-1.918 mg/kg. Maximum concentration of zinc was found in the blood of cows grazing at fodder and forages at site 3 while minimum at Site 1 (Table 7).
| Sites | Site1 | Site2 | Site3 |
|---|---|---|---|
| Mean concentration of Lead | 1.646 ± .0163 | 1.782 ± .0128 | 1.94 ± .015 |
| Mean square Mean concentration of zinc | 1.36 ± 0.076 | 1.788 ± 0.044 | 1.918 ± 0.058 |
Correlation
For lead evaluation at Site 1non significant and negative correlation was seen between soil and forages while non-significant and negative correlation was seen between forage and blood. At Site 2 non-significant and positive correlation was seen between soil and forages while non-significant and positive correlation was seen between forage and blood. At Site 3 non-significant and positive correlation was seen between soil and forages while non-significant and positive correlation was seen between forage and blood. In case of zinc at Site 1 non-significant and positive correlation was seen between soil and forages while non-significant and negative correlation was seen between forage and blood. At Site 2 significant and positive correlation was seen between soil and forages while non-significant and positive correlation was seen between forage and blood. At Site 3 significant and negative correlation was seen in soil and forages while non-significant and negative correlation was seen between forage and blood (Table 8).
| Sites | Lead | Zinc | ||
|---|---|---|---|---|
| Soil-Forage | Forage-Blood | Soil-Forage | Forage-Blood | |
| Site 1 | -.150 ns | -.405 ns | 0.404 ns | -0.524 ns |
| Site 2 | .289 ns | .180 ns | 0.600** | 0.301 ns |
| Site 3 | .351 ns | .402 ns | -0.923** | -0.469 ns |
Pollution load index
B. campestris of site 3 has PLI value lead 1.699 and it is the highest value of pollution load index observed and M. sativa of site 1 has PLI of 1.25 and it is the lowest value of pollution load index noticed. B. campestris of site 3 has PLI value of zinc 1.699 and it is the highest value of pollution load index observed and M. sativa of site 1 has PLI of 1.25and it is the lowest value of pollution load index noticed.
Bio concentration factor
The maximum BCF value of lead was observed in H. vulgare and the lowest concentration was seen in T. alexandrinum. BCF values ranges from 0.82 to 1.12 in the collected samples. The order of the bio concentration values of zinc in fodder and forages which have been given waste water for irrigation at site 1 was; T. alexandrinum > P. glaucum > H. vulgare > M. sativa > B. campestris. At site 2 the sequence for BCF was: T. alexandrinum > P. glaucum > H. vulgare > M. sativa > B. campestris. BCF values at site 3 were in order of B. campestris > T. alexandrinum > M. sativa > H. vulgare. The maximum concentration was observed in T. alexandrinum and the lowest concentration was seen in H. vulgare. BCF values ranges from 0.25 to 0.54 in the collected samples.
Enrichment factor of Lead and Zinc
The peak value of Enrichment factor of lead was seen in M. sativa (3.00) and the lowermost value was seen in T. alexandrinum (2.25). The order of the enrichment factor of zinc of zinc observed in crops at site 1 was: M. sativa > B. campestris > T. alexandrinum > P. glaucum > H. vulgare. Results of site 2 and site 3 showed the order of M. sativa > B. campestris > M. sativa > P. glaucum > T. alexandrinum and P. glaucum > T. alexandrinum > H. vulgare > M. sativa > B. campestris respectively. The peak value in P. glaucum (0.1811) was detected, and the lowermost value was seen in H. vulgare (0.1100009).
Daily intake of Lead and Zinc
The extreme DIM value of lead was 0.024 seen in B. campestris of site 3 and the lowest value detected in P. glaucum was 0.01615 of site 1. The extreme DIM value of zinc was 0.02804 seen in T. alexandrinum, and the lowest value detected in B. campestris was 0.014552. The order of DIM at site 1 was: T. alexandrinum > P. glaucum > M. sativa > H. vulgare > B. campestris. At site 2: B. campestris > T. alexandrinum > M. sativa > P. glaucum > H. vulgare while at site 3 sequence was: P. glaucum > B. campestris > H. vulgare > T. alexandrinum > M. sativa.
Health risk index of Lead
The values of health risk index of lead is highest in B. campestris (6.0095 mg/kg) in site 3 and least in P. glaucum (4.0375 mg/kg) at site 1. The health risk index value of Zn is highest in T. alexandrinum (0.0934 mg/kg) and least in B. campestris (0.0465 mg/kg) (Table 9).
| Fodder/Forage | Lead | Zinc | ||||
|---|---|---|---|---|---|---|
| HRI 1 | HRI 2 | HRI 3 | HRI 1 | HRI 2 | HRI 3 | |
| T. alexandrinum | 4.19475 | 4.519166525 | 5.200583475 | 0.093481113 | 0.061351113 | 0.061955554 |
| M. sativa | 4.16925 | 5.126916525 | 5.466916525 | 0.049733333 | 0.059594446 | 0.061521113 |
| P. glaucum | 4.0375 | 5.604333475 | 4.561666525 | 0.058838887 | 0.076896667 | 0.057894446 |
| B. campestris | 4.125333475 | 5.695 | 6.0095 | 0.046506667 | 0.065884446 | 0.070191113 |
| H. vulgare | 4.150833475 | 5.162333475 | 5.481083475 | 0.048808887 | 0.06480778 | 0.053361113 |
In comparison to the current study (0.45) in waste water samples, Iqbal M, et al. [22] found greater Pb, and Zn levels. The current studies about Pb, Cd, Ni Fe, Mn, Cu Cr, and Zn levels were greater than those reported by Balkhair and Ashraf [23]. The levels of Lead in water were found to be higher than the WWF-recommended safe limit (0.10) (2007) (Table 9).
The mean readings of all metals in soil were below the USEPA's (1997) maximum permissible limit (MPL) of 300 for Pb. Less content of Lead was reported by Liu Y, et al. [24] in water used for the sake of irrigation of crops. The soil Lead values found in our study were significantly higher than the values by Kunito T, et al. [25], which ranged from 5.0 to 25.0 mg/kg.
The allowable Pb limit level for plants is 3.0 ppm, and the fodder levels of lead discovered in this study were more than that limit [26,27].
Plants cultivated on wastewater irrigated soil were found to be polluted with potentially harmful metals, according to Liu Y, et al. [28], and to pose a variety of health risks to humans.
According to Fu chen, et al., Pb concentrations in cow blood samples fluctuated from 4.468 to 0.217 mg kg at all locations. But the result of blood samples of cows feeding on waste water irrigated soil were less than this value.
Ability to determine that plants could potentially and readily accumulate poisonous metals from soil to edible parts of plants is known as BCF.BCF of this study were 1.82.
BCF>1 illustrated that plants could possibly and readily gather metals.
The value of pollution load index of all lead was below than the reference values (mg/kg) of Pb (8.15) (Dutch Standards 2000; [18].
At this time, the pollution load index due to Lead was lower than that reported by Ashfaq, et al. The Zn level in the current results were shown to be above Pescod's permitted limit of 2.0 mg/L. The Zn concentrations in the current study were greater than those found by Tariq et al. 2006 in water (0.1 mg/L) and value of zinc in wastewater (0.210 mg/L). Salawu K, et al. [29] discovered a lower Zn concentration in sewage water (4.236 mg/L).
The current Zn concentrations in water were smaller than those found by Kumar A, et al. [30] for industrial run off (8.80 mg/L). In both freshwater and treated water, Kahlaoui K, et al. [31] observed a substantial range of Zinc concentrations (0.20-0.55 mg/L). The elevated levels of various metals in the effluent, according to Kumar and Chopra (2015), could be related to the use of different compounds in the sector.
The Zn levels were observed to be around the USEPA's acceptable maximum limits of 200 mg/kg. Kumar A, et al. [30], on the other hand, found a lower range of Zinc in soil (3.75-4.15 mg/kg).
Khaskhoussy K, et al. [32] discovered a higher Zinc value (74.5 mg/ kg) in their investigation about wastewater. Metals within water, biochemical characteristics, surface and groundwater qualities both may lead to Zinc accumulation in the soil.
The present Zn concentrations were observed to be within WHO's permitted range of 50 mg/kg (2018). There appears to be no threat of metal contamination based on this result. Greater Zinc concentrations were found by Ahmad K, et al. [33], ranging from (25.88 to 42.24 mg/kg. Kumar A, et al. [30], on the other hand, found a lower Zinc range. (8.28-11.60 mg/kg) in forages.
Saha S, et al. [34] found a higher range of Zn in different plant parts in crops (46 mg/kg) irrigated with sewage water. The lowermost Zn prerequisite of cattle differs with the chemical form or mixture of the food.
The smallest Zn requirement for cattle varies depending on the chemical method or mix of the food [35,36]. In blood plasma samples, McDowell LR, et al. [8] found a critical value of 0.80 mg/L for Zn. The current study's Zn readings were higher than McDowell's accepted value (2003).
Lower Zn BC was discovered by Lu et al. In millet, Asdeo (2014) found a lower value (0.4049) for BCF. According to Pawan et al., Zn atoms are linked to toxic metals because of their ability to adhere to soil and dissolve in soil water.
Bao Z, et al. [37] discovered zinc values in separate regions watered with long-term sewage water (1.04, 1.14, and 1.03) but in our results PLI value was found to be smaller. PLI for Zn (1.528) was likewise shown to be greater in soil treated with sewage water, according to Ahmad K, et al. [33]. The greater PLI indicates that there was more heavy metal pollution in the area.
Roggeman S, et al. [38] observed a higher mean DIM value (7368-4216 mg/kg). Lawal NS, et al. [39] previously discovered different DIM Zn values (0.0068-0.0062) in crops. The DIM values in the current study were less than 1, implying that the usage of such polluted forages posed a health concern.
Khan ZI, et al. [40] found an advanced HRI Zn value (0.537-0.609) whereas Lawal NS, et al. [39] found a minor HRI Zn value (0.040-0.021). In sewage water locations, Khan ZI, et al. [40] found an alike mean HRI significance (0.09- 0.10) [41-47] (Figures 1-4).

Figure 1. Fluctuating level of Pb in wastewater.

Figure 2. Fluctuation in level of Pb in soil.

Figure 3. Fluctuation in level of Pb in fodder and forages.

Figure 4. Fluctuating level of Pb in blood.
The results obtained after the present investigation call attention to the fact that the solicitation of wastewater in soil may possibly be because of adulterated fodders producing severe health peril to the food chain. This work has emphasized on possible effects and dangers of consuming wastewater for crop production. Bioavailability of heavy metals to crops resulted in accumulation of metals in crop tissues up to deadly levels. Constant soil checking is mandatory to have a check on heavy metal concentration in fodder and forages. Unremitting checking of sources of irrigation over and above their chief management previously applied to crops is compulsory to lessen related health danger.
There is a need to check the waste water for heavy metals before using it for irrigation purposes. The farmers need to be educated enough about the deadly effects of heavy metals on plants, animals and humans. The regulatory authorities should devise or implement a system to check for waste water analysis used for irrigation purposes.
The authors express their appreciation to all co-authors for their valuable comments and suggestions in finalizing the manuscript.
The authors declare that there is no conflict of interest.
The authors declare that the manuscript has not been published previously.
Google Scholar, Crossref, Indexed at
Google Scholar, Crossref, Indexed at
Google Scholar, Crossref, Indexed at
Google Scholar, Crossref, Indexed at
Google Scholar, Crossref, Indexed at
Google Scholar, Crossref Indexed at
Google Scholar, Crossref, Indexed at
Google Scholar, Crossref, Indexed at
Google Scholar, Crossref, Indexed at
Google Scholar, Crossref, Indexed at
Google Scholar, Crossref, Indexed at
Google Scholar, Crossref, Indexed at
Google Scholar , Crossref, Indexed at
Google Scholar, Crossref, Indexed at
Google Scholar, Crossref, Indexed at
Google Scholar, Crossref, Indexed at
Google Scholar, Crossref, Indexed at
Google Scholar, Crossref, Indexed at
Google Scholar, Crossref, Indexed at
Google Scholar, Crossref, Indexed at
Google Scholar, Crossref, Indexed at
Google Scholar, Crossref, Indexed at
Google Scholar, Crossref, Indexed at
Google Scholar, Crossref, Indexed at
Journal of Environmental Analytical Chemistry received 1781 citations as per Google Scholar report