Research Article - (2021) Volume 12, Issue 8
Received: 26-Jun-2021
Published:
11-Aug-2021
, DOI: 10.37421/2155-6113.2021.12.855
Citation: Gebre, Kindu Kebede. “Joint Modeling in Determinants of Status of Tuberculosis and CD4 Cell Count among Antiretroviral Therapy Attendant of HIV Infected Adults Follow Up in Gondar Teaching Referral Hospital, Gonder, Ethiopia.” J AIDS Clin Res 12 (2021): 855.
Copyright: © 2021 Gebre KK. This is an open-access article distributed under the terms of the Creative Commons Attribution License, which permits unrestricted use, distribution, and reproduction in any medium, provided the original author and source are credited.
Background: Tuberculosis and human immunodeficiency virus have been closely linked and East Africa is the hardest region hit by tuberculosis and Human immunodeficiency virus including Ethiopia. The main objective of this study was to identify the associated variables with tuberculosis status and CD4 cell count chance of patients jointly in Gonder teaching referral hospital, Gonder, Ethiopia implemented by SAS version 94.
Methods: A retrospective cohort study was conducted on AIDS patients whose age greater than 19 years from 1st January, 2018- 30th January, 2020. Generalized linear mixed model was used to identify the factors of CD4 cell count and tuberculosis status of patients separately and jointly.
Results: The mean with a standard deviation of weight, and a hemoglobin level of patients were 55.48 (10.21), and 18.25 (33.028) respectively. The baseline characteristics of patients included in this study was the median CD4 count of patients was 378 cells per cubic millimeter of blood. The generalized linear mixed model was well fitted which shows, opportunistic infection, weight and hemoglobin level were significantly associated with log of CD4 cell count and tuberculosis status of patients at 5% level of significance.
Conclusion: From this study, hemoglobin level, weight, and opportunistic infection of other disease were statistically significant at a 5% level of significance for the log of CD4 count and TB status of patients jointly. The result of the study shows that the log of CD4 count of patients increased when hemoglobin level and weight of patients increased. In addition, the log of CD4 count of AIDS patients who has other disease is 5.04 more likely to be co-infection than who has no other disease.
CD4 count • Immunodeficiency virus • Tuberculosis • Generalized linear mixed model
SAS: Statistical Analysis System • AIDS: Acquired Immunodeficiency Syndrome • HIV: Human Immunodeficiency Virus • WHO: World Health Organization • ART: Antiretroviral Therapy • CD4: Cluster of Differentiation Four • TB: Tuberculosis • UNAIDS: United Nation Report on Acquired Immune Deficiency Syndrome • HAART: Highly active antiretroviral therapy • DF: Degree Freedom
Human Immune Deficiency Virus is a virus that causes acquired immune deficiency syndrome by reducing a person’s ability to fight infection. HIV attacks an immune cell and the CD4 cell is responsible for the body’s immune response to infectious agents. HIV is associated morbidity and mortality dramatic declines as a result of highly active antiretroviral therapy and treatment response rates with subsequent antiretroviral regimens are lower than with initial antiretroviral therapy [1].
East and Southern Africa is the hardest region hit by the HIV. This region is the home to 6.2% of the world’s population but it has 19.4 million people living with the virus, over 50% of the total number of people living with the virus in the world [2].
Tuberculosis and HIV have been closely linked since the emergence of AIDS and TB is the most common infectious disease affecting HIV- positive individuals. Globally, the 8.8 million incident cases worldwide an estimated 1.1 million were found to be co-infected with HIV [3].
Tuberculosis is a leading opportunistic infection and a major cause of mortality among individuals infected with HIV. Substantial reduction of tuberculosis-related morbidity and mortality among individuals with HIV can be achieved with early initiation of ART [4]. HIV/AIDS pandemic is responsible for the resurgence of TB worldwide, resulting in increased morbidity and mortality. Co-infection with HIV infection leads to difficulties in both the diagnosis and treatment of tuberculosis, increase risk of death, treatment failure and relapse [5]. Today, HIV and TB treatments are common in many societies and the use of drugs has altered the joint dynamics of both diseases. About one third of 39.5 million HIV infected people worldwide were co-infected with TB [6] and up to 50% of individuals living with HIV are expected to develop TB [7].
Ethiopia is among the countries most heavily affected by the Human immunodeficiency Virus and tuberculosis. There are an estimated 1.3 million people living with the virus and roughly 68,136 of them were children under 15 years. The World Health Organization has classified Ethiopia 7th among the 22 high burden countries with TB and HIV infection in the world [8].
As stated in literature, many studies conducted in lined to tuberculosis and HIV co-infection related in Ethiopia that mainly focused on the knowledge of health providers about tuberculosis and HIV co-infection [8], tuberculosis in HIV/AIDS patients and its relationship with CD4 count [5], tuberculosis and HIV co-infected patients [4]. In spite of the fact that, several studies have been done on assessment and examined general tuberculosis and HIV co-infection, they didn’t deal with joint modeling in determinants of status of tuberculosis and CD4 cell count. The current study aims to identify the determinants of status of tuberculosis and CD4 cell count of patients jointly and it associated factors since there is limited information about this critical issue.
In order fill the gap, in many medical cases more than one clinical outcome are measured longitudinally at the same time on the same subject where these measured clinical outcomes are correlated. Since they are highly related changes in either often affect changes in the other. In such cases the univariate longitudinal analysis does not take into account correlation between observations on different response variables at each time points. Besides this knowing how the evolution of one is related to the evolution of the other, as well as how the association changes or evolves overtime is difficult from univariate longitudinal analysis. Joint modeling of longitudinal data in other way round accounts two types of correlations which are known to be serial correlation and cross correlation. If different types of outcomes are measured at each time point, the correlation structure is more complicated and hence, more difficult for drawing inference [9].
Study design, population and area
A retrospective cohort study design was used to collect relevant information’s from ART chart in order to address the objective of this study. HIV positive patients who are greater than 19 years old and start ART since January 1, 2018 and who has base line and at least three follow up period until January 30, 2020 included in this study. This study conducted at Gondar Teaching Referral Hospital in North-Western Ethiopia, Amhara Region. The population of this study included positive adults who attend antiretroviral therapy at Gondar Teaching Referral Hospital.
Data source and collection procedures
All HIV patients who follow up the case unit of 1st January, 2018- 30th January, 2020 in Gondar Teaching Referral Hospital for a period of two years. In this study, the target population was adults of HIV positive patients in specified period. This study obtained data from a retrospective cohort study based on ART electronic data base and from the review of patient charts which contains socio-demography, laboratory and clinical information of all patients under ART follow-up including a detailed antiretroviral therapy history from Gondar Teaching Referral Hospital among Antiretroviral Therapy (ART) follow up study. CD4 cell level and TB status of the patients was collected at the initiation of the treatment and at different time points after the start of the treatment. During follow up subjects come to the center at irregular time (one, two three or more month’s gap) and during their visit their CD4 cell level is measured and recorded in the individual follow up cards.
Variables that included in the study
The longitudinal response variables for this study were a bivariate outcome variable such as CD4 cell count and TB screen results (positive or negative). Therefore, CD4 count has count variable and TB screen results of AIDS patients are binary.
Statistical analysis
Longitudinal data has multiple observations refer to the same attribute measured at different points in time. This leads to repeated measures which are special forms of multivariate data. A different class of multivariate data arises when the multiple observations refer to different. to assess the changes of outcome(s) over time to associated risk factors with bivariate outcome variable by using joint modeling of binary and count data [10].
The response variables are bivariate outcome such as CD4 count and TB screen of patients. While the response variable CD4 count is a Poisson, and TB screen is a binary variables. Several studies have been perform with separate analysis for the two outcomes that were fitting a logistic model for the TB screen of patients and a Poisson regression model for the CD4 count. However, separate analyses of the two outcomes are ignoring the correlation between the two outcomes. This study was used joint modeling of two outcomes which is account two types of correlations which are known to be serial correlation and cross correlation.
The data sets nature of joint model must be change from multivariate form to univariate form. In the multivariate form the responses are stored in separate variables. The generalized linear mixed model procedure requires the univariate data structure. The data step in this study expands the observations in the data set into observations, stacking two observations per patient. The character variables identify the distribution that is assumed for the respective observations within a patient. Based on the separate analysis of CD4 count and TB status of patients revisit the model and examine other independent variables effects. But univariate longitudinal analysis does not take into account correlation between observations on different response variables at each time points.
This study was model both responses jointly to consider the correlation between observations on different response variables at each time points. Joint model is more important to control errors especially type I error rates in multiple tests, and it had more efficiency in parameter estimation.
There are several strategies for adopting joint modeling. The first approach is based on a conditioning argument that allows joint distribution to be factor out in marginal and conditional components (avoiding direct specification of joint modeling) with introduction of probit approach. This approach has advantages that it does not directly led to marginal inference and the correlation between the two outcomes can’t be directly estimated. The second is direct formulation of joint modeling for both response variables with the introduction of placket –Dale approach (placket latent variable) assumption for modeling bivariate outcomes. To obtained valid inferences, joint models could account for the correction among the outcomes and effects of different factors. The joint generalized linear mixed model assumes it for each outcome and the univariate models are combined through specification of joint multivariate distribution for all random effects. Furthermore, the mixed model can be applied with specification of marginal distribution, conditional on correlated random effect. When we have cases that, there are many outcomes measured from the longitudinal data, the most basic approach would be to model each longitudinal response independently. The generalized linear mixed model introduced before can easily be adopted in situations where various outcomes of a different types of responses be observed.
Parameters estimation
This study conduct parameter estimation for joint models, we may better to follow the following steps. First the joint marginal models will be fitted for both responses, and then linearization estimation method will be used as an approximation method. The parameters of joint models can be estimated using the numerical approximation methods. These include approximation to the integral using Gaussian quadratures or Laplace approximation [11]. The other estimation method is based on approximation of the data using the pseudo likelihood in which pseudo data are created based on a linearization of the mean.
More specially, the pseudo likelihood approach can be used to estimate parameters in marginal model and random effects with or without serial correlation, whilst quadratures or Laplace approximation can only estimate parameters in the conditional independent random effect models.
Evolution of the association
One important question that may be addressed with a joint mixed-effects model is how the association between the responses evolves overtime (“evolution of the association”).
Longitudinal joint models consider the variation caused by repeated measurements over time as well as the association between the response variables. In the case of combining binary and count response variables using generalized linear mixed models, integrating over a normally distributed random intercept in the binary logistic regression sub-model does not yield a closed form.
In this study, we assessed the impact of assuming a Bridge distribution for the random intercept in the binary logistic regression sub-model and compared the results to that of a normal distribution.
Assuming uncorrelated errors, the marginal correlation between the two responses as a function of time is given by
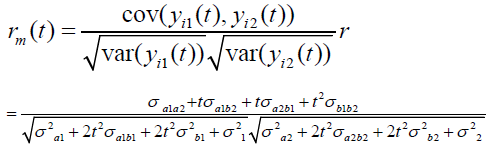
Two observations can be made from the uncorrelated errors by noticing t = 0 the marginal correlation reduces to
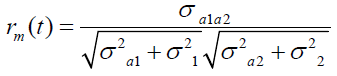
This is essentially the correlation between the two random intercepts. In fact, when the error components are small, the closer the marginal correlation at t =0 approximates the correlation between the random intercepts. Also, as t increases rm(t) converges to re for the case with uncorrelated errors, and to
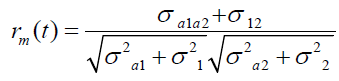
For the case of correlated errors, which indicates that the absolute value of the marginal correlation at t =0 cannot be higher than the correlation between the random intercepts. It may also be noted that as t increases the marginal correlation converges to the correlation between the random slopes, while the variance-covariance parameters of the random effects determine the shape of the marginal correlation function.
Model selection criteria
In order to select the best and final model which is appropriately fits with the given longitudinal data, it is necessary to compare the different models by using generalized chi-square/df [12].
Model diagnostics
A standard tool to perform model diagnostics are residual graphical methods, as many model checking procedures are based on quantities known as residuals plots, and formal statistical tests. Residuals are values that can be calculated for each observation and have the feature that their behavior is known, at least approximately, when the fitted model is satisfactory.
Missing data treatment
Missing values are a common issue in a lot of practical data situations. There are different imputing missing values in longitudinal study. The most popular imputation method to handling missing value is multiple imputations [13].
The baseline characteristics of patients included in this study was the median CD4 count of patients was 378 cells per cubic millimeter of blood. Of all the patients studied 12.6% live with TB, 61.1% were females, and 90.7% had working functional status in the first month treatment. Over 47.4% of the patients had married status and 84.5% of them had WHO stage 1. The average baseline CD4 cell count for all patients was 293 cells per cubic millimeter of blood and the average CD4 cell count change for the first and last visit was 353 and 482 cell/mm3 with corresponding standard deviations were 189 and 189 cells/mm3 respectively.
The mean pattern of CD4 count measurements of the patient’s overtime and their overall TB status were considered. Figure 1 indicated that the variability between and within TB positive status of AIDS patients was slightly increasing trend on each respondent throughout the follow-up. For responses, most (but not all) observations were slightly turned down throughout the follow-up from first up to third. However, the mean pattern of CD4 count measurements of the patient’s between sixth and eighth visiting was increased each responses. To fit the joint models of CD4 cell count change and TB status of patients, first Poisson for CD4 cell count change and binary logistic regression model for TB status of patient’s data were considered separately.

Figure 1. Line graph of co-Infection AIDS and TB patients with their visiting time.
Table 1 indicates the separate or joint marginal models for CD4 cell count change and TB status using Poisson and binary logistic regression. As indicated in the Table 2, time to visit, weight, initial CD4 cell count, hemoglobin level, education level, religion, marital status, occupation and age of patients significantly affected CD4 cell count change and occupation, opportunistic infection, ART adherence, weight and hemoglobin level of patients significantly affected TB screen outcomes. But weight, hemoglobin level and occupation of patients was associated to both outcomes significantly at alpha equal to 5%.
| Parameters | CD4 count | TB status | |||
|---|---|---|---|---|---|
| Estimate | Std. Error | P-value | Estimate | P-value | |
| (Intercept) | 4.566 | 2.02E-15 | 0 | 2.1357 | 0.756 |
| [time=1] | -0.163 | 0.0042 | 0 | 0.6695 | 0.705 |
| [time=2] | -0.138 | 0.0003 | 0 | 0.6655 | 0.416 |
| [time=3] | -.116a | . | . | 0.6948 | 0.892 |
| [time=4] | -0.086 | 0.0033 | 0 | 0.6761 | 0.155 |
| [time=5] | -0.079 | 0.0054 | 0 | 0.6887 | 0.123 |
| [time=6] | -0.052 | 0.0053 | 0 | 0.7851 | 0.768 |
| [time=7] | -0.044 | 0.0059 | 0 | 0.7068 | 0.14 |
| [time=8] | -0.04 | 0.006 | 0 | 0.7667 | 0.559 |
| [time=9] | 0.01 | 0.0068 | 0.138 | 0.8799 | 0.996 |
| [time=10] | 0b | . | . | . | . |
| [Gender=0] | .008a | . | . | 0.2587 | 0.776 |
| [Gender=1] | 0b | . | . | . | . |
| [Marital status=1] | -0.059 | 0.004 | 0 | 0.5901 | 0.369 |
| [Marital status=2] | .040a | . | . | 0.5226 | 0.892 |
| [Marital status=3] | -0.016 | 0.0031 | 0 | 0.5311 | 0.86 |
| [Marital status=4] | 0b | . | . | . | . |
| [Religion=1] | -.350a | . | . | 0.4673 | 0.641 |
| [Religion=2] | -0.423 | 0.0033 | 0 | 0.5535 | 0.786 |
| [Religion=3] | -0.238 | 0.0089 | 0 | 1.1549 | 0.508 |
| [Religion=4] | 0b | . | . | . | . |
| [education=0] | -0.338 | 0.0091 | 0 | 0.629 | 0.859 |
| [education=1] | -.020a | . | . | 0.3544 | 0.794 |
| [education=2] | -0.054 | 0.0027 | 0 | 0.3169 | 0.931 |
| [education=3] | 0b | . | . | . | . |
| [Occupation=0] | -0.019 | 0.0038 | 0 | 0.4369 | 0.8 |
| [Occupation=1] | 0.13 | 0.0061 | 0 | 0.5688 | 0.501 |
| [Occupation=2] | 0.005 | 0.0071 | 0.479 | 0.5708 | 0.682 |
| [Occupation=3] | 0.013 | 0.0033 | 0 | 0.384 | 0.487 |
| [Occupation=4] | -.060a | . | . | 0.3867 | 0.02 |
| [Occupation=5] | -0.149 | 0.0064 | 0 | 0.483 | 0.317 |
| [Occupation=6] | 0b | . | . | . | . |
| [Functional status=1] | .064a | . | . | 0.9555 | 0.226 |
| [Functional status=2] | 0.339 | -1.576 | 2.255 | 0.9772 | 0.728 |
| [Functional status=3] | 0a | . | . | . | . |
| [WHO stage=1] | -0.708 | -2.499 | 1.082 | 0.9136 | 0.438 |
| [WHOstage=2] | -0.233 | -2.145 | 1.678 | 0.9755 | 0.811 |
| [WHO stage=3] | 0.122 | -1.798 | 2.042 | 0.9796 | 0.901 |
| [WHO stage=4] | 0a | . | . | . | . |
| [OI=1] | 1.798 | 0.989 | 2.608 | 0.4129 | 0 |
| [OI=2] | 0a | . | . | . | . |
| [ART adherence=1] | -2.425 | -4.348 | -0.501 | 0.9813 | 0.013 |
| [ART adherence=2] | -0.176 | -2.292 | 1.94 | 1.0796 | 0.871 |
| [ART adherence=3] | 0a | . | . | . | . |
| [Regimen=0] | 2.498 | -0.16 | 5.155 | 1.3559 | 0.065 |
| [Regimen=1] | 2.688 | -0.359 | 5.735 | 1.5546 | 0.084 |
| [Regimen=2] | 0.169 | -1.737 | 2.075 | 0.9725 | 0.862 |
| [Regimen=3] | -0.659 | -2.631 | 1.313 | 1.0061 | 0.513 |
| [Regimen=4] | 0.226 | -1.577 | 2.03 | 0.9202 | 0.806 |
| [Regimen=5] | 0a | . | . | . | . |
| Age | 0.02 | -0.005 | 0.044 | 0.0123 | 0.613 |
| weight | 0.003 | -0.019 | 0.025 | 0.0113 | 0.781 |
| Base CD4 | 0 | -0.001 | 0.002 | 0.0007 | 0.76 |
| Hgb | 0.004 | -0.016 | 0.024 | 0.0104 | 0.02 |
The Table 1 contains a separate column for each response distribution, as well as an overall contribution. Because the model does not specify any random effects or R-side correlations, the log likelihoods are additive. The parameter estimates and their standard errors in this joint model are identical. There are two ways in which the correlations between the two responses for the same patient can be incorporated. We can induce them through shared random effects or model the dependency directly. A joint model of the second kind, where correlations are modeled directly, fit with the generalized linear mixed model statements.
The estimate of the variance of the random patient intercept is 0.1166, and the estimated standard error of this variance component estimate is 0.01301. There appears to be significant patient-to-patient variation in the intercepts. The estimates of the fixed effects as well as their estimated standard errors have changed from the bivariate-independence analysis (Table 2). When the CD4 count change and the TB status are modeled jointly, and compare the result with the separate analyses. Based on generalized chi square/df value equal to 7.53 is small and closed to 1 that shows the model is good fit (Table 3).
| Gender | 0=Female, 1=male |
|---|---|
| Age in years | Continuous |
| Marital status | 1=Single, 2=Married, 3=Divorced, 4=Widowed |
| Weight | Continuous |
| Adherence status | 1=Good, 2=Fair, 3=Poor |
| WHO Clinic Stage | 1=Stage I, 2=Stage Ii, 3=Stage Iii, 4=Stage Iv |
| Functional status | 1=Working, 2=Ambulatory, 3=Bedridden |
| Hemoglobin level | Continuous Variable |
| TB screening | 1=No Infection , 2=Co-infection |
| Duration of ART | Count |
| Baseline CD4 | Count |
| Religion | 1=Orthodox, 2=Muslim, 3=Protestant and 4=other |
| Educational level | 0=No education, 1=Primary, 2=Secondary, 3=Tertiary |
| occupation | 0=Government, 1=Farmer, 2=Ngo, 3=Self-worker, 4=Housewife, 5=Unemployment, 6=Other |
| Opportunistic infection status | 1=yes, 0=no |
| Regimen | 0=d4t-3TC-NVP, 1=d4t-3TC-EFV, 2=AZT-3TC-NVP, 3=AZT-3TC-EFV, 4=TDF-3TC-EFV, 5=TDF+3TC+NVP |
| Covariance parameters | Fit Statistics | |||||
|---|---|---|---|---|---|---|
| Subject | Estimate | Standard Error | 2 Res Log Pseudo-Likelihood | Generalized Chi-Square | Gener. Chi-Square / DF | |
| Cov Parm | id | 0.1166 | 0.01301 | 20215.7 | 17927.47 | 7.53 |
| intercept | ||||||
Table 4 shows the conditional independence random intercept model. As indicated in the Table 4, patients’ hemoglobin level, weight, and opportunistic infection of other disease were jointly and significantly associated with both response variables. The same sign in parametric estimation indicates that the two outcomes are positively correlated to each other. Since the conditional independence assumption might be too restrictive.
| Parameter | CD4 count | TB status | |||
|---|---|---|---|---|---|
| Estimate | Std. Error | P-value | Estimate | P-value | |
| [Marital status=1] | -0.059 | 0.004 | 0 | 0.5901 | 0.369 |
| [Marital status=2] | .040a | . | . | 0.5226 | 0.892 |
| [Marital status=3] | -0.016 | 0.0031 | 0 | 0.5311 | 0.86 |
| [Marital status=4] | 0b | . | . | . | . |
| [Religion=1] | -.350a | . | . | 0.4673 | 0.641 |
| [Religion=2] | -0.423 | 0.0033 | 0 | 0.5535 | 0.786 |
| [Religion=3] | -0.238 | 0.0089 | 0 | 1.1549 | 0.508 |
| [Religion=4] | 0b | . | . | . | . |
| [Education=0] | -0.338 | 0.0091 | 0 | 0.629 | 0.859 |
| [Education=1] | -.020a | . | . | 0.3544 | 0.794 |
| [Education=2] | -0.054 | 0.0027 | 0 | 0.3169 | 0.931 |
| [Education=3] | 0b | . | . | . | . |
| [Occupation=0] | -0.019 | 0.0038 | 0 | 0.4369 | 0.8 |
| [Occupation=1] | 0.13 | 0.0061 | 0 | 0.5688 | 0.501 |
| [Occupation=2] | 0.005 | 0.0071 | 0.479 | 0.5708 | 0.682 |
| [Occupation=3] | 0.013 | 0.0033 | 0 | 0.384 | 0.487 |
| [Occupation=4] | -.060a | . | . | 0.3867 | 0.02 |
| [Occupation=5] | -0.149 | 0.0064 | 0 | 0.483 | 0.317 |
| [Occupation=6] | 0b | . | . | . | . |
| [OI=1] | 1.798 | 0.989 | 0.018 | 0.4129 | 0 |
| [OI=2] | 0a | . | . | . | . |
| [ART adherence=1.0] | -2.425 | -4.348 | 0.501 | 0.9813 | 0.013 |
| [ART adherence=2.0] | -0.176 | -2.292 | 1.94 | 1.0796 | 0.871 |
| [ART adherence=3.0] | 0a | . | . | . | . |
| weight | 0.003 | -0.019 | 0.025 | 0.0113 | 0.021 |
| Base CD4 | 0 | -0.001 | 0.002 | 0.0007 | 0.76 |
| Hgb | 0.004 | -0.016 | 0.024 | 0.0104 | 0.02 |
In this study, two different models were explored, generalized linear mixed model for each outcome independently, and joint modeling of the two outcomes together. In the separate analysis of the longitudinal data, the log transformation CD4 cells count measurements were used to meet the normality assumption. In this study, the joint modeling of the two outcomes together was well fitted because generalized Chi square/df was 7.53 which closed to one.
The results in this study indicated that the separate models which did not include patients’ specific effects were not significantly different from joint models developed with the assumption of separate analysis. As indicated above the joint models were formed by imposing the joint multivariate distribution of random effect, Hence, the results of both separate and joint analysis were consistent. However, the joint models were simpler as compared to the separate models as their effective member of parameters was smaller [14-17].
Based on Table 1, time to visit, weight, initial CD4 cell count, hemoglobin level, education level, religion, marital status, occupation and age of patients significantly affected CD4 cell count change and occupation, opportunistic infection, ART adherence, weight and hemoglobin level of patients significantly affected TB screen outcomes. But weight, hemoglobin level and occupation of patients was associated to both outcomes significantly at alpha equal to 5%. This estimated result also consistent with similar previous studies conducted by different scholars [18,19].
From this study, hemoglobin level, weight, and opportunistic infection of other disease were statistically significant at a 5% level of significance for the log of CD4 count and TB status of patients jointly. In addition, the result of the study shows that the log of CD4 count of patients increased when hemoglobin level and weight of patients increased. The finding is consistent with [20].
From this study, hemoglobin level, weight, and opportunistic infection of other disease were statistically significant at a 5% level of significance for the log of CD4 count and TB status of patients jointly. In addition, the result of the study shows that the log of CD4 count of patients increased when hemoglobin level and weight of patients increased. Moreover, the log of CD4 count of AIDS patients who has other disease is 5.04 more likely to be co-infection than who has no other disease, controlling other predictors as constant. This result consistent with a previous finding [21].
The estimated odds of being co-infected were increased by 1.14 and 1.05 for a unit changes in weight and hemoglobin respectively. The estimated odds of patients who have no other related disease were 51.13% less likely to be co-infected as compared to those who have other related disease at 5% level of significant, controlling others predictors constant. This estimated result also consistent with similar previous studies conducted by different scholars [21-26].
This study used a series of repeated a measurement over time at the lowest level is nested with the individual patients at the highest level. Joint analysis of two longitudinal response variables was assuming their separate analysis. The results in this study indicated that the separate models which did not include patients’ specific effects were not significantly different from joint models developed with the assumption of separate analysis. As indicated above the joint models were formed by imposing the joint multivariate distribution of random effect, Hence, the results of both separate and joint analysis were consistent. However, the joint models were simpler as compared to the separate models as their effective member of parameters was smaller.
From this study, hemoglobin level, weight, and opportunistic infection of other disease were statistically significant at a 5% level of significance for the log of CD4 count and TB status of patients jointly. In addition, the result of the study shows that the log of CD4 count of patients increased when hemoglobin level and weight of patients increased. Moreover, the log of CD4 count of AIDS patients who has other disease is 5.04 more likely to be co-infection than who has no other disease, controlling other predictors as constant.
The estimated odds of being co-infected were increased by 1.14 and 1.05 for a unit changes in weight and hemoglobin respectively. The estimated odds of patients who have no other related disease were 51.13% less likely to be co-infected as compared to those who have other related disease at 5% level of significant, controlling others predictors constant.
Gondar Teaching Referral Hospital Director and all staff are gratefully acknowledged for the data they supplied for this health research. Authors are thankful to his wife Ferahiwot Geira and his little child Meklit Kindu for the motivation to write this paper.
The raw data used in this study can be accessed from the Gondar Teaching Referral Hospital.
KK have made substantial contribution to conception, design, analysis and interpretation of data and involved in drafting the manuscript, revising it critically for important intellectual content and all have given final approval of the version to be published.
Letter of ethical clearance was obtained from Haramaya University, Department of Statistics and submitted to the University of Gonder Teaching Referral Hospital to get permission to conduct the research. This study was developed in accordance with established legislation and complies with the norms of good clinical practice, and informed consent was being not necessary as personal identifying information was kept separate from the research data. Finally, the study protocol was approved by the ethics committee or medical directors of the University of Gonder Teaching Referral Hospital.
Journal of AIDS & Clinical Research received 5264 citations as per Google Scholar report