Review Article - (2020) Volume 4, Issue 1
Received: 28-Feb-2020
Published:
20-Mar-2020
, DOI: 10.37421/vcrh.2020.4.113
Citation: Wickramasinghe NC, Wallis MK, Coulson SG, Kondakov A et al. "Intercontinental Spread of
COVID-19 on Global Wind Systems". Virol Curr Res 4 (2020) doi: 10.37421/Virol Curr Res.2020.4.113
Copyright: © 2020 Wickramasinghe NC, et al. This is an open-access article distributed under the terms of the creative commons attribution license which permits
unrestricted use, distribution and reproduction in any medium, provided the original author and source are credited.
The pattern of the SARS-CoV-2 incidence concentrated in the 30-50N latitude zone suggests dust carrying the virus is spread by a circum-global jet-stream, specifically the northern sub-tropical jet-stream that blows in the high-altitude troposphere over northern China in early spring-time. It is known that the agent of the Kawasaki disease is carried by long-range winds to Japan and California from north-east China. We hypothesize that dust carrying the virus SARS-CoV-2 was similarly transported from the huge virus reservoir generated in Wuhan province to southern USA, thence across the Atlantic to Portugal and further states to the east. On this model the primary in fall of the dust/virus-carrier depends on the jet-stream interaction with regional weather systems, causing incidence of SARS-CoV-2 cases in various countries/ states along this latitude belt. The notable case of Brazil on 31 March 2020-exceptionally outside the 30-50N belt-is proposed to be due to the Azores cyclonic system entraining part of the jet-stream west of Portugal into the south-westerly trade winds, when these winds penetrate to Brazil during spring-time.
Coronavirus • Epidemiology • Jet-stream • Dust-vector • Global winds
In earlier communications [1-3] we suggested that the primary infall of the SARS-CoV-2 virus probably occurred as a result of an inoculant contained in a cometary bolide that first came down into the troposphere in Wuhan in October/November 2019. It did not significantly spill out around the world until January-February 2020 when the virus spread to locations defining the striking pattern of Figure 1, foci of infection being manly distributed within a latitude belt 30-50N. The delays of incidence within this belt can be put down to auspicious wind conditions, primarily the requirement that local winds coincided with the Hadley cell turnover carrying the virus into the east-Asian subtropical jet-stream lying to the north of Wuhan's 30N latitude. Once the jet-stream is loaded, transport along a belt 30-50N latitude led to subsequent deposits of the virus at various other locations. The jet-stream circles the globe in ~3 days (moving at speeds of ~150-200 km/hr) and deposits initial inoculants of the virus relatively easily, being close to the down-welling flow at the convective Hadley-Ferrel cell boundaries. Deposits are close in time but can be well-spaced in longitude. Two or three episodes of lofting and deposition could occur on each occasion, but at different latitudes corresponding to the irregular N-S fluctuations.
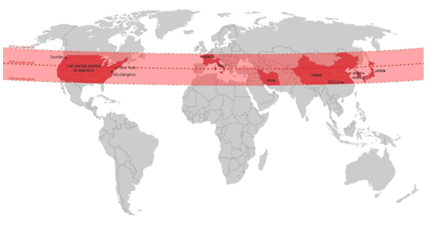
Figure 1: The 30-50N latitude band as the possible distribution of primary infall sites from an original source spread from China by the mid-latitude jet stream.
The Hadley and Ferrel convective cells are driven by the temperature gradient between the tropics and the temperate zone, but ocean-continent temperature differences add strong irregularity. Research into the into the physics of H-F cells has so far been restricted to modelling of the East-Asian section, covering the relatively stable region over north China and the tracking of two branches across North America (Figure 2). Regular satellite probing was started in 2018 by the Isolus mission and updates to the modelling are to be expected.
Figure 2: The Jet-stream from north China and Japan crosses the southern USA and over to Europe (source: NOAA).
Knowledge of global transport of infective agents is generally sparse. The Kawasaki disease is thought to cross the North Pacific Ocean on the jet-stream from north China. Bacteria and viruses travel the north Atlantic ocean, embedded in Saharan dust, the transcontinental transport of which long been known. Evidence of fall-out and rain-out of dust carrying viruses from south eastern USA and from the Sahara has also been described by Reche et al. [4] who found both dry and wet deposition of viruses in the Spanish Sierra Nevada.
We consider that a primary in-fall of virus at any particular locality would give rise to an almost simultaneous infection in large numbers of susceptible members of the population. After such an episode of initial infection further infections occur through a combination of person-to-person transmission within a community and winddependent transport of a virus-carrier (SARS-CoV-2 contaminated dust). It is the process of person-to-person infection that is being curtailed through the social distancing measures being taken, but subsequent deposits from the atmosphere remain possible as well as near-ground level transfers via incorporation in dust particles. We now set out to trace the global transport and deposition of virusbearing micro-dust, whether as urban dust, agricultural dust or desert dust.
The idea of an infective agent – virus or bacterium – being transferred over long distances by meteorological processes is not new. Precisely this process was discussed at length by Fred Hoyle and one of the present authors (NCW) in their 1979 book Diseases from Space [5]. The same book considered the possibility that seasonal influenza and other respiratory viruses had a reservoir in the troposphere that was periodically released [5].
Discussions of long-range transfer of microscopic organisms through atmospheric processes can be traced back to the middle of the nineteenth century. Charles Darwin [6] long ago reported that dust landing on vessels far out in the Atlantic Ocean in the southern trade-wind zone carried microscopic biological matter. His diary quotation which is of historical interest is as follows:
“Many scattered accounts have appeared concerning the dust which has fallen in considerable quantities on vessels on the African side of the Atlantic Ocean. It has appeared to me desirable to collect these accounts, more especially since Professor Ehrenberg’s remarkable discovery that the dust consists in considerable part of Infusoria and Phytolitharia. I have found fifteen distinct statements of dust having fallen; and several of these refer to a period of more than one day, and some to a considerably longer time.”
The transport of Saharan dust to the Amazon region carrying Darwin ’ s organisms (single-cell protozoans, in the main) occurs episodically, February to April, with huge tonnages involved-in total of order 10 Mt/yr. From mid-summer, when the Saharan dust switches to land in the Caribbean and in Florida, it is linked to seasonal respiratory problems [7,8]. It is thought that micro-organisms within cracks and crevices in the dust grains are the main source of the respiratory irritations and asthma attacks.
More recently it is recognized that the dispersal of bacterial and viral pathogens via tropospheric winds is a real phenomenon. The studies of Reche et al. [4] showed bacteria and viruses land on the surface in the Sierra Nevada mountain range (at heights of ~ 3 km) in large numbers ( ~ 800 million/m2/day). This flux was associated with winds from southern USA and winds from the Sahara on two separate days.
North-East China is recognised as the source of a fungal agent presumed to cause the Kawasaki disease and is carried in winds at 2-3 km altitude to reach Japan [9]. This unusual disease travels still further in winds across the Pacific Ocean to southern California at times that are seen to correlate with a phase of El Niño [10]. Intercontinental transport of bacteria and viruses associated with desert and agricultural dust by winds above 2 km altitude to the Sierra Nevada is also seen in Spanish studies [4].
Its route across the north Pacific varies with the ENSO (El Niño/La Niña) phase driven by periodic changes in the warm equatorial ocean current. This year's phase is not extreme; an El Niño Modoki (the yellow band), has been correlated with incidence of the Kawasaki disease in southern California. As the Kawasaki agent (perhaps a micro-fungus) makes this crossing, it is plausible that the SARSCoV- 2 virus carried on fine dust can similarly travel from NE China across the Pacific.
The ~10-wide jet-stream (Figure 2) varies in latitude and over days, with its mean location changing seasonally. Details of jetstream linkage to lower altitude regional meteorology are little known, so we have to rely on plausibility arguments with clues derived from maps of the detailed low-altitude wind patterns. The East-Asian section of the Subtropical Westerly Jet Stream is more stable and has been modelled to fit satellite data [11]. We take its speed to be 180 km/hr (50 m/s) from the study of Huang and Liu “Simulation of the East Asian Subtropical Westerly Jet Stream” [11].
Corona viruses have a limited lifetime in the open air dependent on sunlight and humidity. Tests of virus particles emanating from a cough or sneeze have been simulated by aerosol deposition on wetwiped surfaces, finding viruses are killed within minutes in sunlight. While aerial transmission of naked viruses could occur over short distances, it is when they are embedded in micron-sized dust particles that long-range transport can take place [8,12]. Bacteria too can arrive with the dust and this was found in transcontinental dust reaching the Sierra Nevada in Spain [4]. Analysis of dust trapped in filters of air-conditioning systems in north Italy shows the SARSCoV- 2 virus attached to urban dust particles. Martelletti and Martelletti [13] have reported the recovery of SARS-Cov-2 RNA in air filters in the north Italian city of Bergamo which was the centre of the major COVID-19 outbreak.
Survival on dust particles has also been known in the case of other single-stranded RNA viruses, including the virus causing Foot and Mouth Disease, as well as SARS-Cov-1 [14,15]. If the SARS-Cov-2 virus is likewise transported in viable form, the consequences for managing the current pandemic will be profoundly altered. A dust “vector” could well turn out to be a significant source of community spread of SARS-CoV-2, a process that has so far remained somewhat mysterious and difficult to track down. An investigation of this process will involve a systematic study of the lofting of dust by local winds and its modes of spread within the locality.
World Health Organization (WHO) reporting on 30 January initially showed 82 confirmed cases of COVID-19 in 18 countries outside of China. These cases were mostly in S-E Asia, the East and West Coasts of the US and some European centers.
Work by John Hopkins University’s Corona Virus Resource Centre identified countries at risk from the virus by considering the large number of international flights originating from Wuhan before lockdown took effect in China. Their results suggested greater scatter than appeared in the actual distributions reported by the WHO, including a number of locations outside the 30-50N latitude band, such as the UK. It is possible that a large number of directly transmitted cases went undetected for a while and these were widely distributed over many areas.
Outside of China, the number of cases began to rise in several European countries, parts of the USA and Iran in late February and early March.
Figure 3 shows the statistics for states in the USA that were reporting to the WHO, most of which developed their epidemics after internal flights had been stopped. COVID-19 clearly took off just after the US declaration of National Emergency on 12 March. Washington state and New York already had ~100 new cases per day, but in most other states the numbers rose rather little till about 18 March. This is consistent with containment of their initial few cases, till a sudden external source from the troposphere doused them all on dramatically around 7 March for 2 or 3 days. With 5 days gestation [16] and diverse reporting times, that led to extra new cases from 14 March, with person-to-person transmission building up case numbers from 19 March onwards.
Figure 3: Daily Confirmed Cases in selected US States. Source: Worldometers [17].
Massachusetts escaped, unlike adjacent New Jersey (and Pennsylvania), having its onset of new cases a few days later on 19 March (Figure 3). To the north, Canada (Figure 4) shows no event until 14 March. The southern states Texas and Florida show a stronger effect, consistent with the southerly location of the normal path of the jet-stream, while NE states show little impact. Like Texas and Florida, Mexico to the south shows growth around 14 March (Figure 4).
Figure 4: Daily new cases. Countries included with over 10 000 cases at 28 May 2020 on [17] (excluding China and the USA) and within or close to the 30-50°N zone. The blank elements are where numbers were mounting quickly, not relevant here. F, M denote months February and March. Countries are roughly ordered according to the date he cumulative number of confirmed cases reached 10 (Col.3) [18].
If an infectious cloud was carried in the jet-stream it might have doused the western states half a day earlier than the eastern states. In practice the cloud would be spread out along the jet-stream and its descent would be patchy, depending on large scale (km-depth) wind turnover. The half-day delay would not show up.
In Europe, the steep raises in cumulative cases due to person-toperson contact spreading makes it hard to discern any additional increases in central European countries. In central Europe, by late February the epidemic was well underway, 10 or more cumulative cases being observed in various countries (Figure 4, Col.3), likely to have been caused by person-to-person infections seeded by individuals who had travelled previously from infected areas. Figure 4 includes data for the 30 European and near Asian countries in or near the 30-50°N zone where the disease in early March had barely started, but exceeded 10,000 cumulative cases by the end of May. In Portugal, Israel, Egypt and Romania the numbers of new cases show a spurt about 14 March, whereas Turkey’s case-numbers rose on 15 March. The onset there is similar to Mexico, lagging by a day, consistent with the delay of a day while the jet-stream crossed the Atlantic. Differing speed in reporting cases in these countries may underlie the difference of a couple of days. The onward track of the jet-stream across to E Asia is apparent in the Ukraine, possibly Afghanistan (statistics incomplete). Egypt and Israel lie on the 30°N margin, suggesting the jet-stream was aligned with the Mediterranean ocean. On the northern boundary of the zone Poland showed a not dissimilar rise, but not Belarus. Thus Figure 4’s pattern of shaded-in countries does suggest effects from jet-stream deposition, but requires further study. Since person-to-person infection rates rise more in towns, while wind-borne dust infection impacts uniformly, geographically detailed studies could potentially distinguish the two.
From the third week of March 2020 there was one country conspicuously located outside the 30-50N belt-Brazils. Brazil’s case tally actually out-numbered some countries in 30-50N by the second week of April 2020.
Consider the statistics of new cases in Brazil (Figure 5) which show a similar pattern to the USA, with several days of sporadic new cases followed by rapid take-off. In Brazil’s case, the pattern and surge (~31 March) lags still further behind Texas-Mexico-Florida and Portugal-Turkey.
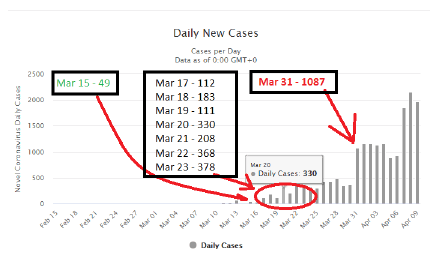
Figure 5: Daily new cases in brazil [1].
To explain the case of Brazil, we envisage part of the jet stream being entrained in the Trade Winds where they turn south off Portugal in the north Atlantic circulation. Around the 7th March (Figure 6) there was a strong cyclonic circulation between the Azores and Portugal. It takes approximately 7-9 days from SARS-CoV-2 virus arrival to registration of a case [16], plus 13-15 days for it to cross from Portugal (8000 km at 30 km/hr, but slower and erratic over the land mass than over ocean).
Figure 6: Wind pattern in Atlantic and South America on 7 March 2020 [20].
Figure 6 shows winds moving towards Brazil from the strong anticyclone near Portugal which lasted several days. We suggest this is how COVID-19 arrived so dramatically in Brazil. There was no effect in neighboring countries, Suriname and Guyana to the north, Uruguay and Argentina to the south, the latter two being in a different wind system.
The Trade Winds circulating in the North Atlantic have long been relied on by transatlantic sailors for both W-E and E-W crossing of the ocean. The southerly winds start from the Portuguese coast where the westerlies divide and cast off large-scale eddies and continue down the Saharan coast. They entrain Saharan dust, as was known to fall on southbound ships long before Charles Darwin’s record above. Once entrained in the southerly Trade Winds, large tonnages of this dust reach northern Brazil in (northern) spring-time, when the winds tend to dissipate over the continent, some joining the anti-clockwise South Atlantic wind system down the Brazilian coast. We envisage that part of the higher-level jet stream over Portugal became entrained in these Trade Winds that carried the virus onwards to Brazil.
It is noteworthy that East-Asian countries near China have not been badly hit by the COVID-19 pandemic, South Korea successfully suppressing an outbreak of 20 February. The data reported on the website show that Italy had an isolated case on 31 January, but not till 21 February did case numbers start to rise dramatically. Spain and France also had cases rising steeply from mid-February, likewise Iran, but not Afghanistan, Ukraine, Turkey and Greece (first cases only mid-March). West-coast USA had a first death 29 February and all US states had cases by mid-March. Brazil had its first case late (Sao Paulo, 26 February.) with person-to-person infection evidently starting up only from 11 March (Figure 5). While the first spreaders of the disease are expected to have been individuals from China or groups of Chinese travellers, the disease did not take off significantly in nearby countries, but did so strikingly in countries in the 30-50N belt. If carried by the mid-latitude jet-stream circling the globe in 4-5 days several kilometers high, the deposition will be patchy as it depends on entrainment of the jet stream in lower altitude weather systems. An infective dust cloud deposited/lofted above Wuhan in early February could drop the virus on Washington state, New York and N. Italy, France around 10 February. A second infective cloud may well have dropped virus-laden dust a month later around 7th March on the southern USA and Mexico as well as Portugal, Turkey, Ukraine etc. Part of this cloud was also entrained in the southerly Trade winds off the Portuguese coast, to be carried to Brazil (travel time around 14 days).
The SARS-CoV-2 virus was doubtless abundant in the urban and countryside environment around Wuhan in February-March. When the jet stream was positioned overhead and local winds favorable, virions attached to dust particles – as was the agent for the Kawasaki disease (section 3) – could even have been picked up from near ground level and transported around the globe. The lifetime within the surface of dust particles is presumed to be much longer than found in studies on metal or manufactured surfaces, so it would persist in infective state many times longer in the environment.
Previous studies have shown that long-distance intercontinental winds do indeed transport microorganisms around the globe, as free organisms or attached to dust particles. We hypothesize that dust plus virus transport on global winds could be an important element in the dynamics of the COVID-19 pandemic. This fits the patterns of global incidence, if we make the further assumption that the jetstream is caught up in the stable trade wind system off Portugal, and then transported to northern South America and down the Brazilian coast. Differing densities of population in between and within countries naturally play a crucial role in determining the epidemiology but also the widely varying levels of airborne dust blown from areas where the epidemic has taken hold.
Virology: Current Research received 187 citations as per Google Scholar report