Research Article - (2022) Volume 11, Issue 10
Received: 23-Sep-2022, Manuscript No. MBL-22-75803;
Editor assigned: 24-Sep-2022, Pre QC No. P-75803;
Reviewed: 28-Sep-2022, QC No. Q-75803;
Revised: 04-Oct-2022, Manuscript No. R-75803;
Published:
12-Oct-2022
, DOI: 10.37421/2168-9547.2022.11.346
Citation: Midelet, Graziella. “Evaluation of Bacterial DNA Extraction Methods on Marine Samples Integrating a Process Control.” Mol Bio
11 (2022):346.
Copyright: © 2022 Midelet G. This is an open-access article distributed under the terms of the Creative Commons Attribution License, which permits unrestricted use, distribution, and reproduction in any medium, provided the original author and source are credited.
Sources of funding :
This study was supported by a doctoral fellowship from Région Hauts-de- France and Pôle Métropolitain de la Côte d’Opale.
To investigate the microbial community in the marine environment by molecular approaches, it is important to extract DNA in sufficient quantity and purity. The presence of inhibitors in the samples can lead to false negative results or a loss of information, but can be highlighted by a process control in the experiments. We compared seven bacterial DNA extraction methods on marine samples: fish skin, gills and guts, mollusk meat, phytoplankton and zooplankton. A process control (Listeria monocytogenes) was added in half of the samples. The performance of the DNA extraction methods were compared to produce the more pure and concentrated DNA for qPCR amplification targeting the bacterial tufgene and the process control hlyAgene. The purity and concentration of DNA were determined by spectrophotometry assays. The results showed that the highest purity and concentration of DNA were obtained using the PowerBiofilm and PureLink Microbiome kits. The qPCR data confirmed these kits produced better bacterial DNA purity and concentration with higher amplification efficiency. In some samples, the presence of inhibitors was detected by qPCR targeting the hlyAgene, showing that the samples were heterogeneous contaminated with inhibitors. The DNA extracts are suitable for genetic downstream applications in the marine environment.
DNA extraction • Bivalve mollusk • Plankton • fish • Process control •PCR inhibitors • qPCR
The marine environment hosts an important bacterial diversity in planktonic form in the water column or in biofilms on biotic and abiotic surfaces. Even if the bacteria in association with animals can be simple epibionts that are not harmful for the animal or human health, pathogenic bacteria can also be identified. For example, the genus Vibrio, naturally occurring in the marine environment, can be isolated from phytoplankton [1], zooplankton [2], bivalve mollusks, fish and shrimps [3] demonstrating the presence of microorganisms at all trophic levels with potential transfers between marine species. In addition, some bacteria in the marine environment may carry antimicrobial resistance genes, posing an additional risk to human health. These resistance genes and more generally the microbial community occurring in the marine environment are still insufficiently identified. With recent advances in molecular biology, culture-dependent methods are gradually replaced by DNA-based techniques (PCR, qPCR) which are known to be faster, more robust and specific for bacterial identification. The 16S rRNA gene sequencing is one of the most used methods for bacterial quantification and identification, due to its presence in almost all bacteria and allowing identification up to the bacterial species. However, there are two major disadvantages to using this genetic marker for these analyses in complex samples. First, the 16S rRNA gene is multicopy, which poses a problem for the quantification of bacterial biomass, leading to its overestimation. Furthermore, this gene has similarities with the eukaryotic 18S gene, which can lead to false positive results because this gene is present in complex samples but also in the reagents used during DNA extraction and amplification [4]. For these reasons, other bacterial housekeeping genes must be considered for complex samples analysis as the tufgene coding for the elongation factor Tu. This gene exists in one or two copies, is well conserved between bacterial genomes and is more discriminative than the 16S rRNA gene [5]. In addition, one critical point in the molecular methods is the DNA extraction from complex samples. Therefore, bacterial DNA must be extracted in sufficient quantity and purity with a reduced amount of inhibitors to carry out subsequent analysis (NF EN ISO 22174:2005 and NF EN ISO 20837:2006 standards). This represents a particular challenge for samples from the marine environment. In fact, different nature of compounds are extracted at the same time and may interfere during the DNA amplification by direct binding with DNA or targeting DNA polymerase [6]. The presence of inhibiting substances in the marine environment has been demonstrated, where compounds such as polyphenols, humic and fumic acids or glycogen were isolated and are known to be one of the most common causes of PCR failure, leading to false negative results or incomplete bacterial identification. To control the presence of inhibitors compounds, diverse PCR controls can be used as the positive process control, which allows the identification of false negative results [7] (NF EN ISO 22174:2005 standard). To our knowledge, there were little works comparing DNA extraction methods from complex marine samples (phytoplankton, zooplankton, bivalve mollusk and fish) and none of them had included a process control. For example, the DNeasy PowerSoil kit (Qiagen) has been used to extract the DNA from fish gill and intestine samples with a view to the identification of a wide variety of bacterial taxa [8] and the DNeasy PowerBiofilm kit (Qiagen) allowed to extract a significant amount of DNA from phytoplankton samples [9]. It was necessary to have a standardized DNA extraction method, with a process control, applicable to different nature of marine samples to have a good DNA quality and quantity for the DNA-based techniques. The aim of our study was to evaluate the method resulting in a more purified bacterial DNA with the addition of a positive process control, a L. monocytogenes strain (as described in the NF EN ISO 22174:2005 standard). This strain has been added at the starting point of sample analysis and detected by specific qPCR targeting the hlyAgene. We compared DNA extraction techniques using six commercial kits and a method of thermal shock lysis with no DNA purification step as a control method (as described in the NF EN ISO 20837:2006 standard) on six natures of samples: phytoplankton, zooplankton, bivalve mollusk meat, fish skin, fish gills and fish guts. We estimated the purity and concentration of the total DNA by spectrophotometry (as described in the NF EN ISO 20837:2006 standard) and we assessed the bacterial DNA amplification performance (as described in the NF EN ISO 22118:2011 standard) by qPCR targeting the tufgene.
Marine samples
Flatfish (Pleuronectes platessa), bivalve mollusks (Aequipecten opercularis), zooplankton and phytoplankton samples were collected by the French research institute for exploitation of the sea (Ifremer) in the English Channel during the ecosystem campaign CGFS (Channel Ground Fish Survey) in October 2019, on the Thalassa oceanographic ship [10]. Protocols of the Ifremer survey are currently being evaluated by the Ifremer and are validated by the ICE IBTS International Group [11]. In addition, survey’s PIs received training about animal well-being and ethics. At the end of the campaign, we recovered the samples frozen at -20 °C on board the vessel by Ifremer for analysis.
Sample preparation
We analyzed three samples of fish, phytoplankton and zooplankton. The three samples of bivalve mollusks analyzed were made of pools of ten individuals per sample. To study fish skin, we swabbed both surfaces of each fish using a sterile sponge soaked with physiological water. The homogenate was recovered and we added 20 % (v/v) of glycerol. The fish guts and gills, and the bivalve mollusk meat were extracted, diluted by half with physiological water (m/m), mixed and supplemented with 20 % (v/v) of glycerol. Phytoplankton and zooplankton samples were centrifuged for 15 min at 4 500 × g at 4 °C. The pellet was resuspended in 10 mL of sterile physiological water. This step was performed twice before adding 20 % (v/v) of glycerol.
Positive process control preparation
As defined in the NF U47-600-1:2015 and NF EN ISO 22174:2005 standards, the positive process control consisted of the addition of a target microorganism in the samples which were treated in the same way as the other samples treatment and analysis. To this end, we inoculated half of the samples with Listeria monocytogenes strain B3PA-Lm1 (ANSES collection, Boulogne sur mer, France) [12]. Listeria were inoculated on Tryptic Soy Agar with 0.6 % Yeast extract (TSAYe) agar and incubated at 37 °C for 24 h and then, suspended in sterile physiological water. We added the Listeria suspension to the samples to obtain a final concentration of approximately 108 CFU.mL-1.
DNA extraction methods
One mL of each sample was centrifuged at 10 000 × g for 5 min and the pellet was washed with one mL of sterile physiological water. Bacterial DNA was extracted from the pellets with six commercial kits according to the manufacturer’s instructions with minor modifications: BT (DNeasy Blood and Tissue kit), PB (DNeasy PowerBiofilm kit), PS (DNeasy PowerSoil kit), PM (PureLink Microbiome DNA Purification kit), WG (Wizard Genomic DNA Purification kit) and GS (GenElute Stool DNA Isolation kit) and a lysis by thermal shock (TS) (Table 1). All DNA samples were stored at -20 °C until analysis. For the DNA extraction of plankton samples with the BT kit, we centrifuged one mL of prepared samples at 10 000 × g for 5 min and the cell pellets were suspended in 800 μL of ATL Buffer. This suspension was transferred to the bead tubes to promote the disruption of the tough cell walls as recommended in the NF EN ISO 20837:2006 standard, then vortexed and incubated for 5 min at 56 °C. This step was performed twice. We added 80 μL of Proteinase K, incubated at 56 °C for 2 h then centrifuged for 1 min at 5 000 × g and the supernatant was transferred into a new tube. Afterwards, we followed the manufacturer’s instructions with a modification: the final elution step was performed with 80 μL of AE Buffer.
| Extraction method | Supplier information | Abbreviation | Principle | Cell lysis | DNA elution | Manufacturer's protocol |
|---|---|---|---|---|---|---|
| DNeasy Blood and Tissue Kit | Qiagen, Hilden, Germany | BT | (Mechanical)* - Heat - Chemical | 180 µl Buffer ATL | 80 µl Buffer AE | "Purification of total DNA from animal tissues" |
| DNeasy PowerBiofilm Kit | Qiagen, Hilden, Germany | PB | Mechanical - Heat - Chemical | 350 µl Buffer MBL | 80 µl Buffer EB | "Vortex adapter protocol" |
| DNeasy PowerSoil Kit | Qiagen, Hilden, Germany | PS | Mechanical - Heat - Chemical | Buffer contained in the PowerBead tubes | 80 µl Buffer C6 | Manufacturer's instructions |
| PureLink Microbiome DNA Purification Kit | Invitrogen, Carlsbad, USA | PM | Mechanical - Heat - Chemical | 800 µl of Buffer S1 + 100 µl of Buffer S2 (enhancer) | 80 µl Buffer S6 | "Rectal or environment samples" |
| Wizard Genomic DNA Purification Kit | Promega, Madison, USA | WG | Heat - Chemical | 600 µl Nuclei Lysis solution | 80 µl DNA Rehydration Solution | "Isolating genomic DNA from animal tissue" |
| GenElute Stool DNA Isolation Kit | Sigma, Saint-Louis, USA | GS | Mechanical - Chemical | 1 ml Lysis Buffer L + 100 µl Lysis Additive A | 80 µl Buffer B | Manufacturer's instructions |
| Thermal Shock lysis | - | TS | Heat | (100 °C for 10 min and -80°C for 10 min) : three cycles | 600 µl physiological water | - |
Purity and concentration of total DNA
The DNA concentration and purity (estimated by the A260nm/280nm ratio) were measured by spectrophotometry with a DS-11 spectrophotometer (Denovix, Wilmington, USA), as explained in the NF EN ISO 20837:2006 standard. DNA extracts were considered sufficiently pure if the A260/280nm ratio values ranged from 1.8 to 2.0.
Quantitative PCR method
Bacterial DNA was amplified by qPCR targeting the tufgene [13] (Table 2). The reaction volume of 25 μL contained 12.5 μL of TB Green® Premix ExTaq II (Takara Bio, Kusatsu, Japan), 0.2 μM of each primer (Eurobio, Les Ulis, France) and 2 μL of template DNA. DNase-free water was added to complete the total reaction volume. Thermal cycling consisted of initial denaturation at 95 °C for 30 sec, followed by 35 amplification cycles of 95 °C for 10 sec and 60 °C for 1 min. For the quantification of our process control, we targeted the hlyAgene, existing in monocopy and coding for listeriolysin O [14]. The final volume of 50 μL contained 25 μL of Platinum qPCR SuperMix-UDG (Invitrogen, Carlsbad, USA), 0.1 μM of each primer Nov-F and Nov-R (Eurobio), 0.05 μM of the TaqMan Nov-probe (Eurobio), 5 μL of DNA and DNase-free water to complete the final reaction volume. The qPCR program consisted of initial denaturation at 95 °C for 10 min, then 40 cycles of 95 °C for 20 sec and 60 °C for 1 min. All qPCR reactions were performed with a LightCycler© 480 thermocycler (Roche, Rotkreuz, Switzerland). Quantification cycle (Cq) values were automatically calculated by the LightCycler© software using the second derivative method. For these two qPCR reactions, we used DNase-free water as negative PCR control as described in NF EN ISO 22174:2005 standard and L. monocytogenes Lm1 DNA as positive PCR control and for the standard curves. This Listeria DNA was extracted using the DNeasy Blood & Tissue kit (Qiagen) according to the manufacturer’s instructions.
| Target gene | Primer and probe names | Nucleotide sequence 5' – 3' | Amplicon size | Reference |
|---|---|---|---|---|
| tuf | tuf-F | ACHGGHRTHGARATGTTCCG | 299 bp | Tanaka et al. 2010 |
| tuf-R | GTTDTCRCCHGGCATNACCAT | |||
| hlyA | Nov-F | TGCAAGTCCTAAGACGCCA | 113 bp | Nogva et al.2000 |
| Nov-R | CACTGCATCTCCGTGGTATACTAA | |||
| Nov-Probe | FAM-CGAAAAGAAACACGCGGATGAAATCG-TAMRA |
Data analysis
All experiments were replicated three times (three independent samples per nature of marine samples) without and with the process control. The non-parametric Kruskal-Wallis test was used to evaluate the effectiveness of DNA extraction kits and the DNA purity and concentration by Statgraphics centurion V18 software (Sigmaplus, Neuilly-sur-seine, France). Differences were considered statistically significant at p < 0.05. As explained in the NF EN ISO 22118:2011 standard, we calculated the false-negative rate for each DNA extraction method using the following formula:
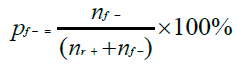
nf- being the number of misclassified known positive samples and nr+ the number of real positive test results.
For all extraction methods, the DNA concentrations weren’t significantly different in the samples with and without the process control except in the fish skin, gill and guts samples with the DNeasy Blood and Tissue (BT) kit (Figure 1). The DNA concentrations were mainly higher with the thermal shock lysis method (TS) than the extraction kit methods for all marine samples. In fact, for the phytoplankton and zooplankton samples, the DNA concentration varied between 1 and 12 ng.μL-1 with the commercial extraction kits, but was mostly higher for the TS method, with concentrations ranging from 8 to 41 ng.μL-1 for the phytoplankton samples and from 8 to 120 ng.μL-1 for the zooplankton samples (Figures 1A-B). For the bivalve mollusk meat, we observed higher DNA concentrations with the Wizard Genomic DNA purification (WG) kit (between 67 and 163 ng.μL-1) and the TS method (between 350 and 635 ng.μL-1) while we extracted fewer DNA (between 0.4 and 95 ng.μL-1) with the other extraction kits (Figure 1C). For the fish skin samples, the DNA concentrations varied from 1 to 44 ng.μL-1 with all extraction methods (Figure 1D). For the fish gill samples, the highest DNA concentrations were obtained with the DNeasy PowerBiofilm (PB) kit (between 60 and 86 ng.μL-1), the WG kit (between 91 and 269 ng.μL-1) and the TS method (between 68 and 138 ng.μL-1) (For all extraction methods, the DNA concentrations weren’t significantly different in the samples with and without the process control except in the fish skin, gill and guts samples with the DNeasy Blood and Tissue (BT) kit (Figure 1). The DNA concentrations were mainly higher with the thermal shock lysis method (TS) than the extraction kit methods for all marine samples. In fact, for the phytoplankton and zooplankton samples, the DNA concentration varied between 1 and 12 ng.μL-1 with the commercial extraction kits, but was mostly higher for the TS method, with concentrations ranging from 8 to 41 ng.μL-1 for the phytoplankton samples and from 8 to 120 ng.μL-1 for the zooplankton samples (Figures 1A-B). For the bivalve mollusk meat, we observed higher DNA concentrations with the Wizard Genomic DNA purification (WG) kit (between 67 and 163 ng.μL-1) and the TS method (between 350 and 635 ng.μL-1) while we extracted fewer DNA (between 0.4 and 95 ng.μL-1) with the other extraction kits (Figure 1C). For the fish skin samples, the DNA concentrations varied from 1 to 44 ng.μL-1 with all extraction methods (Figure 1D). For the fish gill samples, the highest DNA concentrations were obtained with the DNeasy PowerBiofilm (PB) kit (between 60 and 86 ng.μL-1), the WG kit (between 91 and 269 ng.μL-1) and the TS method (between 68 and 138 ng.μL-1) (Figure 1E). The DNA concentrations for the other four commercial kits ranged from 7 to 67 ng.μL-1. Great concentrations of extracted DNA were observed with the WG kit (between 11 and 76 ng.μL-1) and the TS method (between 162 and 617 ng.μL-1) for the fish gut samples (Figure 1F).). The DNA concentrations for the other four commercial kits ranged from 7 to 67 ng.μL-1. Great concentrations of extracted DNA were observed with the WG kit (between 11 and 76 ng.μL-1) and the TS method (between 162 and 617 ng.μL-1) for the fish gut samples (Figure 1F).

Figure 1. DNA concentration (ng/μL) extracted from six marine samples (n=3 samples with process control and 3 samples without process control) according to the seven extraction methods. A) Phytoplankton. B) Zooplankton. C) Bivalve mollusk meat. D) Fish skin. E) Fish gills. F) Fish guts. (BT: DNeasy Blood and Tissue kit; PB: DNeasy PowerBiofilm kit; PS: DNeasy PowerSoil kit; PM: PureLink Microbiome DNA Purification kit; WG: Wizard Genomic DNA Purification kit; GS: GenElute Stool DNA Isolation kit; TS: Thermal Shock lysis. (օ): samples with process control; (×): samples without process control.)
We also estimated the DNA purity considering the A260/280 nm ratio: DNA was considered pure if the ratio value was between 1.8 and 2.0 (Figure 2). For the phytoplankton samples, DNA with the highest purity was extracted using the PM and WG kits (Figure 2A). For the zooplankton samples, we also observed pure DNA with the PM kit (Figure 2B). DNA extracted from the bivalve mollusk meat samples with PS kit was the purest (median ratio = 1.71) compared to the other extraction methods (Figure 2C). For the fish skin samples, we obtained DNA with great purity with the PM kit, the GS kit and the PB kit (median ratio = 1.74) (Figure 2D). Concerning the fish gill samples, almost all extraction methods allowed us to extract pure DNA, except for the BT and TS methods whose ratio values were slightly below 1.8 (Figure 2E). For the fish gut samples, no extraction method made it possible to obtain pure DNA with a ratio between 1.8 and 2.0 (Figure 2F). However, some kits resulted in DNA with ratio values slightly lower than 1.8, like the PB kit (median ratio = 1.74), the PM kit (median ratio = 1.66), the WG kit (median ratio = 1.78) or slightly higher than 2.0 like the GS kit (median ratio = 2.06). Finally, for all the samples, the TS method leaded to DNA with ratios values lower than 1.8.

Figure 2. DNA purity using A260/A280 ratio obtained with the seven extraction methods for six marine samples (n=3 samples with process control and 3 samples without process control). Median values are indicated by the line in the box plots. The dots represent the outliers. The grey area includes the ratio values between 1.8 and 2. A) Phytoplankton. B) Zooplankton. C) Bivalve mollusk meat. D) Fish skin. E) Fish gills. F) Fish guts. (BT: DNeasy Blood and Tissue kit; PB: DNeasy PowerBiofilm kit; PS: DNeasy PowerSoil kit; PM: PureLink Microbiome DNA Purification kit; WG: Wizard Genomic DNA Purification kit; GS: GenElute Stool DNA Isolation kit; TS: Thermal Shock lysis).
The Cq values for the qPCR targeting the tufgene in the samples with and without the process control are shown in the Figure 3. For samples with the process control, if the Cq value was below 25, we validated a good amplification efficiency of DNA extracted by the DNA extraction method. This Cq value corresponds to a copy number of the tufgene of approximately 1.00 × 10⁹ copies.mL-1 (data not shown). For all the samples with the process control, we observed better amplification efficiencies for the PB and PM kits, with Cq values less than 25. Furthermore, DNA extracted from the phytoplankton and zooplankton samples with the process control using the BT kit also showed great amplification results (Cq values less than 25) than the four other natures of samples (Cq values ranged from 26 to 35) (Figure 3A-B). For the phytoplankton samples without the process control, lowest Cq values (around 25) were observed with the BT, PB and PM kits (Figure 3A). DNA extracted with the BT and GS kits resulted in better amplification of the tufgene for the zooplankton samples without the process control (Cq values less than 30) (Figure 3B). For the bivalve mollusk meat samples without the process control, we observed lower Cq values with the PB, PM and GS kits (Cq values less than 30) (Figure 3C). The tufgene was weakly amplified from DNA extracted from fish skin samples without the process control, with Cq values above 30 for all extraction methods (Figure 3D). For the fish gill samples without the process control, we observed better amplification for the DNA extracted with the BT, PB and WG kits (Cq values less than 30) (Figure 3E). Concerning the fish gut samples without the process control, all Cq values were high, but we observed a better amplification of the bacterial gene (Cq values below 32.5) for the DNA extracted with the PB kit (Figure 3F).

Figure 3. Cq values for tuf qPCR from the seven DNA extraction methods tested on six marine samples (n=3 samples with process control and 3 samples without process control). A) Phytoplankton. B) Zooplankton. C) Bivalve mollusk meat. D) Fish skin. E) Fish gills. F) Fish guts. (BT: DNeasy Blood and Tissue kit; PB: DNeasy PowerBiofilm kit; PS: DNeasy PowerSoil kit; PM: PureLink Microbiome DNA Purification kit; WG: Wizard Genomic DNA Purification kit; GS: GenElute Stool DNA Isolation kit; TS: Thermal Shock lysis. (օ): samples with process control ; (×): samples without process control.)
In order to verify the absence of amplification inhibitors in our DNA extracts, a second qPCR targeting the hlyAgene, specific to our process control, was carried out (Figure 4). If the Cq value was below 20, we validated a good amplification efficiency of DNA extracted by the DNA extraction method. This Cq value corresponds to a copy number of the hlyAgene of approximately 1.00 × 10⁸ copies.mL-1 (data not shown). The hlyAgene was not quantified in any sample not containing the positive process control, these samples not being naturally contaminated with L. monocytogenes. The lowest Cq values were obtained with both PM and PB kits for all samples containing the positive process control, providing quantification cycle values lower than 20. By plotting these Cq values on a standard range (data not shown), we observed that by adding approximately 108 CFU.mL-1 of L. monocytogenes to our initial samples, we were able to quantify approximately 109 copies of the hlyAgene per mL of DNA using these two kits. On average, for all samples, we quantified the hlyAgene to around 108 copies.mL-1 with the BT kit, to around 107 copies.mL-1 with the PS, WG and GS kits, and to around 106 copies.mL-1 with the TS method. In contrast, the process control was not quantified in some samples (Cq values near of 40), especially in some phytoplankton, bivalve mollusk meat and fish guts DNA extracted with the WG kit (Figures 4A-C-F), showing the potential presence of qPCR inhibitors in these samples. This lack of quantification was also observed with DNA extracted from a bivalve mollusk meat and two fish gut samples with the BT kit, from a fish skin and a fish gut samples with the TS method, and in a DNA sample extracted from fish guts with the PB kit. We therefore calculated the average false-negative rates for each DNA extraction method, which were 18% for the WG kit, 10% for the BT and TS methods, 5% for the PB kit and 0% for the other extraction techniques.

Figure 4. Cq values for hlyA qPCR from the seven DNA extraction methods tested on six marine samples with the process control (n=3 samples with process control). A) Phytoplankton. B) Zooplankton. C) Bivalve mollusk meat. D) Fish skin. E) Fish gills. F) Fish guts. (BT: DNeasy Blood and Tissue kit; PB: DNeasy PowerBiofilm kit; PS: DNeasy PowerSoil kit; PM: PureLink Microbiome DNA Purification kit; WG: Wizard Genomic DNA Purification kit; GS: GenElute Stool DNA Isolation kit; TS: Thermal Shock lysis.)
Six DNA extraction kits and a thermal shock lysis method were tested and compared for their efficiency resulting in a more purified bacterial DNA from diverse marine samples representing a food web in order to carry out molecular biology and genomic studies. The addition of a L. monocytogenes strain, as a positive process control (as described in the NF EN ISO 22174:2005 standard), allows to control a good DNA extraction efficiency and the absence of PCR inhibitors. The addition of this strain in the samples didn’t significantly impact the final DNA concentration in the samples. The thermal shock lysis method (TS) and the Wizard Genomic kit (WG) yielded higher DNA concentrations for almost all samples based on spectrophotometry analysis. Compared to the other extraction kits, these two methods do not have a physical lysis step with beads but mainly a thermal shock lysis and a chemical lysis. These two cell lysis methods visibly had more impact on the disruption of cell membranes in our samples and released more cell content than the other extraction kits. Moreover, based on the A260/280 nm ratio, the DNA samples extracted with these two methods were of lower purity for most samples compared to the other DNA extraction techniques. The ratio values not being in the range 1.8 - 2.0 could therefore be explained by the presence of contaminants. Indeed, the presence of these contaminants can be confirmed by the absence of amplification of our process control in some DNAs extracted from phytoplankton, bivalve mollusk meat, fish skin and gut samples with the TS and WG methods, which did not completely eliminate PCR inhibitors during the DNA extraction process. Both of these DNA extraction methods produced higher rates of false negative results than the other methods. These data suggest that DNA was degraded during the extraction process or a significant presence of PCR inhibitors and contaminants. This might be explained by the fact that these two techniques do not have a DNA purification step on a spin column, unlike the other commercial kits tested in this study. The presence of inhibiting substances in the marine environment has been demonstrated, where compounds such as polyphenols, humic and fumic acids or glycogen were isolated and are known to be one of the most common causes of PCR failure [6]. Furthermore, concerning samples for which little DNA was extracted, a poor A260/280 ratio can also be explained by the detection limit of DNA in spectrophotometry. Indeed, according to the manufacturer's information (Denovix), inaccurate ratios can be observed for nucleic acid samples with concentrations below 10 ng.μL-1, which was the case for phytoplankton and zooplankton samples. In comparison, the PowerBiofilm kit (PB) and the PureLink Microbiome DNA Purification kit (PM) yielded a lower DNA concentration, but better purity for most samples. These two kits contain an initial physical cell lysis with beads, which is recommended for optimal cell lysis according to the NF EN ISO 20837:2006 standard, and a DNA purification step on a spin column. The use of these spin columns allows DNA to be retained on the resin membrane and PCR inhibitors to be eliminated by membrane washing steps, unlike traditional DNA extraction methods such as phenolchloroform extraction [15]. These nucleic acid purification step resulted in a more purified DNA, with a reduction of observable effects of PCR inhibitors on PCR inhibition controls according to the NF EN ISO 20837:2006 standard. This leaded better tuf and hlyAgenes amplification results, demonstrating that the two kits would be the most suitable for extracting bacterial DNA from the samples tested in this study. As shown by [16] a physical lysis by bead-beating leads to better quality DNA compared to heat shock or chemical lysis. Indeed, it has been shown that the PowerBiofilm kit enabled the extraction of pure DNA in good quantity from seawater samples, which allowed the amplification of the total bacterial flora by PCR [17]. On the other hand, we observed an absence of amplification for a DNA extracted from a fish gut sample with the PB kit, showing the heterogeneity in the presence and/or concentration and/ or nature of contaminants in the samples. In addition, DNA samples extracted from the fish guts were poorly amplified compared to other marine samples. The lack of studies on fish guts leads to several hypotheses that can explain this observation compared to the other samples: either the DNA extraction methods were less efficient, either the nature and/or concentration of bacteria were less important either the inhibitors were more present.
This work illustrated the complexity to define a suitable, standardized and optimized bacterial DNA extraction method for various natures of marine samples. Moreover, we have highlighted the need to incorporate a process control in the experiments in order to monitor the presence of PCR inhibitors. DNA extraction methods differed in their lysis and purification approaches. The extraction technique should be chosen considering the sample and the presence of environmental contaminants. We believed that the PowerBiofilm and PureLink Microbiome kits were the most relevant for extracting bacterial DNA from marine ecosystem complex samples, despite the presence of PCR-inhibiting compounds. Indeed, the presence of inhibitors can reduce the amplification efficiency of the extracted DNA, and can thus interfere with the success of molecular analyses such as PCR, qPCR or sequencing. In order to limit the action of these inhibitor compounds after the DNA extraction, we recommend the addition of facilitators such as bovine serum albumin (BSA) or polyethylene glycol during the PCR reaction, as described in the NF EN ISO 20838:2006 standard and in the study conducted by [18]. In addition, dilution of the DNA extracts can be achieved to dilute the PCR inhibitors and thus minimize their impact, but will be accompanied by a decrease in the sensitivity of the amplification reactions. In conclusion, we recommended a standardized use of the PowerBiofilm and PureLink Microbiome kits for optimized molecular studies of a marine food web, such as the monitoring of virulence or antimicrobial resistance genes of interest.
The authors declare that the research was conducted in the absence of any commercial or financial relationships that could be construed as a potential conflict of interest.
This study was supported by a doctoral fellowship from Région Hauts-de- France and Pôle Métropolitain de la Côte d'Opale. The Structure Fédérative de Recherche (SFR) Campus de la Mer has also financially supported this work.
We would like to thank the IFREMER institute for providing us with marine samples used.
Google Scholar, Crossref, Indexed at
Google Scholar, Crossref, Indexed at
Google Scholar, Crossref, Indexed at
Google Scholar, Crossref, Indexed at
Google Scholar, Crossref, Indexed at
Google Scholar, Crossref, Indexed at
Google Scholar, Crossref, Indexed at
Google Scholar, Crossref, Indexed at
Google Scholar, Crossref, Indexed at
Google Scholar, Crossref, Indexed at
Google Scholar, Crossref, Indexed at
Google Scholar, Crossref, Indexed at
Google Scholar, Crossref, Indexed at
Google Scholar, Crossref, Indexed at
Google Scholar, Crossref, Indexed at
Google Scholar, Crossref, Indexed at
Google Scholar, Crossref, Indexed at
Molecular Biology: Open Access received 607 citations as per Google Scholar report