Research - (2022) Volume 11, Issue 12
Received: 28-Nov-2022, Manuscript No. MBL-22-81609;
Editor assigned: 30-Nov-2022, Pre QC No. P-81609;
Reviewed: 14-Dec-2022, QC No. Q-81609;
Revised: 21-Dec-2022, Manuscript No. R-81609;
Published:
30-Dec-2022
, DOI: 10.37421/2168-9547.2022.11.353
Citation: Abbas, Fatima Musbah, Zehbah Ali Al Ahmad, Rehab Omer Elnour Elgezouly and Abubaker Elsheikh Abdelrahman. “Characterization
of Pores Size, Surface area and Fractal Dimensions of Activated Carbon Powder Prepared from Date Palm Leaves.” Mol Bio 11 (2022):353.
Copyright: © 2022 Abbas FM, et al. This is an open-access article distributed under the terms of the Creative Commons Attribution License, which permits unrestricted use, distribution, and reproduction in any medium, provided the original author and source are credited.
Activated carbon (AC) powder was prepared by the KOH activation of date palm leaves (Phoenix dactylifera L). Date palm leaves (DPLs) were pre-carbonized at low temperatures, ground to a fine green powder and activated with 0%–7% KOH (by weight), before being carbonized at 700°C in a nitrogen atmosphere. The activated carbon powders (ACPs) produced was characterized in terms of pore size, surface area and fractal dimensions of pores. The measurements were made using nitrogen adsorption properties (BET), small angle X-ray scattering (SAXS) and scanning electron microscope (SEM) techniques. Results indicate that the pore structure of the ACs is mainly composed of mesoporous micropores of (0.88-17.0 nm) (BET) and (8.0-10.2 nm) (SAXS) with a relatively small surface area (SBET) of (0.37–2.0222 m2/g) and (SSAXS) of (0.8–0.6111 m2/g) respectively. The BET and SAXS data were of the same order of magnitude and the pore size destruction was close to that treated with 1% KOH. The fractal dimensions of pores are in the range of 1.62 to 1.7, which is like the particle sizes of carbon black, according to the visual inspection and gray-level histogram of the internal structure. These results indicate a lack of KOH concentration does not improve the surface areas of the ACs powder. Probably the KOH concentration is too high, but AC powders with micropores and mesopore structures could be used as a filter for scavenging contaminants from liquid and gases.
Activated carbon • Date palm leaves • KOH • Pore size • Surface area • Fractal dimensions
Extensive attention has been given to the sustainable production of date palm leaves (Phoenix dactylifera L.) in the agriculture-based economy of Saudi Arabia, with an annual production of 1.5 million tons of date palm and more than 31 million palm trees. Date palm leaves are lignocellulosic material composed of cellulose, hemicelluloses and lignin as the main component. It has been used as an indicator of heavy metal atmospheric pollution in arid and semi-arid environments [1]. Activated carbon (AC) refers to a range of porous materials manufactured to show an exceptionally high internal surface area and pore structure [2]. Activated carbon containing micro pores or medium pores is widely used as an adsorbent for chemical contamination from liquids or gases [3,4] double-layer capacitors, high-performance super capacitors and capacitor electrode [5-7]. The usefulness of activated carbon is due to increases in its applications in different fields, such as catalysts and catalyst supports in a variety of industrial and environmental applications [8].
Therefore, various biomass materials have been used to prepare activated carbon such as Lignocelluloses material [9-11] and rubber-seeds-shells have been used to prepare activators carbons [12]. The chemical activation process is widely used to prepare activated carbon, which involves soaking a carbonaceous material with dehydrating agents to facilitate surface properties at relatively stable temperatures [13,14]. So far, chemical activation modified by potassium hydroxide (KOH) has been tested thoroughly for biomass activation carbon with high surface area such as pistachio-nut shells [15] PAN [16] sewage sludge [17] sugarcane molasses [18] and grape seeds [19]. It was found that the pore volume can be controlled by selecting activation processes [20] and carbonized temperature [21,13]. Moreover, Li-Yeh H and T Hsisheg [22] activate another precursor from bituminous coal treated with KOH and found that the AC produced exhibits a high surface area of 3300 m2/g which is considered higher than those of commercial activated carbon from biomass coconut shell of 1500 m2/g [23]. Nitrogen gas separation technology and small angle X-ray scattering techniques have been applied to characterize the pore size distribution, pore volume and surface area using the Brunauer- Emmett-Teller (BET) method [24] and Porod's law and Guinier’s expressions respectively [25]. The surface structure and the fractal dimensions of pores were analyzed by the scanning electron microscope and the fractal dimensions of pores were also investigated and the results were compared with review data.
Sample preparation
Date palm leaves (Phoenix dactylifera L) were collected near rural areas, urban areas and cities in southern Saudi Arabia. Raw palm leaves were cut into small pieces and thoroughly washed with hot water to remove dust particles and then the leaves were dried at 100°C for four (4) hours, before being pre carbonized in a vacuum chamber at 280°C, to cause them to shrink and break the palm leaves microstructure and releasing non carbon content [26].
The pre-carbonized date palm leaves (PCDPLs) were of different colors, medium, brown and dark brown (5–10%, 60% and 30%) respectively. Since they were located at distances from the heat source, they were burned to different degrees depending on whether they were in the inner or outer furnace. The PCDPL produced was converted into a grain powder by a ball milling process.
Ball Milling Process the PCDPLs were milled to fine green powder (GP) using the Pascal 9V5 mill equipment (model 1679-V5-A). The quantity of PCCB was 50 g for each milling set up conducted for 20 hours (h). Green powders produced are stored in clean self-sealing plastic bags in silica gel until used.
Particle Size Distribution Measurement The particle size distribution of the green powder produced was measured by operating the Microtrac-X100 machine. The operating principle of the Microtrac-X100 machine is based on the photo-extinction phenomenon and Stokes law sedimentation theory.
X-Ray Diffraction (XRD) The XRD diffraction profile of the PCDPL and green powder (GP) using an X-ray diffract meter (Bruker Advanced Solution AXS D8) operated at 40 kV and 30 mA, with Cu Kα, X-ray radiation and wavelength of 1.54 Å. The pellets were scanned at 2Ɵ (diffraction angle) between 5° and 60°, with a step size of 0.04°.
KOH activation and carbonization process
The GP produced was sieved to pass through a 53-micron sieve. About 250g of the PCDPLs fine powder was soaked in 1000 ml KOH, having concentrations of 0%, 1%, 2%, 3%, 4%, 5%, 6% and 7% KOH (by weight). The mixture was magnetically stirred for one hour and kept for 16 h before being dried in an oven at 100°C for 24 hours (h). The dried mixture was milled again for 5 h, before carbonized at 700°C in a nitrogen atmosphere using a multistep heating profile in Vulcan Box Furnace (3-1750). The heating profile was started at 1oC/min from room temperature to 375˚C, where it was held for 1 hour before heating was resumed at 3˚C/min to 700˚C where it was finally held for 5 minutes. Then the system allowed cooling down to room temperature. The obtained AC powders were washed thoroughly with hot distilled water until a pH concentration of 5 and dried again at 100˚C for four hours.
Characterization of activated carbon powder
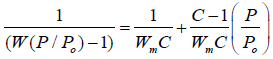
Nitrogen adsorption isotherms: N2 adsorption was carried out, using a unit of Micromeritics ASAP 2010 at 77oK. The N2 absorption rate was calculated by the Brunauer-Emmett-Teller (BET) and Dubinin-Radushkevish (D-R) relationship [25] with software analysis to provide the adsorbed amounts of the adsorbate or system pressure changes as a function of time. To evaluate the kinetic separation efficiency of nitrogen, the adsorption rates for nitrogen were taken separately at 298oK and a constant starting pressure of 1 min. The overall kinetic separation efficiency was calculated by dividing the adsorption capacity of nitrogen by approximately 1 min, in amount of gas adsorbed at (P/ Po) values ranging from 0 to 1 [24]. Surface area was calculated by means of the BET standard equation (1).
 (1)
(1)
Where P is the pressure of gas equilibrium in a sample, Po is saturation
pressure, W is the amount of gas adsorbed, C is constant and Wm is the
amount of gas required for monolayer coverage of the specimen. The surface
area was estimated from equation 1 by plotting of 1/[W(P/Po)-1] against (P/
Po), which should be a straight line with a slope equal to  and intercept
equal to
and intercept
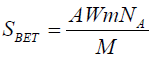
equal to  . The BET total surface areas (SBET) were estimated by Emmett,
(1941), equation.
. The BET total surface areas (SBET) were estimated by Emmett,
(1941), equation.
 (2)
(2)
A is the area of coverage of an equal nitrogen molecule equal (A= 0.162 nm2), NAA vogadro number (6.023 x 10²³) and M is the molecular weight of nitrogen gas. Finally, the pore size (r) distribution was calculated using the Dubinin-Radushkevish (D-R) relationship [27] (Equation 3).
 (3)
(3)
Small-angle x-ray scattering (SAXS)
The small angle scattering (SAXS) was carried out at 25°C using a Kratky compact small-angle scattering (SAXS) setting system equipped with a position-sensitive detector containing 1024 channels of width 53 mm, using the Hercus-Braun SWAXS with a Seifert-type X-ray generator, with CuK∝, X-ray radiation of 1.5404 Å wavelength. The diffraction angle (2Ɵ) was conducted in the range of (0.0o–8.6o) with a step size of 0.01o.
Pore size distributions
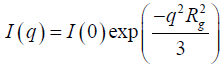
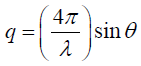
Porod’s low considers that the scattering medium on a scale of 0.5-200 nm is applicable for the micropore and macropores size characterization. The Guinier expression represents the diffraction intensity profile as a function of the scattering vector (q) is given [25].
 (4)
(4)
 (5)
(5)
Where I (0) is the scattering intensity at zero scattering vectors and the
scattering radius of gyration radius (Rg), is a measure of the size of the particles
generated by the rotation of the scattering intensity around the symmetrical
axis perpendicular to the sample. The Guinier region of the scattering intensity
was analyzed by curve fitting to a linear portion of the plot of log I (q) vs. q2 as q approached zero which should a straight line with slope equal to  . The pore size(r) was estimated from the gyration radius using the Guinier
approximation for non-spherical pores [25] as:
. The pore size(r) was estimated from the gyration radius using the Guinier
approximation for non-spherical pores [25] as:
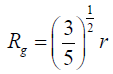 (6)
(6)
The total scattering intensity as a function surface area (SSSA) can be given as:
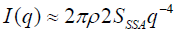 (7)
(7)
Where ρ is representing the phase system (crystalline/amorphous phases), plotting log I (q) vs. logq, will yield a straight line with a slope of –4 and intercept of log 2πρ2 SSSA is so called decay constant (DC), given as function of two system phase as:
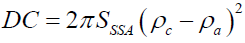 (8)
(8)
The total irradiated volume (V) times the mean–square electron density fluctuation (Q) given as following:
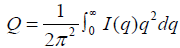 (9)
(9)
The value of Q interns of crystalline and amorphous phase structure as can give as:
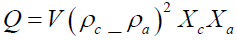 (10)
(10)
Where Xc is the volume fractions for the crystalline structure and Xa is the volume fractions for the amorphous structure. By combining equation 8 with equation 10 can give the specific surface area (SSSA) of the ACs powder as the following:
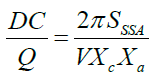 (11)
(11)
Scanning electron microscope (SEM)
The microstructure of the samples after carbonization was scanned using a Scanning Electron Microscope (SEM-Phillips XL30). For the SEM studies, a thin layer of gold was sputtered on the carbon surface to avoid any charge accumulation. The applied probe voltage and current were around 10 keV and 85 mA, respectively. The SEM micrographs were taken at magnifications of 1000x.
Fractal dimensions
The SEM photograph was converted into a 1024 x 712 digital image in the form of a box-counting image by using the image J 1.29x analysis software. The digital image a [x, y] is an enumeration box described in a discrete binary space defined by the x-axis representing the possible gray values and the y-axis representing the number of pixels for each gray value. The value is assigned to the integer coordinates [x, y] where x = 0, 1, 2, x-1 and y = 0, 1, 2, y-1. Therefore, we can get different fractal dimensions from one image. Therefore, there is a possibility to establish fractal dimensions of porosity in the full range of contribution conditions (threshold) as shown in Figure 8.
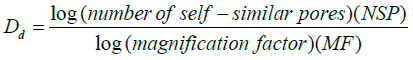
In the binary image, there are only two levels, marked by black and white. Black represents the porosity (object) and the white is the background as shown in Figure 9. Representing enough data points for porosity distribution, then we perform a linear regression for the object’s dataset (pore size distributions) and determine the particle size and fractal pore dimensions (Dd). The fractal dimension of the pores (Dd) was estimated using equation:
 (12)
(12)
By plotting the log number of self-similar pores (NSP) vs. the log magnification factor of the self-similar pores (MF), it will produce a straight line with a slope that gives the Dd of pores.
Milling process
The particle size distributions of the GP produced by the 20 hours milling times are shown in Figure 1. The powder shows different distributions, which are obviously not symmetrical but skewed towards the larger sizes of up to 105 μ (2%). Particle size is in the range of 98 μm (6 percent) 18 μm (68 percent) and 7 μm (70 percent) (Figure 1).

Figure 1. Particle size analysis of PCDPLs powder milled for 20h.
X-ray diffraction
The visible X-ray diffraction spectrum of pre-carbonized date palm leaves (PCDPL) and GP shows three Bragg’s peaks with different intensities (Figure 2). The sharp peak at (002) Bragg’s peaks correspond to the lattice plane spacing of 5.9 Å (estimation without correction to instrumental breading and background line). The values are in close agreement with the lattice spacing of 6.05 Å, 5.45 Å for cellulosic materials. It indicates that cellulose is the dominant compound on the DPL, other components may decompose after being recarbonized. The PCDPL powder spectrum shows a reduction in Brag’s peaks from crystalline to more dominantly amorphous occurred after the milling, as evidenced by the large reduction in the intensity of the (002) Bragg’s peaks. A similar observation was reported by Welham NJ and Williams JS. for milling pure graphite [28].

Figure 2. X-ray diffraction of PCDPL and PCDPL powder.
Nitrogen adsorption isotherms
Figure 3 displays nitrogen absorption isotherms of activated carbon produced, showing that the adsorption isotherms for all samples are relatively small. The micropore volumes AC samples were estimated by applying the Dubinin–Raduskevich (DR) method [29] over a range of relative pressures (P/ Po) from 0.05 to 1and the total surface areas (SBET) were calculated from the slope of the linear relationship over a range of relative pressures (P/Po) from 0.05 to 0.3 as shown in Figure 4. The equation gave a linear relationship between 1/W [(P/Po)-1] and (P/Po) although the linearity was restricted to only a limited part of the volume adsorption isotherm. Table 1 summarizes the pore sizes and surface areas (SBET) of the AC powders. Regardless of the preparation conditions, BET methods show that all AC are the micropore and mesopore structure according to the pore size classification by (i.e., micropore width ≤ 2 nm and mesopore ≥ 2) with a relatively small surface area (SBET) of(0.37-2.02 m2/g).

Figure 3. SAXS diffraction profiles of activated carbon powders.

Figure 4. Adsorbed and desorbed isotherm of N2 as a faction of relative pressure.
| BET | Small Angle Scattering (SAXS) | |||||
|---|---|---|---|---|---|---|
| KOH | Pore Size (nm) | SBET (m2/g) | slope=−R2/3 | R (Å) | Pore Size (nm) | SSAXS (m2/g) |
| 0% | - | - | -12.81 | 6.1 | 08.7 | 0.61 |
| 1% | 10.94 | 2.02 | -15.09 | 6.2 | 08.0 | 0.68 |
| 2% | 17.00 | 0.37 | -19.18 | 7.4 | 09.5 | 0.71 |
| 3% | 4.75 | 0.57 | -12.15 | 7.6 | 09.8 | 0.72 |
| 4% | 0.88 | 1.02 | -15.12 | 6.7 | 08.8 | 0.76 |
| 5% | 0.94 | 1.20 | -14.19 | 7.6 | 09.8 | 0.61 |
| 6% | - | - | -20.73 | 7.9 | 10.2 | 0.79 |
| 7% | - | - | -19.40 | 7.6 | 09.9 | 0.80 |
Pore size and total surface area (SSSA) estimated from the SAXS
The SAXS profiles for the CPs showed only one broad peak at a small value of q (nm-1) (Figure 3) indicating that the internal structure may contain some amorphous structure or so-called turbostratic structure [29].
Guinier plots of the SAXS intensity using Equation 1, in different KOH activation from 0% to 7%, are shown in Figures 4 and 5. The plots of log (I) vs. (q2) are straight lines except at lower angles, where the data departs from the average line (Figures 6 and 7). The slopes of the lines give the gyration radii (R), which are used to calculate the average pore size (r) of the AC and the results are presented in Table 1.

Figure 5. Adsorbed and desorbed isotherm of N2 as a faction of relative pressure.

Figure 6. Plot of 1/[W(p/po)-1] as a faction relative pressure.

Figure 7. Plot of Log (I) vs. q2(nm)-2 (2% KOH).
Figures 6 and 7 are the plots of log (I) vs. log (q), using Equation (1), they are linear at larger angles of q with slopes of -4.02, -4.0and -4.12 respectively, in good agreement with the accepted value of slope (-4). The intercepts with the y-axis were used to estimate the total SSSA areas of the activated carbon samples, which are given in Table 1. The data suggest that the AC samples have mesopore structures (8-10.2 nm). A similar observation was made in the carbon honeycombs from lignocelluloses materials [30].
In addition, plots of log (I) vs. (q2) from the SAXS data for AC show a very pronounced curvature toward the origin (q = 0) followed by a linear part at larger angles (Figures 8 and 9). This seems to be a general feature of central scattering between carbon and coal. As reported by several authors [25]. The logarithm data thus provided a reasonable approximation to most of the scattering curve for describing the electron density fluctuation in the AC material. The surface area (SSA) is described in Table 1, with a relatively small surface area (0.61-0.8 m2/g) and is in the range of the values measured by BET methods. The data in Table 1, show that the pore sizes and total SBET measured using the BET technique are in acceptable agreement with the pore size and SSSA estimated by SAXS.

Figure 8. Plot of Log (I) vs. Log (q) (1% and 3% KOH).

Figure 9. SEM photograph (2D) and surface histogram (3D) of the AC (0% KOH).
Note: R is the gyration radius size
In addition, log plots (I) vs (q2) from the SAXS data for AC show a very clear curvature towards the origin (q = 0) followed by a linear segment with larger angles (Figures 6a and 6b). This appears to be a general feature of the central dispersal between carbon and coal as reported by Kandas AW, et al. [25]. Thus, the logarithmic data provides a reasonable approximation of most of the scattering curve to describe the pore size and surface area of the activated carbons.
SEM and Fractal Dimensions SEM photographs were taken of selected ACs samples treated with 0%, 2%, 5% and 7% KOH (Figures 10-13). The surfaces of the samples were unsymmetrical, with different shapes and porosity distributions. The SEM photographs were also transformed into histograms of the three-dimensional (3D) surface morphology (Figures 10-13) showing that the surface is rough with height difference and inhomogeneous phase increased with the increasing KOH treatment. Similarly, the SEM photographs were converted to binary SEM images using the Image J1.29x analysis software to characterize the particle size distribution in the ACs samples. The nominal particle size increased from 1.42 μm for the ACs powders from 0% KOH to 2.23 μm in the AC treated with 7% KOH.

Figure 10. SEM photograph (2D) and surface histogram (3D) of the AC (2% KOH).

Figure 11. SEM photograph (2D) and surface histogram (3D) of the AC (5% KOH).

Figure 12. SEM photograph (2D) and surface histogram (3D) of the AC (7 % KOH).

Figure 13. Red colors represent the pore size distribution thresholds.
Fractal dimensions
Each binary image (Figure 14) was subdivided into four similar images [x and y= 400 pixels] to estimate the fractal dimensions by applying the equation (12).

Figure 14. Thresholds image converted to binary image [x,y] (black and weight colors) pores distribution thresholds.
Figures 15, 16 and 17 plot the logarithm of the number of self-similar pores (log NSP) vs. the logarithm of the magnification factor of self-similar pores (log MF). Linear relationships with their slopes give the fractal dimensions (Dd) of the pores. Dd values varied from 1.62 to 1.66 and 1.7 for the ACs powder activated with KOH from 0%, 2%, 5% and 7% respectively. These values were like those of carbon black [31] and are presented in Table 2. Thus, increasing the concentration of KOH enhances the fractal dimensions of the pore size distribution.

Figure 15. Log numbers of self-similar pores (Log NSP) vs. log magnification factor of self-similar pores (Log MF) for the untreated AC.

Figure 16. Log number of self-similar pores (Log NSP) vs. log magnification factor of self-similar pores (Log MF) for AC treated with 5% KOH.

Figure 17. Log number of self-similar pores (Log NSP) vs. log magnification factor of self-similar pores (Log MF) for AC treated with 7% KOH.
| KOH % | Fractal Dimension (DD) | ||
|---|---|---|---|
| This work reference data, carbon black salome and carmona (1991) | |||
| 0 | 1.62±0.342 | 166 | |
| 2 | 1.66±0.23 | 167 | |
| 5 | 1.68±0.134 | 168 | |
| 7 | 1.7±0.166 | ||
Activated carbon powder preparation from PCDPL powder by chemical with KOH followed by carbonization at constant temperature at 700°C. In the production of AC, it has been shown that the weight loss and volume shrinkage of the DPLs are influenced by the pre-carbonization and KOH activation.
The shape of the adsorption isotherm is a direct indicator of the pore size distribution and the diversity of the shapes indicates that the porosity can be synthesized according to the specific application of activated carbon. The results showed that all AC samples had a micro-mesopore structure with a relatively small surface area, in agreement with the work reported by Park SJ and Jung WY [13] on activated carbon treated with KOH. They consider that the residual KOH compound salts in the AC can clog the pore inlets and nitrogen gas molecules do not flow for adsorption and isothermal adsorption. Yang HM, et al. [32] proposed reaction (1) as follows:
4KOH → K2CO3 + K2O + 3H2 (1)
K2O + C → 2K+ CO (2)
K2CO3 +2C → 2K+ 3CO (3)
The representation of the complex salt formed on the AC surface can serve as an active site in the gasification process K - containing compounds, such as K2O [9] the carbon monoxide of the expansion metal K (reaction 2) and K2CO3 [33] (reaction 3) releasing, carbon monoxide of the expansion metal K, during the carbonization process. Could be responsible of microspores welded or collapsed pores wall, or the KOH concentration used is high caused to collapse some pore walls. In addition, the washing of non-carbon content may have led to the breakdown of some structure of the inner pore walls [13].
The SAXS techniques give more detail of all AC samples that have a mesomicropores volume structure with a relatively small surface area compared to BET methods which allowed absorption up to 5% KOH concentration. Finally, the KOH activation used to treat the PCDPL is insufficient to improve the specific surface area of the ACs produced, but its prepared ACs with a micropores/mesopores structure that can be used as an adsorbent for pollutant scavenging from liquids or gases.
The SEM photographs were analyzed as binary data (pore size distribution and background) as a rough approximation surface to estimate the average particle size distributions and the fractal dimensions of pores. Visual inspection of SEM photographs shows that the surface roughness increased with the KOH activation; it is probably attributed to the decrease in crystalline structure of the grain powder as supported by X-ray diffraction intensity. The fractal dimension of the pores was increased with increasing KOK activations.
The main objectives of this work were to prepare activated carbon from date palm leaves and to characterize the pore size and surface area in this wok. The result of the activated carbon shows that carbonization up to 700°C is suitable for preparing activated carbon in powder form.
N2 adsorption and small angle X-ray scattering (SAXS) show a reasonably small surface area and a meso-microspore structure. Indicating that the KOH activation is insufficient or too high to act as a dehydration catalyst to improve the surface area. Otherwise, this may be the way to prepare a micro-mesopore structure as a type of a type of sieving carbon. Small angle scattering (SAXS) diffraction intensity shows that the structure ACs is turbostratic. Visual inspection of the SEM photograph and the grey-level histogram and the binary analysis showed that the ACs internal structure with different pore sizes distribution and shapes with a high surface roughness. The fractal dimensions of the pore size distribution were found to be like those of particle sizes of the carbon black.
The authors extend their appreciation to Deanship of Scientific Research at King Khalid University for funding this work through General Research Project under grant number (GRP-323/43- 1443) and Act center for the great support.
None.
Google Scholar, Crossref, Indexed at
Google Scholar, Crossref, Indexed at
Google Scholar, Crossref, Indexed at
Google Scholar, Crossref, Indexed at
Google Scholar, Crossref, Indexed at
Google Scholar, Crossref, Indexed at
Google Scholar, Crossref, Indexed at
Google Scholar, Crossref, Indexed at
Google Scholar, Crossref, Indexed at
Google Scholar, Crossref, Indexed at
Google Scholar, Crossref, Indexed at
Google Scholar, Crossref, Indexed at
Google Scholar, Crossref, Indexed at
Google Scholar, Crossref, Indexed at
Google Scholar, Crossref, Indexed at
Google Scholar, Crossref, Indexed at
Google Scholar, Crossref, Indexed at
Molecular Biology: Open Access received 607 citations as per Google Scholar report