Research Article - (2023) Volume 14, Issue 1
Received: 08-Dec-2022, Manuscript No. jbmbs-22-82892;
Editor assigned: 09-Dec-2022, Pre QC No. P-82892;
Reviewed: 22-Dec-2022, QC No. Q-82892;
Revised: 02-Jan-2023, Manuscript No. R-82892;
Published:
09-Jan-2023
, DOI: 10.37421/2155-6180.2023.14.150
Citation: Zhao, Yuankang and Shein-Chung Chow. “Statistical Evaluation of the Validity of Real World Data and Real World Evidence.” J Biom Biosta 14 (2023): 150.
Copyright: © 2023 Zhao Y, et al. This is an open-access article distributed under the terms of the Creative Commons Attribution License, which permits unrestricted use, distribution, and reproduction in any medium, provided the original author and source are credited.
Real-world data (RWD) often consist of positive or negative studies and the data may be structured or unstructured. In this case, the validity of realworld evidence (RWE) that derived from RWD is a concern for providing substantial evidence regarding the safety and efficacy of the test treatment under investigation. The validity of RWD/RWE is essential, especially when it is intended to support regulatory submission. In practice, studies with positive results are more likely accepted in RWD, which may cause substantial selection bias. In this article, a quantitative form of selection bias is defined and studied. Based on the form of bias, three reproducibility probability-based approaches are proposed to estimate the true proportion of positive studies in the structural and unstructured data. The reproducibility probability-based approach provides effective bias adjustment when the proportion of significant studies in RWD is different as designed power based on the result of simulation study. The Estimated Power approach and Bayesian approach provide robust and effective bias adjustment in most cases and the Confidence Bound approach provide huge and effective adjustment only when bias is larger than 10%. The proposed adjustment method in conjunction with other treatment effect specification method is useful in estimating the treatment effect based on RWD.
Real-world data (RWD) • Real-world evidence (RWE) • Pragmatic clinical trial • Selection bias • Reproducibility probability
Real-world data (RWD) refers to the data relating to patient health status or the delivery of health care routinely collected from various sources (FDA) [1]. The source of RWD includes electronic health record (EHR), medical claims databases, products and diseases registries, data from randomized clinical trials, and so on. As indicated in the US Food and Drug Administration (FDA) draft guidance on Framework for FDA’s Real-World Evidence Program, real-world evidence (RWE) refers to the clinical evidence about the usage and potential benefits or risks of a medical product derived from an analysis of RWD (FDA) [2]. In practice, RWE is often generated by different designs or investigations, such as pragmatic clinical trial (PCT) and prospective or retrospective observational studies.
Although randomized controlled trials (RCTs) are the gold standard for evaluating the safety and efficacy of pharmaceutical drugs, RCTs are conducted under specific or controlled environment, which do not reflect real clinical practice [3]. In practice, RCTs limit generalizability due to strict inclusion and exclusion criteria, as well as high costs and long duration, causes people to consider RWE as alternative clinical evidence [4]. Not only RWE can make up for the drawbacks, but it also can provide treatment effects evidence in more diverse applied settings due to the massive volume of data, as well as provide evidence of some rare disease drug development due to the data availability in multicenter trial and EHR. Therefore, the challenge faced by biostatisticians is how to generate robust RWE from RWD and integrate it into drug development and regulatory review; in other words, map RWE to Substantial Evidence [5].
In order to map RWE to substantial evidence (current regulatory standard and can only be obtained through the conduct of RCTs), researchers often focus on the following aspects. First, it is to determine the difference in evidence provided by RWD and data collected by RCTs (i.e., gap analysis between RWE and substantial evidence). Second, it is to evaluate whether the RWD is robust and representative of the target population (i.e., data relevancy and selection bias) [6]. In addition, data quality or data reliability is the most crucial part of evaluating RWD because of the volume and multiple sources nature of RWD. Finally, it is to assess whether historical data is suitable for data borrowing (e.g., the use of Bayesian inference) for efficient quantitative analysis in order to meet the current regulatory standard [7]. In this article, we will focus on the validity of RWD/RWE (i.e., the presence of selection bias and information bias).
As indicated by Chow SC [7], a mathematical model with statistical analysis was performed, which considers the biased positive studies proportion, providing a systematic way to evaluate the validity of RWD from the regulatory perspective [7]. The most recent guidance on RWD clearly indicates that the “relevant impacts of unstructured data on data quality should be documented in the protocol and analysis plan”. As indicated in FDA (2021), unstructured data refer to the data within EHR, either as free text data fields (such as physician notes) or as other non-standardized information in computer documents (such as PDF-based radiology reports). All these data need further processing (such as the deep learning algorithm with a significant amount of human aid) to extract valid clinical information, which inevitably brings bias. In this article, we study the validity (in terms of selection bias) of unstructured data and divide datasets into four classifications as shown in (Figure 1). Therefore, we will give a new model with further statistical analysis and simulation, as well as apply our model in RWD setting to prove the valuable insight from regulatory perspectives. In the Section 2, the statistical method for studying the validity of real-world data is briefly outlined. This section includes the estimation of the selection bias using three proposed reproducibility probability-based approaches. In the Section 3, simulation studies were conducted to examine the robustness and efficiency of the proposed methods. In the Section 4, the limitations and relative advantages of the proposed methods are compared with other bias adjustment methods. Section 5 provides some concluding remarks.

Figure 1. Model that consider unstructured data.
Statistical methods
The validity of real world data: Let μrwd be the true mean of the target population study’s target patient group, μs and μns be the true means of data sets from positive and negative studies done in the same target population. Also, let μs and μns be the true means of data sets of structured data and unstructured data. In addition, let ρ be the true proportion of structured data conducted on the target population, and let r1 and r2 be the true proportions of positive result within the structured data and unstructured data, respectively. Assume that there is no treatment-by-centre and treatment-by-study interaction in multicentre studies for illustrating. Following (Figure 1), we have
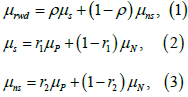
Usually, μN<δ<μP , where δ is the clinical meaningful treatment effect. In other words, the estimate effect of a study larger than δ would be considers a positive study. Besides, usually in practice, we would expect  .In particular, if ri = 1 , then μ would degrade to μ = μP .
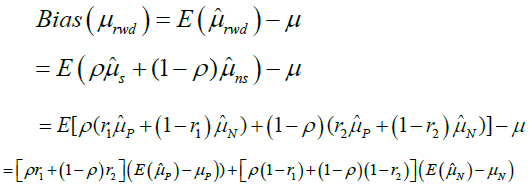
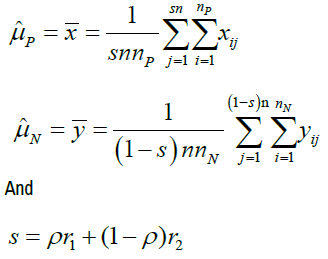
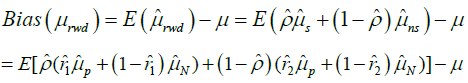
Then, for illustration purpose, we assume that all the studies included in the RWD are parallel design studies, and all positive and no positive studies share same sample size, denoting nP and nN.xij denote the clinical response of the patient i in the jth positive study, i=1,…,nP and j=1,…,sn, where n is the number of studies included in the RWD. Besides, denote the clinical response of the patient i in the jth no positive study, i=1,…,nN and j=1,…,(1-s)n. If ρ and ri are given, the bias of mean of RWD, μrwd is
 (4)
(4)
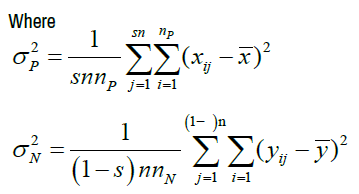
Where
Based on the equation 4, if we assign ρ and ri certain value, we can gain the bias as shown in Table 1. From Table 1, we can find that the different ρ and ri correspond different selection bias.
| ρ | r1 | r2 | Selection bias |
|---|---|---|---|
| 0 | 0 | 0 | 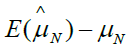 |
| 0 | 0.5 | 0.5 |  |
| 0 | 1 | 1 |  |
| 0.5 | 0 | 0 |  |
| 0.5 | 0.5 | 0.5 |  |
| 0.5 | 1 | 1 |  |
| 1 | 0 | 0 |  |
| 1 | 0.5 | 0.5 |  |
| 1 | 1 | 1 |  |
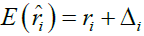
In practice, however, ri are unknown. For a given RWD, estimation of ri  is based on the number of positive studies in RWD. Similarly, the
estimation of ρ (ie. Pˆ, ) is based on the number of structural data in RWD.
However, i r usually be overestimated, since positive data are more likely
published and included in historical data (S.C Chow, 2020). Therefore, we have
is based on the number of positive studies in RWD. Similarly, the
estimation of ρ (ie. Pˆ, ) is based on the number of structural data in RWD.
However, i r usually be overestimated, since positive data are more likely
published and included in historical data (S.C Chow, 2020). Therefore, we have
Therefore, the bias of mean of RWD, μrwd is given by
For simplicity, if we neglect Δi.Δj, where i≠j, then the bias of mean of RWD can be simplified to
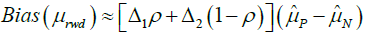 (5)
(5)
Considering the power calculation, by (1), the variance of μrwd is given by
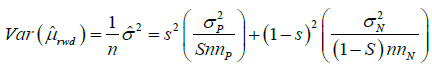 (6)
(6)
If we take derivative above, then
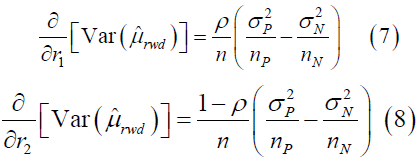
In practice, the variance in positive studies is larger than in negative
studies, since difference between controlled group and referred group is
larger in positive study. If the gap of sizes of positive and no positive studies is not huge, we have  . Thus,
  is an increasing function
of r1 and r2 . Furthermore, the power of the RWD can be calculated by the
probability:
is an increasing function
of r1 and r2 . Furthermore, the power of the RWD can be calculated by the
probability:
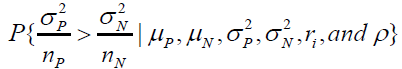
Based on the data availability of RWD.
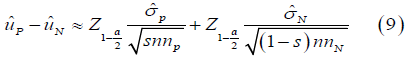
Estimation of uP - uN
Let (LP,UP) and (LN,UN) be the (1− a)100% for uP and uN. Under the assumption of normality, we have
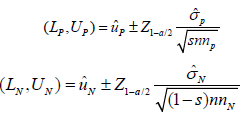
According to Chow’s assumption (2020), when selection bias does exist, it is reasonable to assume the positive studies and no positive studies are different. In this case, we assume uP > uN and (LP,UP) and (LN,UN) would not have intersection. At some extreme case [7], LP is close to UN . Then, we have
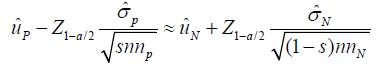
Therefore, the distance of uP and uN can be calculated as the estimation of uP − uN , we have
Reproducibility probability: The definition of reproducibility probability is the estimated power (EP) of a future trial using the information from previous trials. In theory, different trials are independent; the probability of achieving a statistically significant result from the new trial would be identical with previous studies if these trials apply the same study design and hypothesis, regardless of the outcome of previous trials. When HA is true, the probability of gaining a significant result is the power of the test [8,9]
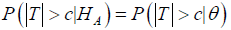
Where HA is the alternative hypothesis and θ is an unknown parameter or a vector of parameter (Shao & Chow, 2002). Even though trials are independent to each other, it reasonable to use the previous trials information in RWD to refer a later trial. Reproducibility probability could be estimated through (i) the estimated power (EP) approach, (ii) the confidence bound (CB) approach, which is more a conservative approach than EP approach and (iii) Bayesian approach, a more sensible approach to obtain reproducibility [9].
To illustrate EP approach, consider a control group and reference group
trial with unequal variances. Let xij be the jth subject in the ith group (i =
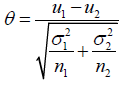
1,2) and distributed as N(ui,σi2) respectively, in which  Therefore, assuming n1 and n2 are large, statistics T is shown as
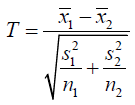
Then, T asymptotically has normal distribution N(θ,1), where
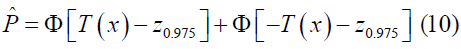
Therefore, the reproducibility probability can be calculated by replacing θ by its estimate statistics T
The EP approach would provide an optimistic result that the adjustment of bias might be inadequate when applied in our proposed approach. The CB method would yield a more cautious estimation of reproducibility probability.
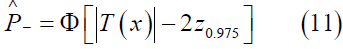
Considering the trial setting mentioned before, the CB approach considers a 95th percent lower confidence bound as the reproducibility probability. Therefore, CB approach provides the estimation of reproducibility probability as follow equation.
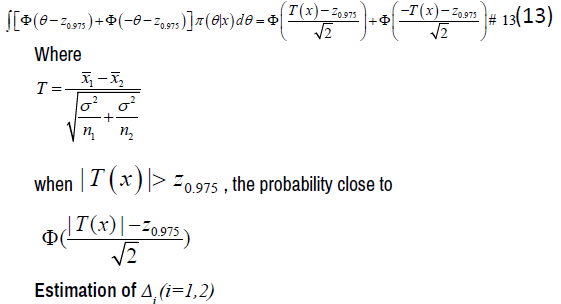
Furthermore, the Bayesian approach provides a clear definition of reproducibility. To be more specific, we assume the unknown parameter θ is a random vector with priori distribution π(θ), which is known. Then, we can define reproducibility probability is the conditional probability of |T|>c in the future trial, which can be shown as

where T is T statistics based on future data set and π(θ|x) is the posterior density of θ given x.
Considering the same setting in EP approach part, if the variance, σ 2 , is known, then reproducibility probability is
The proportion of positive studies in RWD, ˆr , is highly likely overestimated, since positive studies are more likely collected. In other words, ˆr is likely larger than the true proportion r.
According to the definition of reproducibility probability, r can be estimated by reproducibility probability of observing a significant result based on the mean and variance of response in RWD. The probability can be represented as follow equation:

The interpretation of the reproducibility probability under this setting is that we expect to gain p × 100 significant studies if the similar experimental setting trial conduct 100 times based on the observed mean response ( μˆB) and standard deviation ( σˆB ) in RWD. To be more specific, with RWD, we have
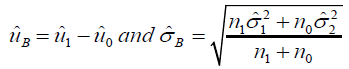
where  are the pooled means of controlled and reference group
in RWD, n1 and n0 are the sizes of controlled and reference group of pooled
RWD,
are the pooled means of controlled and reference group
in RWD, n1 and n0 are the sizes of controlled and reference group of pooled
RWD,  are the estimated variances of the controlled and
reference group, respectively. Then, the T statistic is shown as
are the estimated variances of the controlled and
reference group, respectively. Then, the T statistic is shown as
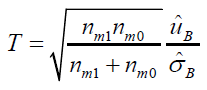
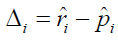
where nm1 and nm0 are the median sample sizes of controlled and reference group in studies included in RWD. Therefore, the bias of positive proportion, Δi. can be represent as
Simulation study
In this part, we used the method proposed in chapter 2 to adjust bias
in simulation studies of different scenarios. The performance of methods is
evaluated by comparing the adjusted mean and the true mean of the target
population. For simplicity, we assume that the structural data is from equal
sample size randomized clinical trials and the unstructured data is from equal
sample size observational cohort studies. All these data are generated from
the same population. As for the target population, we assume that each
trial or study contains two groups of patients, the treatment group and the
control group. Each group's responses follow the normal distribution N(2,25)
and N(0,25). In order to achieve 80% power to detect a clinically meaningful
difference of 2, 100 subjects in each group are needed based on sample size calculation. Furthermore, to achieve 50%, 60%, 70%, 80%, 90% power in the
trial, we need sample size of 49, 63, 79, 100, 133 per group respectively. We
generated 1000 studies to simulate the target population for each sample
size. To evaluate the performance of the proposed methods, we define
relative bias as  , where μˆrwd is the estimated treatment effect
based on real-world data and μ is the true treatment effect, which is 2 in this
simulation. We also define the relative adjusted bias as
, where μˆrwd is the estimated treatment effect
based on real-world data and μ is the true treatment effect, which is 2 in this
simulation. We also define the relative adjusted bias as 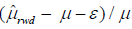 ,
where ε is the estimated bias based on the proposed method. Four scenarios
are considered to assess the robustness of the adjustment method. The first
scenario compares performance between EP (estimated power) method,
CB (confidence bound) method, and Bayesian method in structural data
under the previous setting when only structural data presented. The second
scenario compares the performance of the three methods when negative data
are absent in structural data. The third scenario tests the robustness when
structural data and unstructured data presents inconsistent positive proportion.
Finally, we test the robustness when inconsistent positive proportion presents
and imbalance structural data proportion occurs.
,
where ε is the estimated bias based on the proposed method. Four scenarios
are considered to assess the robustness of the adjustment method. The first
scenario compares performance between EP (estimated power) method,
CB (confidence bound) method, and Bayesian method in structural data
under the previous setting when only structural data presented. The second
scenario compares the performance of the three methods when negative data
are absent in structural data. The third scenario tests the robustness when
structural data and unstructured data presents inconsistent positive proportion.
Finally, we test the robustness when inconsistent positive proportion presents
and imbalance structural data proportion occurs.
In the first scenario, we assessed the relative bias and adjusted bias based on three adjustment methods by different power and r, the proportion of positive studies, which is summarized by (Table 2) and (Figure 2). As expected, when the gap between the proportion of positive studies and power, the theoretical proportion of positive studies, increases, the selection bias increases. As the most conservative adjusted method, EP method can slightly adjust selection bias compared with the other two methods. When the bias larger than 15%, the bias can reduce 20% by the EP method. On the other hand, when the bias less than 5%, the adjustment is limited, causing the adjusted bias is nearly the same as original bias. As for CB approach, the adjustment is significantly larger than the adjustment made by EP approach. When the selection bias is larger than 10%, a significant adjustment in right direction can be made by the EP approach. However, when the bias is smaller than 10%, the CB approach can lead the bias toward the wrong direction and even show an absolute bias larger than the original bias. Finally, the Bayesian approach give us a more effective adjustment result. The overall adjustment pattern is similar to the EP approach but more effective. To be more specific, when the bias larger than 15%, the bias could reduce 40% by the EP method. When the bias is less than 5%, the Bayesian approach significantly leads to more adjustment compared with EP approach. In addition, compared with the CB approach, the Bayesian approach always makes adjustment toward the right direction.
| Power | r | Bias | EP approach | CB approach | Bayesian Approach |
|---|---|---|---|---|---|
| 0.508 | 0.7 | 0.1584 | 0.1449 | 0.0313 | 0.1378 |
| 0.75 | 0.1986 | 0.1808 | 0.0577 | 0.1716 | |
| 0.8 | 0.2409 | 0.2155 | 0.0677 | 0.2029 | |
| 0.85 | 0.2727 | 0.2387 | 0.0786 | 0.224 | |
| 0.9 | 0.3117 | 0.2662 | 0.0809 | 0.2478 | |
| 0.95 | 0.3507 | 0.2796 | 0.0275 | 0.2531 | |
| 0.6122 | 0.7 | 0.0427 | 0.0332 | -0.0804 | 0.0252 |
| 0.75 | 0.0815 | 0.0677 | -0.0568 | 0.0576 | |
| 0.8 | 0.1167 | 0.0972 | -0.0394 | 0.0849 | |
| 0.85 | 0.1527 | 0.1263 | -0.0242 | 0.1115 | |
| 0.9 | 0.1854 | 0.1445 | -0.0501 | 0.1241 | |
| 0.95 | 0.2285 | 0.1763 | -0.0424 | 0.152 | |
| 0.7102 | 0.7 | 0.0115 | 0.014 | -0.069 | 0.0063 |
| 0.75 | 0.043 | 0.0424 | -0.0442 | 0.0337 | |
| 0.8 | 0.0669 | 0.0622 | -0.0288 | 0.0526 | |
| 0.85 | 0.1041 | 0.0953 | -0.0078 | 0.0838 | |
| 0.9 | 0.1318 | 0.1168 | -0.0002 | 0.1033 | |
| 0.95 | 0.1687 | 0.1476 | 0.0218 | 0.1326 | |
| 0.8074 | 0.7 | -0.0741 | -0.0691 | -0.1395 | -0.0762 |
| 0.75 | -0.0394 | -0.0366 | -0.1102 | -0.0445 | |
| 0.8 | -0.0075 | -0.0073 | -0.0866 | -0.0163 | |
| 0.85 | 0.0217 | 0.0183 | -0.0638 | 0.0087 | |
| 0.9 | 0.052 | 0.0442 | -0.0514 | 0.0327 | |
| 0.95 | 0.0835 | 0.0701 | -0.0363 | 0.057 | |
| 0.9035 | 0.7 | -0.1138 | -0.1029 | -0.1628 | -0.1099 |
| 0.75 | -0.0827 | -0.0738 | -0.1339 | -0.0811 | |
| 0.8 | -0.0502 | -0.0434 | -0.1049 | -0.0511 | |
| 0.85 | -0.0188 | -0.0147 | -0.0781 | -0.0227 | |
| 0.9 | 0.0125 | 0.0136 | -0.0539 | 0.0051 | |
| 0.95 | 0.043 | 0.0401 | -0.0319 | 0.031 |

Figure 2. Box plot of performance of proposed approaches at different power.
Second scenario, we consider the situation that only positive studies exist in the structural data. In other words, the r1 , proportion of positive study is fixed to 1 in this scenario. As we can see in Table 3 and (Figure 3), bias decrease when power increase, and the result of the EP approach and Bayesian approach is similar to the pattern in scenario 1. More specifically, when bias is more negligible, the EP and Bayesian approaches lead less adjustment. In addition, the EP approach provides a more conservative adjustment compared with the Bayesian approach. As for CB approach, similar as scenario 1, when bias is larger than 10%, the bias can be significantly reduced. However, the CB approach could lead adjustment toward the wrong direction when bias smaller than 10%.
| Power | Bias | EP approach | CB approach | Bayesian Approach |
|---|---|---|---|---|
| 0.508 | 0.4170 | 0.3675 | 0.1910 | 0.3472 |
| 0.6122 | 0.2915 | 0.2525 | 0.0986 | 0.2343 |
| 0.7102 | 0.2100 | 0.1790 | 0.0293 | 0.1606 |
| 0.8074 | 0.1402 | 0.1178 | -0.0246 | 0.0999 |
| 0.9035 | 0.0455 | 0.0310 | -0.0934 | 0.0152 |

Figure 3. Box plot of performance of proposed approaches at different power when negative studies absent.
In the third scenario, the power set to 0.6, ρ set to 0.5, and the rest of setting is the same as previous scenario, and we consider the situation that the structural data and unstructured data provide inconsistent positive proportion. To be more specific, we consider that the structural data provide high proportion of positive result and the unstructured data provided low proportion of positive result. In this context, according to Table 4, when the two proportion are away from each other and the mean of two proportion away from the setting power, 0.6, the bias decreases. Similar situation observed in scenario 1 and 2. The EP approach and Bayesian approach provide effective bias adjustments toward the right direction, and the Bayesian approach provide slightly more adjustment compared with EP approach for most of the case. As for CB approach, most of the adjustment towards wrong direction, which in line with the observation about CB approach under 10% bias from scenario 1 and 2. However, we do notice that the adjustment based on Bayesian method also toward to wrong direction slightly when bias is less than 5%. In conclusion, the EP approach and Bayesian approach provide effective adjustment under the inconsistent positive study proportion situation, but CB approach lead the adjustment toward wrong direction in this scenario.
| r1 | r2 | Bias | EP Approach | CB Approach | Bayesian Approach |
|---|---|---|---|---|---|
| 0.75 | 0.1 | -0.1406 | -0.1267 | -0.227 | -0.1254 |
| 0.2 | -0.1043 | -0.0942 | -0.1995 | -0.095 | |
| 0.3 | -0.0685 | -0.0621 | -0.1728 | -0.0651 | |
| 0.4 | -0.0298 | -0.0266 | -0.1426 | -0.0318 | |
| 0.5 | 0.0059 | 0.005 | -0.1173 | -0.0021 | |
| 0.8 | 0.1 | -0.1236 | -0.1119 | -0.2139 | -0.1116 |
| 0.2 | -0.0868 | -0.0787 | -0.1863 | -0.0806 | |
| 0.3 | -0.0496 | -0.0449 | -0.1584 | -0.049 | |
| 0.4 | -0.0136 | -0.0128 | -0.1319 | -0.0188 | |
| 0.5 | 0.0255 | 0.0228 | -0.1035 | 0.0146 | |
| 0.85 | 0.1 | -0.1049 | -0.0949 | -0.2001 | -0.0958 |
| 0.2 | -0.0665 | -0.0598 | -0.1702 | -0.0629 | |
| 0.3 | -0.0303 | -0.0273 | -0.1432 | -0.0324 | |
| 0.4 | 0.0074 | 0.0067 | -0.1154 | -0.0005 | |
| 0.5 | 0.0435 | 0.0387 | -0.0907 | 0.0295 | |
| 0.9 | 0.1 | -0.0868 | -0.0788 | -0.1853 | -0.0807 |
| 0.2 | -0.0496 | -0.045 | -0.1577 | -0.049 | |
| 0.3 | -0.0121 | -0.011 | -0.1303 | -0.0171 | |
| 0.4 | 0.0239 | 0.021 | -0.1048 | 0.0129 | |
| 0.5 | 0.0609 | 0.0537 | -0.0803 | 0.0435 |
In the final scenario, we consider both imbalance of structural data and inconsistent positive proportion occurs. The r1 set to 0.4, and r2 set to 0.8, the power set to 0.6, and the rest of setting is the same as scenario 1. As we can see in Table 5, when the ρ, the structural data proportion, increase (i.e., Balance of structural and unstructured data), the bias reduced. Under the imbalanced structural data proportion, both EP approach and Bayesian Approach shows capability to reduce bias. But for CB approach, it adjusts the bias toward the wrong direction and even increase the bias when the bias less than 5%.
| ρ | Bias | EP Approach | CB Approach | Bayesian Approach |
|---|---|---|---|---|
| 0.1 | 0.1057 | 0.0925 | -0.0423 | 0.0808 |
| 0.2 | 0.0756 | 0.0659 | -0.0657 | 0.0555 |
| 0.3 | 0.0467 | 0.0406 | -0.0875 | 0.0315 |
| 0.4 | 0.0182 | 0.0155 | -0.1097 | 0.0079 |
In summary, three proposed methods can adjust the bias in real world data. EP approach provides the most conservative and stable adjustment. The Bayesian method provides more adjustment toward the right direction with robustness in most the extreme cases. In addition, the CB approach leads to the most aggressive adjustment of these three methods. However, it shows less stability and robustness when the power is larger than the proportion of positive studies in structural data or the bias of real-world data is less than 10%.
Several limitations were found in the simulation study. First, when the
proportion of positive studies is close to the designed power, the adjustment
led by the EP approach and Bayesian approach is limited. In some cases, the
Bayesian method even enlarges the bias. This is because the reproducibility
probability-based approaches can make over-adjustments when bias is not
obvious. Another reason is that the estimation of  is over-estimated
when bias is negligible. The second limitation is that CB approach provides
adjustment towards the wrong direction when bias is less than 10%. One
explanation is that the lower confidence bound provided by CB approach is too
conservative in estimating the real positive proportion, r, when bias is less than
10%. In addition, the over-estimation of can also lead adjustment
failure of CB approach.
is over-estimated
when bias is negligible. The second limitation is that CB approach provides
adjustment towards the wrong direction when bias is less than 10%. One
explanation is that the lower confidence bound provided by CB approach is too
conservative in estimating the real positive proportion, r, when bias is less than
10%. In addition, the over-estimation of can also lead adjustment
failure of CB approach.
Previously, compared the substantial evidence and real-world evidence
and pointed out that the bias in the substantial evidence is minimized but
selection bias exists in the real-world evidence, and proposed a reproducibility
probability based bias adjustment approach. Compared to the method in our
paper, we added the Bayesian method to adjust bias, which has been proved
as an effective and robust adjustment method and applied the method in a
new architecture of real-world data, which divided the data into structural
and unstructured data. In reality, meta-analysis has been used to estimate
non-inferiority margin or treatment effect based on historical data, which is
similar to use real-world data to estimate the treatment effect. The parameter,  can also be estimated by meta-analysis even the
individual data is unavailable [10]. Therefore, the combination of meta-analysis and our method can also adjust the bias in real world data. However, either our
proposed method or meta-analysis method has the assumption that there is no
treatment-by-study interaction and treatment-by-center interaction. Therefore,
further investigation of these two interactions can be included in future work.
can also be estimated by meta-analysis even the
individual data is unavailable [10]. Therefore, the combination of meta-analysis and our method can also adjust the bias in real world data. However, either our
proposed method or meta-analysis method has the assumption that there is no
treatment-by-study interaction and treatment-by-center interaction. Therefore,
further investigation of these two interactions can be included in future work.
Regarding the bias in RWD or historical data, various methods have been proposed to identify and quantify the bias. An adjusted rank correlation test has been proposed to identify the bias in a meta-analysis based on historical data [11]. The test shows fairly high power for meta-analysis when studies number are large, which also suitable for RWD bias detection. Egger proposed a test of asymmetry funnel plot that can predict the discordance of outcomes in meta-analysis and evaluated the prevalence of bias in metaanalyses [12]. Furthermore, several methods are proposed to control the bias to acquire inferiority margin or treatment effect from historical data. Chow and Shao proposed a method for selecting non-inferiority margin with statistical assurance. However, these methods only detected the bias but did not adjust the bias in historical data. As for bias adjustment method in RWD proposed a structure that generates robust RWE from RWD via adjusting confounding bias based on causal inference [13]. In addition, several suggestions study designs were proposed to adjust the selection bias in RWD. In our method, not only do we define and quantify the selection bias in RWD, but also we give adjustment methods quantitively [14,15].
Real-World data often consist of positive or negative studies and the data may be structured or unstructured. In this case, the validity of RWD is a concern for providing evaluation of safety and efficacy of the test treatment under investigation. The validity of RWD or Real-World Evidence is important, especially when it is intended to support a regulatory submission. In this paper, we discussed the selection bias adjustment of real-world data based on reproducibility probability approaches. We defined the selection bias in real-world data under the structural and unstructured data setting. Based on the form of bias, three reproducibility probability-based approaches have been introduced to estimate the real proportion of positive studies in the structural and unstructured data. The reproducibility probability-based approach provides effective bias adjustment when the proportion of positive studies is different as designed power. EP approach and Bayesian approach provide robust and effective bias adjustment in most of cases, and the CB approach provide huge and effective adjustment only when bias is larger than 10%.
Google Scholar, Crossref, Indexed at
Google Scholar, Crossref, Indexed at
Google Scholar, Crossref, Indexed at
Google Scholar, Crossref, Indexed at
Google Scholar, Crossref, Indexed at
Google Scholar, Crossref, Indexed at
Google Scholar, Crossref, Indexed at
Google Scholar, Crossref, Indexed at
Google Scholar, Crossref, Indexed at
Google Scholar, Crossref, Indexed at
Google Scholar, Crossref, Indexed at
Google Scholar, Crossref, Indexed at
Journal of Biometrics & Biostatistics received 3496 citations as per Google Scholar report


