Research - (2022) Volume 13, Issue 12
Received: 02-Dec-2022, Manuscript No. Jbmbs-22-79413;
Editor assigned: 05-Dec-2022, Pre QC No. P-79413;
Reviewed: 16-Dec-2022, QC No. Q-79413;
Revised: 21-Dec-2022, Manuscript No. R-79413;
Published:
28-Dec-2022
, DOI: 10.37421/2155-6180.2022.13.141
Citation: Mishra, Neha and Sheela Mishra. “Socioeconomic Inequalities and Factors Contributing to Under-Five Mortality in Uttar Pradesh: A Decomposition Analysis.” J Biom Biosta 13 (2022): 141.
Copyright: © 2022 Mishra N, et al. This is an open-access article distributed under the terms of the Creative Commons Attribution License, which permits unrestricted use, distribution, and reproduction in any medium, provided the original author and source are credited.
Background: Childhood mortality in India has declined substantially in during last three decades (1992-2021) from 119 to 42 per 1000 live births. However, this decline does not necessarily imply reduction in the inequalities which remains both in accesses to quality care and health outcomes among under-five children in Uttar Pradesh (India).
Objective: To estimate and quantify the prevailing socio-economic inequalities contributing to Under-five mortality in Uttar Pradesh along with the temporal trends over 2005–2021.
Methods: The last three rounds of National Family Health Survey (NFHS) were used to estimate and quantify the socioeconomic inequalities and factors contributing in the under-five mortalities by using concentration indexes (CI), concentration curves (CCs) and decomposition analysis.
Results: It was observed that during the period 2019-21 and 2015-16, high concentration of socio-economic inequalities for U5MR among women of age 35 years or more, had primary education, and belonged to Scheduled caste/tribe and Hindus. While during the period 2005-06, high concentration of inequalities was found among women of age 25-34 years, belonged to SC/ST and OBC caste groups, and among Hindus. Overall, mother’s education and place of residence mostly explained the U5MR inequality in all three time periods. Conclusion: The findings suggest that more efforts are needed in the state of Uttar Pradesh to narrow the income related U5MR inequalities. An effective way to reduce inequality is not only to reduce the gap of income but also focus should be made on increasing the level of education of mothers as educational attainment is critical in imparting the feelings of self-worth and confidence which are critical in bringing the changes in health-related behaviour.
NFHS • Under-five mortality • Health inequality • Concentration Index (CI)
Humans from different ages, socio-cultural backgrounds and geographies relish different levels of health. The gap in access to health care is considered as significant health divide globally. Despite considerable attention to the problem of health inequalities since more than four decades [1], striking differences in health still exists among and within social groups and regions [2-4]. These inequalities in health are a major driver of the Sustainable Development Goals (SDGs) which characterize global efforts towards universal health coverage. Maximizing population health outcomes and reducing health inequities by 2030 is one of the important goals of SDGs [5]. These socio-economic differences are also substantially occurred in infant and child mortality, which remains a major challenge to the global public health system, especially in developing countries. Substantial research has shown that children from the wealthy families have more healthy life as compared to children who belong to families [6]. In India, children from the poorest families are more likely to die than are those from the wealthiest fifth of the families [7]. Research also shows the child health inequalities occurs in other dimensions as well such as mother’s educational level, caste, religion, sex, rural/urban residence, and state [8-10].
Due to the varied socio-cultural patterns in India and also within the state of Uttar Pradesh, consistent attention to the issue of inequality in under-five mortalities (U5MR) is necessary. Also, there are very few studies so far that took into consideration the temporal trends of U5MR inequality [11]. This aims of this study to quantify the prevailing socio-economic U5MR inequalities in the state of Uttar Pradesh along with the temporal trends over 2005–2021- time frame. Trends in U5MR inequality by economic status has been studied across the last three rounds of National Family Health Survey (NFHS-3, 4, & 5). Economic inequalities in U5MR were discussed and compared across the time. We also examine the factors contributing to the U5MR inequalities, which is crucial to make efforts to reduce the substantial disparity within and between various sub-groups.
To estimate and quantify the prevailing socio-economic inequalities contributing to Under-five mortality in Uttar Pradesh along with the temporal trends over 2005–2021.
We have used last three rounds of National Family Health Survey (NFHS) which were conducted in (2005-06, 2015-16 and 2019-21). Socioeconomic inequalities and factors contributing in the under-five mortalities were estimated using concentration indexes (CI), concentration curves (CCs) and decomposition analysis.
Variables
Outcome variable: Under-five mortality is used here as an outcome variable to study the inequality. Using birth history of last five years preceding the survey, under-five mortality rate has been derived for the last three rounds of NFHS.
Explanatory variables: In this study, wealth index categories namely; poorest, poorer, middle, richer and richest, provided by NFHS was used as a proxy measure of household economic status. To examine the differentials in under-five mortality rates by poor and non-poor, households belonging to poorest and poorer quintiles were categorized as poor, and others were as non-poor. Other explanatory variables used were age of mother (15–24 years, 25–34 years and 35–49 years), mother’s education (no education, primary education, secondary education and higher education), caste (Scheduled Caste (SC)/Scheduled Tribe (ST), Other backward caste (OBC), Others), religion (Hindu, Muslim, others) and place of residence (urban and rural). For the decomposition analysis, dummy variables have been created. The details of explanatory variables and reference categories considered in the decomposition analysis have been described in below Table 1.
| Variables | Categories |
|---|---|
| Mother’s age | 0-15-24 years®; 1-25 to 34 years; 2-35 years and above |
| Mother’s education | 0-No education®; 1- Primary; 2-Secondary; 3-Higher |
| Caste | 0-Others®; 1- Scheduled caste/Tribes; 2- Other Backward Classes |
| Religion | 0-Others®; 1- Hindu; 2-Muslim |
| Place of residence | 0-Rural®; 2-Urban |
| Wealth status | 0-Non-poor®; 1- Poor |
Statistical approach
Concentration Index (CI): The concentration index (CI) is defined as twice the area between the concentration curve (CC) and the line of equality. It plots the cumulative percentage of health variable (y-axis) against the cumulative percentage of population, ranked by wealth index from poorest to richest (x-axis). These curves can be used to identify whether socio-economic inequality in outcome variable exists or not and whether it is more pronounced at one point of time than another in (Figure 1). The mortality concentration curve (CC) has been demonstrated by L(p), where p shows the cumulative proportion of the study population. The y-axis depicts the cumulative proportion of under-five deaths and x-axis shows the cumulative proportion of live births of children at risk ranked by the wealth index. The graph discovers the distribution of child health indicator (here, under-five mortality) in various quintiles of socioeconomic status. Again, if the curve lies below the diagonal, then we call the inequality as pro-rich [12-14]. However, it is not possible to find out the magnitude of inequality using this concentration curve.

Figure 1. Morality concentration curve.
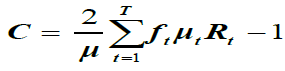
The CI inferred an index considering Gini framework to measure progressivity of social intervention [15-17]. This index is later used to quantify the level of health inequality and named as concentration index (CI). The estimation of concentration index lies between −1 and +1. At the point when the CC curve is over the diagonal line then values of CI are negative and when CC is below the diagonal the values are positive. The estimation of concentration index is zero when there is no inequality in wealth. When the child mortality is considered as a health variable, at that point negative estimation of CI demonstrates that mortality is higher among poor children. For the estimation of health inequality, the concentration index (CI) was computed utilizing an equation given by Kakwani N and Wagstaff A [17-19].
 ………………….. (1)
Where, C is concentration index, ft μt Rt and lt (t = 1…, S) the mean estimation of health variable (here, mortality rate) of the tth socioeconomic group. The term Rt is the overall position of the tth socioeconomic group. In this way, the numerical expressions for l and Rt are given as.
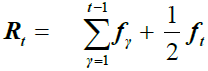
The term Rt shows the total extent of the live births up to the midpoint of each socioeconomic group.
Decomposition analysis: The method proposed by Wagstaff A, et al. [19] was used to decompose socioeconomic inequality in under-five mortality into its determinants, which allows one to estimate how determinants proportionally contribute to inequality i.e. gap between poor and rich Wagstaff A, et al. [19] proposed the following linear regression model that links the health variable of interest (y) to a set of k health determinants, xk.
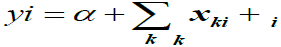 ………………….. (2)
Where,  is an error term. Based on above relationship between yi and
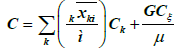
xki, the concentration index for y(C) can be written as:
is an error term. Based on above relationship between yi and
xki, the concentration index for y(C) can be written as:
 …………. (3)
Where the mean of y is  is the mean of XK, CK is the concentration
index for xk. In the last term, cξ G is the generalised concentration index for
ξ i.
is the mean of XK, CK is the concentration
index for xk. In the last term, cξ G is the generalised concentration index for
ξ i.
The equation 3 is made up of two components- 1: explained component i.e., equal to a weighted sum of the concentration indices of the regressors, where the weights are the percentage change in the dependent variable associated with a percentage change in the predictor variables (elasticities association); 2: residual or unexplained component i.e., reflects the part of inequalities that could not be explained by the selected predictors. Since the outcome of interest in the study is non-linear, we used the probit model to calculate the contributions of the k determinants, as suggested in the World Bank technical notes on non-linear estimation [20]. First, variations in under five mortality rates are shown by socio-economic variables including that of poor and non-poor for the at three rounds of NFHS surveys conducted in 2005- 06, 2015-16 and 2019-21 respectively. Using the wealth index, concentration index was used for examining the extent of inequality for the three time periods for Uttar Pradesh. Concentration curves were also used to present the trends in pro-rich inequalities for last three rounds of NFHS. Factors contributing to inequality have been shown by socio-economic characteristics.
It was observed that during the period 2019-21 and 2015-16, high concentration of socio-economic inequalities for U5MR among women of age 35 years or more, had primary education, and belonged to Scheduled caste/tribe and Hindus. While during the period 2005-06, high concentration of inequalities was found among women of age 25-34 years, belonged to SC/ ST and OBC caste groups, and among Hindus. Overall, mother’s education and place of residence mostly explained the U5MR inequality in all three time periods.
Inequalities in under-five mortalities: In order to examine the magnitude of inequality in U5MR across the three time periods, concentration index (CI) was estimated and discussed in Table 2. Result shows the negative CI values for all three time periods which indicate higher child mortality load amongst the poor. The CI values for U5MR for the period 2005-06 was -0.1191, which has reduced to -0.1077 in 2005-06 and -0.1029 in 2019-21. Though the reduction in inequality in U5MR was observed, the magnitude of reduction was less in the state. From 2005-06, the CI for U5MR has been reduced only by 1.6 points in 2019-21.
| NFHS rounds | CI | Std. Error | P value |
|---|---|---|---|
| NFHS-3 (2005-06) | -0.1191 | 0.0229 | 0.000 |
| NFHS-4 (2015-16) | -0.1077 | 0.0104 | 0.000 |
| NFHS-5 (2019-21) | -0.1029 | 0.0126 | 0.000 |
Furthermore, for comparing the differences in inequalities over time, CCs were constructed using the under-five mortality rates and wealth quintiles. As the convention of the index ranges from -1 to 1, if the outcome (here U5MR) is negative and the curves lie above the line of equality, that means, child mortality is concentrated amongst the poor group. The CCs across the time periods almost overlaps with each other, which means the level of inequalities for U5MR from 2005-06 to 2019-21 remained almost same, which is a serious cause for concern (Figure 2).

Figure 2. Concentration curves for under five mortality, Uttar Pradesh, NFHS-3, 4 and 5.
Decomposing inequalities in under-five mortalities
Table 3 presents the estimates of decomposition analysis of inequality contributed by selected socio-economic variables for U5MR for the time periods 2005-06, 2015-16 and 2019-21. In the table, we listed the CI values for each predictor variable, absolute CI and relative contribution to CI. A negative value of CI indicates that the U5MR is highly represented among the poor and vice-versa. The larger the absolute values, the greater the inequalities. Percent contribution to CI indicates the extent of inequality contributed by the explanatory variable. For instance, the occurrence of child mortality is less among women with higher education and residing in urban areas during all three time periods.
| Socio-economic characteristics | Under-five mortalities per 1000 live births | |||||
|---|---|---|---|---|---|---|
| NFHS-3 (2005-06) | NFHS-4 (2015-16) | NFHS-5 (2019-21) | ||||
| Poor | Non-Poor | Poor | Non-Poor | Poor | Non-Poor | |
| Mother’s age | ||||||
| 15-24 years | 124.2 | 89.2 | 94.3 | 74.6 | 80.9 | 59.6 |
| 25-34 years | 98.5 | 73 | 81.1 | 57.5 | 64.3 | 43.9 |
| 35 years or more | 98.5 | 124.8 | 99.9 | 74.3 | 76 | 42.1 |
| Mother’s education | ||||||
| No education | 109 | 103.8 | 90.6 | 83.1 | 77.8 | 56.5 |
| Primary | 100.7 | 102.3 | 91.7 | 64.6 | 74.1 | 60.4 |
| Secondary | 83 | 53.3 | 81.1 | 58.9 | 63.2 | 48.2 |
| Higher | 77.9 | 41.1 | 67.5 | 45.7 | 43.3 | 35.7 |
| Caste/Tribe | ||||||
| Scheduled caste/Tribe | 127.3 | 117.2 | 89.3 | 65.8 | 75.1 | 57.8 |
| Other backward classes | 96.5 | 90.1 | 88.2 | 62.9 | 66 | 48.4 |
| Others | 88 | 56.7 | 89.7 | 62.2 | 75.9 | 38.9 |
| Religion | ||||||
| Hindu | 113.9 | 81.2 | 89.1 | 63.8 | 72.1 | 47.8 |
| Muslims | 71.8 | 89.1 | 86.8 | 61.8 | 62.1 | 48.8 |
| Place of residence | ||||||
| Rural | 107.8 | 84.1 | 88.9 | 66.7 | 76.5 | 49.5 |
| Urban | 87.3 | 81.2 | 84.8 | 57.3 | 70.2 | 45.4 |
| Total | 106.7 | 83 | 88.7 | 63.1 | 70.6 | 47.9 |
From the findings it was observed that during the period 2019-21 and 2015-16, high concentration of socio-economic inequalities for U5MR among women of age 35 years or more, had primary education, belonged to Scheduled caste/tribe and Hindus. While during the period 2005-06, high concentration of inequalities was found among women of age 25-34 years, belonged to SC/ST and OBC caste groups, and among Hindus. In terms of percent contribution during the period of 2005-06, the secondary and higher education of the mother is explaining about 53% of the U5MR inequality, about 23% and 15% of U5MR inequality was explained by urban area as place of residence and scheduled caste/tribe caste group respectively. Secondary and higher education of the mothers again contributed high in U5MR inequality during 2015-16 and 2019-21. Nearly, 34% of U5MR inequality was explained by Hindu religion in 2015-16, while this contribution has reduced during the period of 2019-21. Further, U5MR inequality explained by urban area as place of residence was 27% during 2015-16, while it has reduced to 12% in 2019- 21. Overall, mother’s education and place of residence mostly explained the U5MR inequality in all three time periods in Table 4.
| Background characteristics | NFHS 3 (2005-06) | NFHS 4 (2015-16) | NFHS 5 (2019-21) | ||||||
|---|---|---|---|---|---|---|---|---|---|
| CI | Absolute CI | % Contribution | CI | Absolute CI | % Contribution | CI | Absolute CI | % Contribution | |
| Mother’s age | |||||||||
| 15-24 years® | - | - | - | - | - | - | - | - | - |
| 25-34 years | -0.0390 | -0.0084 | 3.0% | 0.0156 | -0.0131 | 2.4% | 0.0270 | -0.0362 | 5.2% |
| 35 years or more | 0.0300 | 0.0325 | -11.7% | -0.2288 | -0.0079 | 1.5% | -0.1426 | 0.0169 | -2.4% |
| Mother’s education | |||||||||
| No education® | - | - | - | - | - | - | - | - | - |
| Primary | 0.2386 | -0.0087 | 3.1% | -0.0597 | 0.0067 | -1.2% | -0.1677 | 0.0183 | -2.6% |
| Secondary | 0.4565 | -0.1009 | 36.3% | 0.2191 | -0.1316 | 24.5% | 0.0862 | -0.0890 | 12.7% |
| Higher | 0.8516 | -0.0749 | 27.0% | 0.5874 | -0.2308 | 43.0% | 0.4563 | -0.4149 | 59.4% |
| Caste/Tribe | |||||||||
| Others® | - | - | - | - | - | - | - | - | -- |
| Scheduled Caste/Tribe | -0.2244 | -0.0412 | 14.8% | -0.2497 | 0.0306 | -5.7% | -0.2102 | -0.0671 | 9.6% |
| Other backward classes | -0.0287 | -0.0020 | 0.7% | 0.0167 | -0.0019 | 0.4% | 0.0161 | -0.0006 | 0.1% |
| Religion | |||||||||
| Others® | - | - | - | - | - | - | - | - | - |
| Hindu | -0.0306 | 0.0062 | -2.2% | -0.0402 | -0.1849 | 34.4% | -0.0349 | -0.0927 | 13.3% |
| Muslims | 0.1081 | -0.0179 | 6.4% | 0.1477 | 0.1397 | -26.0% | 0.1484 | 0.0498 | -7.1% |
| Place of residence | |||||||||
| Rural® | - | - | - | - | - | - | - | - | - |
| Urban | 0.5313 | -0.0626 | 22.5% | 0.5278 | -0.1437 | 26.8% | 0.5211 | -0.0829 | 11.9% |
| Explained CI | |||||||||
| Total CI | -0.1191 | -0.2779 | - | -0.1077 | -0.5369 | - | -0.1029 | -0.6984 | - |
| Residual | - | 0.1588 | - | - | 0.4178 | - | - | 0.5955 | - |
We discuss the wide ranging and persistent factors of U5MR inequality in the state of Uttar Pradesh. An attempt has been made to measure the U5MR inequalities across three time periods viz. 2005-06, 2015-16 and 2019-21. The results show clear evidence of inequalities in under-five mortalities by various explanatory variables. Under-five mortalities were highly concentrated amongst the poor. The concentration index analysis strengthened the observation of poor and non-poor inequality in U5MR and the negative values of CIs indicated the burden of childhood mortality among the poor group in Uttar Pradesh. It was further observed that the U5MR inequality in the state of Uttar Pradesh has reduced in last one decade; however the size of reduction was less. From 2005-06, the CI for U5MR has been reduced only by 1.6 points in 2019-21. Additionally, for all three time periods, CCs consistently lie almost entirely above the line of equality, indicates pro-rich inequalities, which is under-five mortality is higher in lower wealth quintiles than in higher wealth quintiles. The result further suggests that mother’s education is one of the important factors contributing to the U5MR inequality. The event of early childhood mortality was comparatively lower among mothers with higher education. Another critical factor that contributed to U5MR inequality in the state of Uttar Pradesh was place of residence.
These findings suggest that more efforts are needed in the state of Uttar Pradesh to narrow the income related U5MR inequalities. An effective way to reduce inequality is not only to reduce the gap of income but also focus should be made on increasing the level of education of mothers as educational attainment is critical in imparting the feelings of self-worth and confidence which are critical in bringing the changes in health-related behaviour.
The findings suggest that more efforts are needed in the state of Uttar Pradesh to narrow the income related U5MR inequalities. An effective way to reduce inequality is not only to reduce the gap of income but also focus should be made on increasing the level of education of mothers as educational attainment is critical in imparting the feelings of self-worth and confidence which are critical in bringing the changes in health-related behaviour.
Authors declare no conflict of interest
Google Scholar, Crossref, Indexed at
Google Scholar, Crossref, Indexed at
Google Scholar, Crossref, Indexed at
Google Scholar, Crossref, Indexed at
Google Scholar, Crossref, Indexed at
Google Scholar, Crossref, Indexed at
Google Scholar, Crossref, Indexed at
Google Scholar, Crossref, Indexed at
Google Scholar, Crossref, Indexed at
Google Scholar, Crossref, Indexed at
Google Scholar, Crossref, Indexed at
Google Scholar, Crossref, Indexed at
Google Scholar, Crossref, Indexed at
Google Scholar, Crossref, Indexed at
Google Scholar, Crossref, Indexed at
Journal of Biometrics & Biostatistics received 3496 citations as per Google Scholar report


