Research Article - (2023) Volume 14, Issue 3
Received: 03-Oct-2019, Manuscript No. JBMBS-23-3161;
Editor assigned: 08-Oct-2019, Pre QC No. JBMBS-23-3161;
Reviewed: 21-Oct-2019, QC No. JBMBS-23-3161;
Revised: 30-Jun-2023, Manuscript No. JBMBS-23-3161;
Published:
10-Aug-2023
, DOI: 10.37421/2155-6180.2023.14.152
, QI Number: JBMBS-23-3161
Citation: Fenta, Setegn Muche and Haile Mekonnen Fenta. "Risk Factors of Under-Five Mortality in Ethiopia: Application of Count Regression Model." J Biom Biostat 14 (2023): 152.
Copyright: �?�© 2023 Fenta SM, et al. This is an open-access article distributed under the terms of the creative commons attribution license which permits unrestricted use,
distribution and reproduction in any medium, provided the original author and source are credited.
Background: Under-five mortality rate is considered as one of the most revealing measures of how well a society is meeting the wanted of its people. This study aim to identify factors that affect under-five mortality in Ethiopia.
Methods: The national level cross-sectional EDHS 2016 survey data were accessed and used for the analysis. A total of 14,370 women were included. Several count models such as Poisson, NB, ZIP, ZINB, HP and HNB models were fitted. Each of these models was compared by using LRT, Voung test and the information criteria’s.
Results: The data were found to have excess zeros (53.7%) and the variance (1.697) higher than its mean (0.90). HNB model was found to be a better fit to the dataset than the others count model. HNB model showed that fathers who have secondary and above education are about 32% less likely to die children compared with no formal education. Similarly, the risk of under-five death is 24% lower among the mothers having primary than those with no formal education. Babies delivered at private sector are 0.65 lower risk of under-five mortality compared to the babies delivered at home.
Conclusion: The findings suggested that vaccination of child, family size, antenatal visit, birth interval, contraceptive used, father education level, mother education level, place of delivery and age first birth were key determinants factor of under-five mortality. The ministry of health should work properly to raise the awareness of parents for vaccination, family planning services and efforts should be made to improve parental educational.
Some variables are not included because of large number of missing values like child weight at birth, anemia level and size of child at birth. In addition to this, the interaction term is not considered under this study due to convergence issue.
[Crossref] [Google Scholar] [PubMed]
[Crossref] [Google Scholar] [PubMed]
[Crossref] [Google Scholar] [PubMed]
[Crossref] [Google Scholar] [Crossref]
[Crossref] [Google Scholar] [PubMed]
[Crossref] [Google Scholar] [PubMed]
We would like to first and foremost give unreserved thanks to God Almighty for his grace and mercy which have been sufficient for me to this day. Finally, we would like to thank ministry of health and central statistical agency, government of Ethiopia, for making the data freely available for research purposes.
None.
The authors declare that no competing interests exist.
SM drafted the proposal, did the analysis, wrote the results and prepared the manuscript. HM participated on editing, analysis and write up of the result. All authors read and approved the final manuscript.
The data is available and may be delivered upon request.
Not applicable.
The study used secondary data available and released under the National Data Sharing and Accessibility Policy (NDSAP) of Government of Ethiopia. The data set had no identifiable information on the survey participants; therefore no ethical approval is required for this work.
Under five mortality • Ethiopia • Hurdle negative binomial • Count models
To minimize the under-five death, there is a need for comprehensive prevention strategies that will help to further reduce child mortality and the government/ministry of health should give greater attention to improve immunization services and concentrate on health education campaigns for mothers and for the community. Moreover, health interventions should particularly be targeted towards women who are suffering from illness and weakness to allow them to continue breastfeeding and Effort should be made for providing better access to education and health facilities for mothers so that the gab in under-five mortality is bridged.
This study has revealed region, mother’s age, education level of father, education level of father, fathers occupation, family size, age of mother at first birth, religion, vaccination of child, contraceptive use, birth order, preceding birth interval, child twin, place of delivery, antenatal visit and other factors were the important determinants of under-five death in Ethiopia.
Children are the human resource bank of every nation but, they are more vulnerable to diseases and other health risks. Under-five mortality therefore erodes the potential economic labor force of a country thus plunges the country into human resource crisis and retards development [10]. Therefore, this study has been attempted to identify socioeconomic, demographic, health and environmental related determinants of the number of under-five mortality based on EDHS, 2016 data set.
According to the result, parental education level is an important socio-economic predictor of under-five mortality, that is, mortality rate decreases with increase in parental education level. This result in lined with the previous study that, the higher the level of maternal and father education, the lower child mortality. The risk of underfive death associated with multiple births is very high relative to single births and this study is similar with the previous studies that birth type to be linked with under-five child death as multiple births is associated with a higher risk of child mortality. The result also showed that under-five mortality is decreased as the length of preceding birth interval increased which is in lined with different findings. The finding of the study revealed that the death of underfive children from mothers using contraceptive is significantly less than children from non-contraceptive methods using mothers. Those vaccinated children are lower risk of mortality than that of non-vaccinated children.
Mothers age at first birth are negatively correlated with under-five mortality that decreased the risk of under-five mortality as increase mother’s age at first birth. The estimated result also show that mothers age at first birth increases reduced the risk of under-five mortality and mothers born their first child at younger age face high under-five mortality risk which is similar with the previous studies conducted by different scholars. In addition to this, the study reported that for every unit increase in the ages of mother, the risk of under-five mortality increases [11-13]. The study showed that children born from working father have higher risk of mortality than non-working father. This finding is consistent with additionally, increase the number of antenatal visit during pregnancy is reduce the risk of under-five mortality and this finding is confirmed by the previous researches. Children born in public and private sector are at lower risk than those born at home. This might be due to the proper health care and attention they received during and after delivery. This has been confirmed by different studies.
The study also revealed that household size is an important variable that affects the number of under-five mortality. As household size increases the risk of under-five mortality significantly decreased [14,15]. Birth order increases the under-five mortality also increases and this result is consistent with the literature reviewed and contribution from different studies on birth order.
A total of 14,370 women from all the 11 regions of the country were included and 7720 (53.3%) of the mothers have not faced any under-five death and only 78 (0.5%) of them lost 7 of their under- five children. Since there is large number of zero outcomes, the histograms are highly picked at the very beginning (about the zero values) which leads to have a positively (or right) skewed distribution. Further screening of the number of under-five death calculated showed that the variance (1.697) is greater than the mean (0.9) indicating over-dispersion [5]. This is an indication that the data could be fitted better by count data models which takes into account excess zeroes (Table 1).
| Number of death | Frequency | Percent |
|---|---|---|
| 0 | 7720 | 53.7 |
| 1 | 3314 | 23.1 |
| 2 | 1773 | 12.3 |
| 3 | 798 | 5.6 |
| 4 | 413 | 2.9 |
| 5 | 198 | 1.4 |
| 6 | 76 | 0.5 |
| 7 | 78 | 0.5 |
| Total | 14370 | 100 |
| Mean | 0.9 | |
| Variance | 1.67 | |
Table 1. Frequency distribution of number of under-5 deaths per mothers.
The mean numbers under-five death for uneducated father (1.1063) is higher than fathers with secondary and above education (0.353) and the mean number of under-five death that children who are delivered at home (1.0995) have highest than those delivered health institutions (0.2507). Moreover, the highest and lowest mean number of child death is observed for child of birth order of four and above and first birth order (1.1189 and 0.6167) respectively.
The result also showed that the breastfeeding mothers have lower mean number of under-five deaths (0.6254) and the highest mean number of under-five death is occurred children born less than or equal to 24 months (1.0568) (Table 2).
| Variables | Categories | Mean | Std. D | Women (n) |
|---|---|---|---|---|
| Residence | Urban | 0.5816 | 1.094 | 2 512 |
| Rural | 0.9645 | 1.3251 | 11858 | |
| Education level of father | No education | 1.1063 | 1.4265 | 8250 |
| Primary | 0.7457 | 1.1365 | 4101 | |
| Sec. and above | 0.3531 | 0.7016 | 2019 | |
| Education level of mother | No Education | 1.1093 | 1.4111 | 9932 |
| Primary | 0.4861 | 0.871 | 3197 | |
| Sec. and above | 0.2627 | 0.5973 | 1241 | |
| Fathers occupation | No working | 1.0675 | 1.4414 | 2579 |
| Had working | 0.8604 | 1.2587 | 11791 | |
| Age of first birth | = 16 | 1.1596 | 1.4613 | 6065 |
| >16 | 0.7062 | 1.1222 | 8305 | |
| Type of birth | Single | 0.8556 | 1.2596 | 13813 |
| Multiple | 1.939 | 1.6889 | 557 | |
| Place of delivery | Home | 1.0995 | 1.3804 | 10884 |
| Public sector | 0.2691 | 0.6788 | 3107 | |
| Private sector | 0.2507 | 0.5846 | 379 | |
| Breast feeding | No | 1.2331 | 1.4524 | 6436 |
| Yes | 0.6254 | 1.0793 | 7934 | |
| Birth order | first birth | 0.6167 | 1.0082 | 3206 |
| 2-3 | 0.7851 | 1.2032 | 4705 | |
| 4 and above | 1.1189 | 1.4421 | 6459 | |
| Contraceptive used | No | 0.9965 | 1.3607 | 10976 |
| Yes | 0.5775 | 0.994 | 3394 | |
| Vaccination of child | No | 1.014 | 1.3573 | 11881 |
| Yes | 0.3419 | 0.7256 | 2489 | |
| Antenatal visit | No visit | 1.1856 | 1.4147 | 9658 |
| 1-3 | 0.3599 | 0.755 | 2092 | |
| 4 and above | 0.2649 | 0.6638 | 2620 | |
| Previous birth interval | 0-24 months | 1.0568 | 1.412 | 7129 |
| 25-36 months | 0.9061 | 1.2517 | 3407 | |
| >36 months | 0.5939 | 1.0272 | 3834 |
Table 2. Summary statistics of predictor variables related to under-five death in Ethiopia.
Goodness of fit and test of over dispersion result indicated that over-dispersion problems and the negative binomial model more appropriate than the Poisson model [6].
HNB model is the most appropriate and preferred model among the six for describing the number of under-five deaths per mother (Table 3).
| Model | Def. | AIC | BIC | Deviance |
|---|---|---|---|---|
| Poisson | 32 | 30218.3 | 30460.7 | 30154.3 |
| NB | 33 | 30198.2 | 30448.1 | 30132.2 |
| ZIP | 50 | 29746.6 | 30125.3 | 29646.6 |
| ZINB | 51 | 29737.1 | 30123.3 | 29635.1 |
| HP | 50 | 29457 | 29828 | 29359 |
| HNB | 51 | 29427 | 29813.2 | 29325 |
Table 3. Model selection criteria for the count regression models.
Parameter estimation of HNB model
The expected number of non-zero under-five death for vaccinated children are decreased by 0.63 as compared with non-vaccinated children (Table 4).
| Count part | Estimate | S. E | z-value | P-value | IRR | 95% CI of IRR | |
|---|---|---|---|---|---|---|---|
| Lower | Upper | ||||||
| Intercept | -1.6287 | 0.1079 | -15.09 | 0.0001 | 0.196 | 0.159 | 0.242 |
| Vaccination child (No) (Ref) | |||||||
| Yes | -0.3357 | 0.0644 | -5.22 | 0.0001 | 0.715 | 0.63 | 0.811 |
| Region (Tigray) | |||||||
| Affar | 0.2106 | 0.0699 | 3.01 | 0.002 | 1.234 | 1.076 | 1.416 |
| Amhara | 0.1262 | 0.0577 | 2.19 | 0.029 | 1.135 | 1.013 | 1.27 |
| Oromia | -0.0197 | 0.0668 | -0.3 | 0.768 | 0.981 | 0.86 | 1.117 |
| Somali | 0.1262 | 0.0706 | 1.79 | 0.073 | 1.134 | 0.988 | 1.303 |
| Benshangul-Gumuz | 0.3883 | 0.0658 | 5.9 | 0.0001 | 1.475 | 1.296 | 1.678 |
| SNNP | 0.168 | 0.0672 | 2.5 | 0.012 | 1.183 | 1.037 | 1.349 |
| Gambela | -0.1563 | 0.0919 | -1.7 | 0.089 | 0.855 | 0.714 | 1.024 |
| Harari | -0.1269 | 0.0946 | -1.34 | 0.179 | 0.881 | 0.732 | 1.06 |
| Addis Ababa | -0.4455 | 0.1795 | -2.48 | 0.013 | 0.641 | 0.451 | 0.911 |
| Dire Dawa | 0.1838 | 0.0759 | 2.42 | 0.015 | 1.202 | 1.036 | 1.395 |
| Family size | -0.0423 | 0.0056 | -7.58 | 0.0001 | 0.959 | 0.948 | 0.969 |
| Age of mother | 0.053 | 0.0019 | 27.3 | 0.0001 | 1.054 | 1.05 | 1.058 |
| Antenatal visit (No) | |||||||
| 1-3 | -0.252 | 0.0672 | -3.75 | 0.0001 | 0.777 | 0.681 | 0.887 |
| 4 and above | -0.2518 | 0.0751 | -3.35 | 0.0001 | 0.777 | 0.671 | 0.901 |
| PB interval (≤ 24 months) | |||||||
| 25-36 months | -0.2362 | 0.0306 | -7.73 | 0.0001 | 0.79 | 0.744 | 0.838 |
| 37 and above | -0.3729 | 0.0369 | -10.09 | 0.0001 | 0.689 | 0.641 | 0.74 |
| Birth order (First) | |||||||
| 1-3 | 0.3912 | 0.0429 | 9.12 | 0.0001 | 1.479 | 1.359 | 1.608 |
| 4 and above | 0.4831 | 0.0408 | 11.84 | 0.0001 | 1.621 | 1.496 | 1.756 |
| Religion (Orthodox) | |||||||
| Muslim | 0.1651 | 0.044 | 3.75 | 0.0001 | 1.179 | 1.082 | 1.286 |
| Others | 0.1482 | 0.0518 | 2.86 | 0.004 | 1.16 | 1.048 | 1.284 |
| Contraceptive use (No) | |||||||
| Yes | -0.1747 | 0.0387 | -4.51 | 0.0001 | 0.84 | 0.778 | 0.906 |
| Father’s education (No education) | |||||||
| Primary | -0.0609 | 0.0324 | -1.88 | 0.06 | 0.941 | 0.883 | 1.003 |
| Secondary or above | -0.3854 | 0.0758 | -5.09 | 0.0001 | 0.68 | 0.586 | 0.789 |
| Mother’s education (No education) | |||||||
| Primary | -0.267 | 0.0456 | -5.86 | 0.0001 | 0.766 | 0.7 | 0.837 |
| Secondary or above | -0.208 | 0.1189 | -1.75 | 0.08 | 0.812 | 0.643 | 1.025 |
| Father occupation (No) | |||||||
| Had working | 0.102 | 0.0311 | 3.28 | 0.0001 | 1.107 | 1.042 | 1.177 |
| P delivery (home) | |||||||
| Public sector | -0.0678 | 0.0682 | -0.99 | 0.32 | 0.934 | 0.817 | 1.068 |
| private sector | -0.4312 | 0.2087 | -2.06 | 0.038 | 0.649 | 0.432 | 0.978 |
| Child twin (single) | |||||||
| Multiple | 0.3862 | 0.0404 | 9.55 | 0.0001 | 1.471 | 1.359 | 1.593 |
| AMF birth (≤ 16) | |||||||
| 17 and above | -0.3612 | 0.0251 | -14.36 | 0.0001 | 0.697 | 0.663 | 0.732 |
| Log (theta) | 3.6869 | 0.5794 | 6.363 | 0.0001 | - | - | - |
Table 4. Parameter estimates of HNB regression model.
The risk of under-five child mortality is 1.475, 1.234 and 1.202, 1.183 and 1.013 times higher among under-five children born to mothers from Benishangul-Gumuz, Affar, Dire Dawa, SNNP and Amhara regions as compared to children born inTigray respectively. Unexpectedly, the risk of under-five death increases as family size decreases [6]. For a unit increased family size, then the expected number of non-zero under-five death per mother is decreased by 0.04%. The result also revealed that the expected number of nonzero under-five death whose mothers visited at least 4 times during pregnancy is 0.77 times lower compared to child whose mothers who have not received any antenatal check during pregnancy.
The expected number of non-zero under-five death with children born more than 36 months after the previous birth decreased by 31 percent relative to children born less than 2 years after the previous birth. In addition to this as birth order increases the under-five mortality shown an increase [7]. The expected number of non-zero under five deaths with children’s birth order 4 and above is increased by 47.9% as compared to the first order. The result revealed that mother’s and father’s levels of education have a significant factor on the number of under-five death. The expected number of non-zero under-five death for mothers with primary education is 0.77 times lower as compared to those with noneducated and fathers with secondary and above education is 0.68 times lower as compared to those with non-educated. The result also shown the expected number of non-zero under-five death in multiple births is 1.47 times greater as compared to the single birth (Table 3).
The zero inflated HNB part also indicted that the estimated odds that the number of under-five death becomes zero with vaccinated children is 1.78 times as compared to non-vaccinated children [8]. An increase in family size by 1 result, the estimated odds that the number of under-five death becomes zero is increased by 23%. The result also revealed that the estimated odds that the number of under-five death becomes zero with mothers visit 4 and above is 2.32 times higher as compared to the reference category and the estimated odds that the number of under-five death with mothers who are used contraceptive is 1.30 times more than as compared to mothers who were not used. The finding also showed that estimated odds that the number of under-five death becomes zero with children who are born at private sector are 2.08 times higher as compared to children who are born at home. And also, the probability under-five death decreased with increasing educational level of mother [9]. The estimated odds that the number of under-five death becomes zero with mother who have secondary and above education are 1.50 times more than non-educated mother (Table 5).
| Count part | Estimate | S. E | z-value | P-value | IRR | 95% CI of IRR | |
|---|---|---|---|---|---|---|---|
| Lower | Upper | ||||||
| Vaccination child (No) | |||||||
| Yes | 0.5773 | 0.0589 | 9.8 | 0.0001 | 1.781 | 1.587 | 1.999 |
| Family size | 0.2038 | 0.0111 | 18.29 | 0.0001 | 1.226 | 1.2 | 1.253 |
| Age of mother | -0.1834 | 0.0041 | -44.88 | 0.0001 | 0.832 | 0.826 | 0.839 |
| Antenatal visit (No) | |||||||
| 1-3 | 0.6663 | 0.0652 | 10.22 | 0.0001 | 1.947 | 1.713 | 2.213 |
| 4 and above | 0.8398 | 0.0701 | 11.98 | 0.0001 | 2.316 | 2.019 | 2.657 |
| PB interval (≤ 24months) | |||||||
| 25-36 months | 0.5595 | 0.0536 | 10.44 | 0.0001 | 1.75 | 1.575 | 1.944 |
| 37 and above | 1.2534 | 0.0559 | 22.41 | 0.0001 | 3.502 | 3.139 | 3.908 |
| Contraceptive use (No) | |||||||
| Yes | 0.2557 | 0.0545 | 4.69 | 0.0001 | 1.291 | 1.161 | 1.437 |
| Father’s education (No education) | |||||||
| Primary | -0.0665 | 0.0511 | -1.3 | 0.192 | 0.936 | 0.847 | 1.034 |
| Secondary or above | 0.1691 | 0.082 | 2.06 | 0.039 | 1.184 | 1.008 | 1.391 |
| Mother’s education (No education) | |||||||
| Primary | 0.1339 | 0.058 | 2.31 | 0.02 | 1.143 | 1.02 | 1.281 |
| Secondary or above | 0.4052 | 0.1084 | 3.74 | 0.0001 | 1.5 | 1.212 | 1.855 |
| Father occupation (No) | |||||||
| Had working | -0.3262 | 0.0597 | -5.46 | 0.0001 | 0.722 | 0.641 | 0.811 |
| P delivery (home) | |||||||
| Public sector | 0.6399 | 0.0653 | 9.8 | 0.0001 | 1.896 | 1.669 | 2.155 |
| private sector | 0.7339 | 0.1521 | 4.82 | 0.0001 | 2.083 | 1.546 | 2.807 |
| Child twin (single) | |||||||
| Multiple | -1.3285 | 0.1241 | -10.7 | 0.0001 | 0.265 | 0.208 | 0.338 |
| AMF birth (≤ 16) | |||||||
| 17 and above | 1.0524 | 0.0459 | 22.92 | 0.0001 | 2.865 | 2.618 | 3.134 |
Table 5. Zero-inflation part.
The data used for this study was taken from the 2016 EDHS which is a nationally representative survey of women’s age (15-49 years age) groups taken from the CSA, Ethiopia. This survey is the fourth compressive survey designed to provide estimates for the health and demographic variables of interest for the whole urban and rural areas of Ethiopia as a domain. In all of the selected households, measurements were collected from children age 0-59 months, women age 15-49 years, and men age 15-59 years old.
Variables of the study
The main outcome variable in this study is the number of underfive death per mother. Thus, this paper attempts to include socioeconomic, demographic and health and environmental related factors that are assumed as a potential determinants for the barriers in the number of number of under-five death per mother, adopted from literature reviews and their theoretical justification.
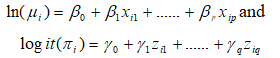
Statistical models
Count regression models were developed to model data with integer outcome variables. The most popular model for count data is the Poisson model, which is based on the property that the mean and variance of the dependent variable are assumed to be equal. However, this is not always the case, as the variance sometimes exceeds the mean. This is referred to as over dispersion. Over dispersion can be modeled using Negative Binomial (NB) regression model, but more models accounting for over dispersion exist. The negative binomial regression model assumes a gamma distribution for the Poisson mean with variation over the subjects. Further, the response variable can been observed to show excess zero counts, contrary to what is expected, on the basis of Poisson or negative binomial distribution. According to, this is an implication that the count data are zero inflated. Zero-inflated models allow for over dispersion as well as modeling zero-inflated count data. The frequently used models for zero inflated count data are Zero-Inflated Poisson (ZIP) and Zero-Inflated Negative Binomial (ZINB). When the sample variance is larger (or smaller) than the sample mean, the data is said to exhibit over-dispersion (or under-dispersion). In overcoming the problem of over-dispersion or under-dispersion, we employed hurdle regression model.
Poisson regression model
The Poisson distribution was developed to model discrete counts. This distribution becomes increasingly positively skewed as the mean of the dependent variable decreases reflecting a common property of count data. The probability function for Y is given by
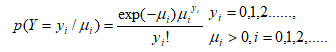
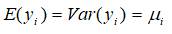
Where, yi is the number of under-five deaths the ith mother in a given time with a mean parameter μi. The mean and variance of Poisson distribution is given as
Negative Binomial regression model (NB)
The NB is frequently used to study count data with overdispersion. In fact, the NB model is in many ways equivalent to the Poisson regression model because the NB model could be viewed as a Poisson-gamma mixture model. However, the difference is that the NB model has a free dispersion parameter. The probability function is given by:
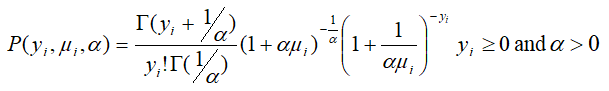
Where α is the over dispersion parameter and Γ(.) is the gamma function when α=0 the negative binomial distribution is the same as Poisson distribution. The mean and variance are expressed as:

Zero-inflated count regression models
The NB model might not be appropriate if the over-dispersion is caused by an excessive number of zeros in the outcome which is stated asa dual-state method for modeling data characterized by a significant amount of zeros or more zeros than the one would expect in a traditional Poisson or negative binomial model, while the ZINB model, introduced by is a more flexible model that can be used to handle over-dispersion caused by both unobserved heterogeneity and excess zeroes. Zero-inflated regression also considers two data generating processes and it assumes zero counts come from two different sources. Specifically, a zero count may come from the always-zero group (mothers who are never born) or the not-always-zero group (mothers who may not be dead her child) [2].
Zero-inflated regression is also a two-part model. A Logit model determines if a zero count is from the always-zero group or the not-always-zero group and a baseline model, either Poisson or negative binomial, governs both zero and positive counts from the not-always-zero group.
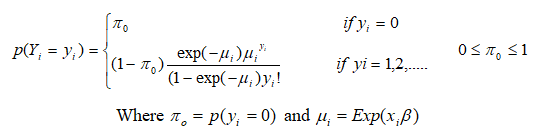
Zero-Inflated Poisson (ZIP) regression model
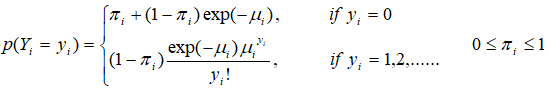
ZIP model, well described by is a simple mixture model for count data with excess zeros. The model is a combination of a Poisson distribution and a degenerate distribution at zero. Specifically if Yi is the number of under-five mortality per mothers are independent random variables having a zero-inflated Poisson distribution, the zeros are assumed to arise in two ways corresponding to distinct underlying states. The first state occurs with probability πi and produces only zeros (mothers who are never born), while the other state occurs with probability 1-πi and leads to a standard Poisson count with mean μ and hence a chance of further zeros (mothers who may not be dead her child). In general, the zeros from the first state are called structural zeros and those from the Poisson distribution are called sampling zeros. This two-state process gives a simple two-component mixture distribution with probability mass function.
The parameter μi and πi depends on the covariates xi and zi, respectively. The mean and the variance of ZIP regression model, respectively, are:

To apply the zero-inflated Poisson model in practical modelling situations, suggested the following joint models for μ and π
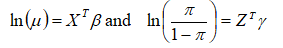
Where X and Z are covariate matrices and are and β ɣ are (p+1) × 1 and (q+1) × 1 vectors of unknown parameters respectively. The two sets of covariates may or may not coincide. For a random sample of observation y1, y2,…., yn log-likelihood function is given by:

Where I(.) is the indicator function for the specified event, i.e. equal to 1 if the event is true and 0 otherwise.
Zero-Inflated Negative Binomial (ZINB) regression model
However, ZIP model may often fail to fit such data either because of over-dispersion in relation to the Poisson distribution. We extend the ZIP mixed regression model to ZINB mixed regression model. The ZINB regression is used for count data that exhibit over-dispersion and excess zeros.
Suppose Yi is the number of under-five mortality per mother then, the probability mass function of ZINB is given by:
Where μi the mean of the underlying negative binomial distribution and α is the over-dispersion parameter. The ZINB distribution reduces to the ZIP distribution as α→0. The mean and variance, E(Yi)=(1-πi) μi and Var(Yi)=(1-πi)(1+πiμi+αμi) respectively.
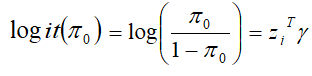
In the terminology of Generalized Linear Models (GLMs) ln(μi) and logit(πi) are the natural links for the negative binomial mean and Bernoulli probability of success.
Where xi and zi are respectively vectors of covariates for the negative binomial and the logistic components, β and ɣ are the corresponding vectors of regression coefficients.
Hurdle models
The development of the hurdle model is driven by the motivation to solve the problem of excessive number of zeros. This refers to observing more zeros than predicted by baseline count models such as Poisson or Negative Binomial. The hurdle regression handle the excess zeros by relaxing the assumption that zeros and positives come from a single data generating process. A hurdle model is introduced by for the analysis of over-dispersed or under-dispersed count data [3]. The hurdle model approach is a 2-part count regression method that deals with the phenomenon of excess zeros in the data. The first component of a hurdle model, typically a binomial distribution, determining if a count is zero or positive) in the overall population, as it targets all zero counts. The second part is a truncated at zero model governing the positive counts, i.e. E(Yi/Yi>0).
The Poisson hurdle model
Poisson Logit Hurdle (PLH) model is a two-component model comprising of a hurdle component models zero versus non-zero counts, and a truncated Poisson count component is employed for the non-zero counts. Its probability density function is given as:
For PLH model, the most natural choice to model probability of zeros is to use a logistic regression model.
Where zi=(1, zi1, zi2,…., ziq) is the ith row of covariate matrix Z and ɣ=( ɣ1, ɣ2,…., ɣq ) are unknown q-dimensional column vector of parameters. While the effect of covariates zi on strictly positive (that is censored). Count data are modeled through Poisson regression:
Where xi=(1, xi1, xi2,…., xip) is the ith row of covariate matrix x and β=( β1, β2,…., βp) and are unknown p-dimensional column vector of parameters.
The log-likelihood function of a Logit-Poisson regression therefore, can be expressed as the sum of log-likelihood functions of two components as below:

The negative binomial hurdle model
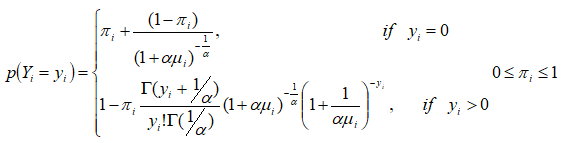
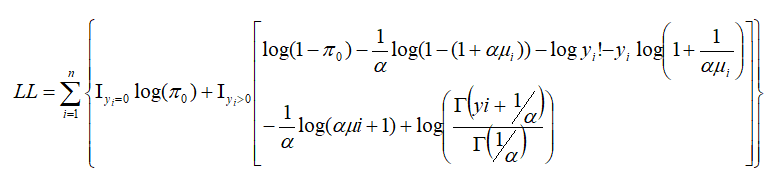
Similarly, for the hurdle models, the Negative Binomial Hurdle can be used instead of Poisson distribution above in case of over-dispersion. We consider a Hurdle Negative Binomial (HNB) regression model in which the response variable has the Yi=(i=1,2,3…,n)has the distribution.
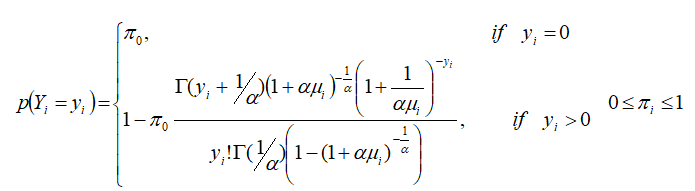
Where α ≥ 0 is a dispersion parameter that is assumed not to depend on covariates. In addition, we suppose 0<π0<1 and π0=π0(zi) satisfy.
The most natural choice to model probability of excess zeros is to use a logistic regression model:
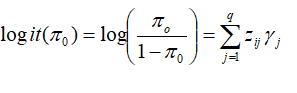
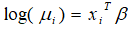
Where zi== (1, zi1, zi2,…., ziq) is the ith row of covariate matrix z and are ɣ= (ɣ1, ɣ2,…., ɣq) unknown q-dimensional column vector of parameters. Impact of covariates on count data modeled through NB regression.
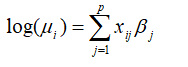
xij is the covariates, β is the coefficient of the independent variables in the regression model and p is the number of these independent variables.
We now obtain the log-likelihood function for the hurdle negative binomial regression model, we have
Assessing model adequacy
The maximum likelihood estimation method is used to assess the adequacy of any two or more than two nested models by using Likelihood Ratio Test (LRT). It compares the maximum likelihood under the alternative hypothesis with the null hypothesis [4]. For instance, the null hypothesis can be the overdispersion parameter is equal to zero (i.e. the Poisson distribution can be fitted well the data) and the alternative hypothesis can be the data would be better fitted by the Negative binomial regression (i.e. the over-dispersion parameter is different from zero). The likelihood ratio test is defined as:
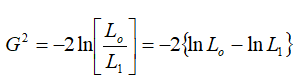
Where L0 and L1 are the maximized log-likelihood of models under the null and alternative a hypothesis respectively. This method is not appropriate for models which are not nested one on the other. If there are several models to be compared in order to select the best model which fits the data instead of using the likelihood ratio test, it can be easily select by using the akaike information.
One of the objectives of the Sustainable Development Goals (SDG) is to reduced under-five mortality rate and improvement in maternal health which by implication increases the chance of child survival. Under-five mortality rate is regarded as one of the most revealing measures of how well a society is meeting the wanted of its people. Every year, millions of children under-five years of age die. In 2016, 5.6 million children died before their fifth birthday. About 15,000 children still die every single day globally. The level of under-five mortality remains high in certain regions of the world, especially in Southern Asia and sub-Saharan Africa. In Ethiopia, the under-five mortality rate stands at 67 per 1000 live births, with large disparities in her different regions. Every 15 children die before reaching the fifth birthday and if the situations continue as such, more than 3,084,000 children will die until 2030.
A number of studies that have been carried out to investigate the determinants of under-five mortality in different countries. However, in Ethiopia, many types of research have done on small-scale survey data as well as a limited number of variables. Moreover, studies have been investigated under-five mortality risk factors through binary logistic and survival analysis. However, binary logistic regression undercounts the total number of mortality since multiple mortalities are collapsed into a single unit to fulfill the requirements of binary logistic regression. Besides, binary logistic regression cannot provide sufficient information for studying the pattern of multiple child deaths that means it merely predicts the death/alive under-five rather than the number of under-five mortality.
Until now, only one study has tried to predict the number of underfive mortality in Ethiopia. This study showed that a negative binomial model describes the number of under-five mortality better than the Poisson model due to excess variability, a condition called over-dispersion. The fitted negative binomial model assumed that the over-dispersion occurred entirely due to unobserved heterogeneity. However, count data often involve over-dispersion not only due to unobserved heterogeneity but also due to the excess of zero frequency. Consequently, the Poisson or the negative binomial distributions may not satisfactorily account for excess variability if this variability is indeed due to excess zeros. In such situations, use of these models may likely underestimate the number of under-five mortality, and may provide misleading results [1]. Zero hurdle or zero inflated regression models can be used to increase predictability in situations with excess zeros.
Therefore, this study was aiming to investigate the major socio-economic, demographic, health and environmental proximate factors that might influence under-five mortality in Ethiopia with different count model approaches.
CSA: Central Statistical Agency; EDHS: Ethiopian Demographic and Health Survey; HNB: Hurdle Negative Binomial; HP: Hurdle Poisson; LRT: Likelihood Ratio Test; NB: Negative Binomial; ZINB: Zero-Inflated Negative Binomial; ZIP: Zero-inflated Poisson
Journal of Biometrics & Biostatistics received 3496 citations as per Google Scholar report


