Research Article - (2026) Volume 17, Issue 1
Received: 07-Oct-2024, Manuscript No. JFR-24-149683;
Editor assigned: 10-Oct-2024, Pre QC No. JFR-24-149683 (PQ);
Reviewed: 25-Oct-2024, QC No. JFR-24-149683;
Revised: 10-Feb-2026, Manuscript No. JFR-24-149683 (R);
Published:
17-Feb-2026
, DOI: 10.37421/2157-7145.2025.17.658
Citation: Dalou, Ahmad Y. Abu and Abdel-Halim Al-Shiyab. "Reliability of Head Shape as a Predictor of Ethnic Group for Forensic and Bioarchaeological Purposes." J Forensic Res 17 (2026): 658.
Copyright: © 2025 Dalou AYA, et al. This is an open-access article distributed under the terms of the creative commons attribution license which permits unrestricted use, distribution and reproduction in any medium, provided the original author and source are credited.
This study aimed to assess head shape as a determinant for ethnic group. A total of 1232 subjects were chosen. Both head length and width were measured. All and their grandparents were born and living in Jordan. The sample was selected from Jordanians, Chechens, and Circassians from both sexes, who all living under the same physical and social environment. Chi-square was used to examine the difference between the observed and expected head shape. This study shows there is a significant difference in head shape across the three ethnic groups at p<.05. But when the association between head shape, an independent category, and ethnic group, and a dependent, one was examined, statistical analysis points to a weak relation between head shape and ethnic group. We conclude that scientists cannot rely on head shape confidently to predict ethnic group in the forensic context.
Ethnic group • Head shape • Jordanians • Chechens • Circassians
Head shape, as determined by the calculated Cephalic Index (CI) value, has a substantial beneficial role in numerous fields of forensics. Values of CI are calculated according to the equation; CI=maximum head breadth × 100/maximum head length [1]. Several components are necessarily obtained from victim's skeletal remains present in the crime scene. Some of these are strongly linked to the victim him or herself. It is worth to mention that criminologists exploit many qualitative and quantitative traits to assess victim ethnicity. Identification of the victim ethnicity background introduces significant information as well as those can be obtained about sex, age, time since death, and manner of death, etc. Head form, as a qualitative trait, is recognized by forensic anthropologists a very informative genetic trait to determine race among living and skeletal populations.
Four normal head/cranial forms exist in human living and skeletal populations. These are dolichocephaly, mesocephaly, brachycephaly, and hyperbrachycephaly [2]. According to findings of several studies, head shapes are distributed differently across human populations. When head shape of Eastern European population with of Western Europe. The first displays rounder head than of the second [3].
He is first in 1899 who published a study, that is considered a remarkable one on head shape, Franz Boas measured several cephalometrics including head length, width, and CI of 239 Sioux Indians. In 1910, Boas published the most important and famous study on head shape and concluded that head shape is a plastic trait, and extrinsic factors have a significant role on shaping the head. His conclusion was reached according to the findings of his comparative study on United states born children and their born Eastern Europe born parents who migrated to the United States [4]. But recently, Sparks and Jantz found a statistical analysis problem in Boas' data treatment. As a result of that, they strongly criticized results and conclusion of Boas' study. They pointed to, based on their statistical analysis of Boas' data, that he did not emphasize rigorously on the impact of genes in shaping the head. Lately, researchers at University of Pittsburgh have identified 30 regions of the genome that have an important influence on head shape. In their extremely prominent work, they discovered new 29 regions [5].
A study examined shape of 100 dried skulls present in some academic institutions in Punjab, Pakistan. The study showed that the most frequent shape among Punjab population in Pakistan is dolichocephaly [6]. A study aimed to investigate the same inheritable trait among North Indian population found that mesaticephaly is the most common. Anthropometrics, included head length and width, were taken from a sample of two hundred medical students aged between 18 yrs and 25 yrs [7].
Both genes and environmental factors interact and influence phenotypic plasticity of many qualitative traits among humans. Furthermore, external factors have a great impact on gene expressions.
A research team encompassed professionals trained in medicine and anthropology worked in the City of Zarga of Jordan, where the majority of Chechen (Ch.) and (Ci.) ethnic groups live. Researchers gathered a group of health indicators and assessed many anthropometrics. The second author, a biological anthropologist, was a member of the team, who measured several cephalometrics, including head length and width, for a sample of subjects for the two ethnic groups; Chechens and Circassians. The second author, who trained in biological anthropology with his research assistant, assessed several anthropometrics of 745 adult Jordanians (Jo.) living in Irbid and Jerash in North Jordan. While Jordanian sample was divided into 352 (47.2%) and 393 (52.8%), of Chechen into 117 (22.5%) and 244 (34.4%), and of Circassians into 52 (10%) and 73 (10.3%) for males and females, respectively. Both head length and width were assessed for this study according to the standardized method. All subjects and their grandparents selected were born and living under similar socio-economic conditions in Jordan.
Statistical treatment
In order to examine the association between head shape, an independent variable, and ethnic group, a dependent one, Chi-square statistical test was used. The analysis was conducted on SPSS.
Table 1 Shows number of males and females and percentage in the study sample by ethnic group; Jordanians, Chechens, and Circassians.
| Sex* Ethnic group cross tabulation | ||||
| Ethnic group | ||||
| Jo. | Ch. | Ci. | Total | |
| F | 393 | 244 | 73 | 710 |
| 55.40% | 34.40% | 10.30% | 100.00% | |
| M | 352 | 117 | 52 | 521 |
| 67.60% | 22.50% | 10.00% | 100.00% | |
| Total | 745 | 362 | 125 | 1232 |
Table 1. Number of males and females.
Table 2 shows number and percentage of each head shape by ethnic group and sex.
|
Head shape * Ethnic G * Sex cross tabulation |
|||||||
|
Ethnic G |
|||||||
|
Sex |
Jo. |
Ch. |
CI. |
Total |
|||
|
F
|
Head Shapea
|
B
|
Count |
118 |
72 |
17 |
207 |
|
Expected count |
114.6 |
71.1 |
21.3 |
207 |
|||
|
% within head shape |
57.00% |
34.80% |
8.20% |
100.00% |
|||
|
% within ethnic G |
30.00% |
29.50% |
23.30% |
29.20% |
|||
|
% of total |
16.60% |
10.10% |
2.40% |
29.20% |
|||
|
D
|
Count |
48 |
4 |
1 |
53 |
||
|
Expected count |
29.3 |
18.2 |
5.4 |
53 |
|||
|
% within head shape |
90.60% |
7.50% |
1.90% |
100.00% |
|||
|
% within ethnic G |
12.20% |
1.60% |
1.40% |
7.50% |
|||
|
% of total |
6.80% |
0.60% |
0.10% |
7.50% |
|||
|
H
|
Count |
112 |
150 |
55 |
317 |
||
|
Expected count |
175.5 |
108.9 |
32.6 |
317 |
|||
|
% within head shape |
35.30% |
47.30% |
17.40% |
100.00% |
|||
|
% within ethnic G |
28.50% |
61.50% |
75.30% |
44.60% |
|||
|
% of total |
15.80% |
21.10% |
7.70% |
44.60% |
|||
|
M
|
Count |
115 |
18 |
0 |
133 |
||
|
Expected count |
73.6 |
45.7 |
13.7 |
133 |
|||
|
% within head shape |
86.50% |
13.50% |
0.00% |
100.00% |
|||
|
% within ethnic G |
29.30% |
7.40% |
0.00% |
18.70% |
|||
|
% of total |
16.20% |
2.50% |
0.00% |
18.70% |
|||
|
Total
|
|
Count |
393 |
244 |
73 |
710 |
|
|
|
Expected count |
393 |
244 |
73 |
710 |
||
|
|
% within head shape |
55.40% |
34.40% |
10.30% |
100.00% |
||
|
|
% within ethnic G |
100.00% |
100.00% |
100.00% |
100.00% |
||
|
|
% of total |
55.40% |
34.40% |
10.30% |
100.00% |
||
|
M
|
Head Shapea
|
|
Count |
0 |
1 |
0 |
1 |
|
|
Expected count |
0.7 |
0.2 |
0.1 |
1 |
||
|
|
% within head shape |
0.00% |
100.00% |
0.00% |
100.00% |
||
|
|
% within ethnic G |
0.00% |
0.90% |
0.00% |
0.20% |
||
|
|
% of total |
0.00% |
0.20% |
0.00% |
0.20% |
||
|
B
|
Count |
111 |
36 |
13 |
160 |
||
|
Expected count |
108.1 |
35.9 |
16 |
160 |
|||
|
% within head shape |
69.40% |
22.50% |
8.10% |
100.00% |
|||
|
% within ethnic G |
31.50% |
30.80% |
25.00% |
30.70% |
|||
|
% of total |
21.30% |
6.90% |
2.50% |
30.70% |
|||
|
D
|
Count |
12 |
0 |
0 |
12 |
||
|
Expected count |
8.1 |
2.7 |
1.2 |
12 |
|||
|
% within head shape |
100.00% |
0.00% |
0.00% |
100.00% |
|||
|
% within ethnic G |
3.40% |
0.00% |
0.00% |
2.30% |
|||
|
% of total |
2.30% |
0.00% |
0.00% |
2.30% |
|||
|
H
|
Count |
127 |
72 |
38 |
237 |
||
|
Expected count |
160.1 |
53.2 |
23.7 |
237 |
|||
|
% within head shape |
53.60% |
30.40% |
16.00% |
100.00% |
|||
|
% within ethnic G |
36.10% |
61.50% |
73.10% |
45.50% |
|||
|
% of total |
24.40% |
13.80% |
7.30% |
45.50% |
|||
|
M
|
Count |
102 |
8 |
1 |
111 |
||
|
Expected count |
75 |
24.9 |
11.1 |
111 |
|||
|
% within head shape |
91.90% |
7.20% |
0.90% |
100.00% |
|||
|
% within ethnic G |
29.00% |
6.80% |
1.90% |
21.30% |
|||
|
% of total |
19.60% |
1.50% |
0.20% |
21.30% |
|||
|
Total
|
|
Count |
352 |
117 |
52 |
521 |
|
|
Expected count |
352 |
117 |
52 |
521 |
|||
|
% within head shape |
67.60% |
22.50% |
10.00% |
100.00% |
|||
|
% within ethnic G |
100.00% |
100.00% |
100.00% |
100.00% |
|||
|
% of total |
67.60% |
22.50% |
10.00% |
100.00% |
|||
|
Note: a: B: Brachycephaly; D: Dolichocephaly; H: Hyperbrachycephaly; M: Mesocephaly |
|||||||
Table 2. Number and percentage of each head shape by ethnic group and sex.
The results of Chi-square statistical procedure are presented in Table 3. For females, value for Pearson Chi-square is 135.14, df=6, p<0.001. The result is significant at p<.05. Moreover, computed Pearson Chi-Square is 62.407, df=8, p<.001. The finding is significant at p<.05.
| Chi-square tests | |||||
| Value | df | Asymptotic significance (2-sided) | |||
| Sex | Pearson Chi-square | .b | |||
| N of valid cases | 1 | ||||
| F | Pearson Chi-square | 135.140c | 6 | <.001 | |
| Likelihood ratio | 154.769 | 6 | <.001 | ||
| N of valid cases | 710 | ||||
| M | Pearson Chi-square | 62.409d | 8 | <.001 | |
| Likelihood ratio | 73.489 | 8 | <.001 | ||
| N of valid cases | 521 | ||||
| Total | Pearson Chi-square | 189.961a | 8 | <.001 | |
| Likelihood ratio | 217.522 | 8 | <.001 | ||
| N of valid cases | 1232 | ||||
| Note: a. 3 cells (20.0%) have expected count less than 5. The minimum expected count is .10. b. No statistics are computed because Head Shape and Ethnic G are constants. c. 0 cells (.0%) have expected count less than 5. The minimum expected count is 5.45. d. 5 cells (33.3%) have expected count less than 5. The minimum expected count is .10. |
|||||
Table 3. Chi-square results on head shape of both sexes by ethnic groups.
Values of both Phi and Cramer’s V for males and females are in Table 4. According to their results, the relationship between head shape and ethnic group is statistically significant, but very weak among both sexes.
| Symmetric measures | ||||
| Sex | Value | Approximate significance | ||
| Nominal by nominal | Phi | .c | ||
| N of valid cases | 1 | |||
| F | Nominal by nominal | Phi | 0.436 | <.001 |
| Cramer's V | 0.308 | <.001 | ||
| N of valid cases | 710 | |||
| M | Nominal by nominal | Phi | 0.346 | <.001 |
| Cramer's V | 0.245 | <.001 | ||
| N of valid cases | 521 | |||
| Total | Nominal by nominal | Phi | 0.393 | <.001 |
| Cramer's V | 0.278 | <.001 | ||
| N of valid cases | 1232 | |||
| Note: c. No statistics are computed because Head Shape and Ethnic G are constants. | ||||
Table 4. Values of Phi and Cramer's V for head shape among both sexes by ethnic group.
According to the findings of the statistical analysis, both categorical variables are dependent on each other. In other words, a significant association exists between the independent categorical variable, head shape, and the dependent categorical one, the ethnic group. But when the strength of this relationship between head shape and ethnic group was examined, the values of Phi and Cramer’s show a clearly weak relation.
As shown in Figures 1 and 2, while the most frequent head shape among (Jo.) females and males is brachycephaly. In addition, the most common head shape among (Ch.) and (Ci.) males and females is hyperbrachycephaly.
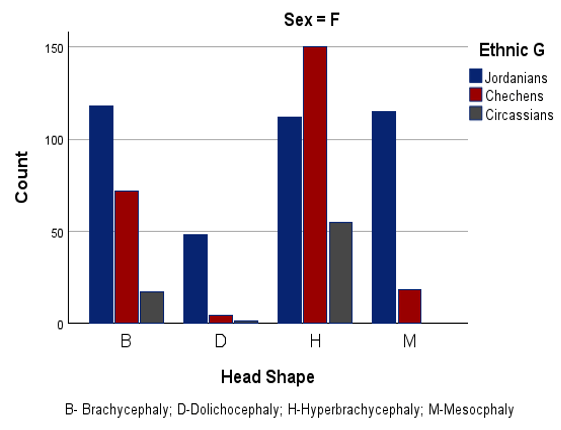
Figure 1. Number of females with each head shape by ethnic group.
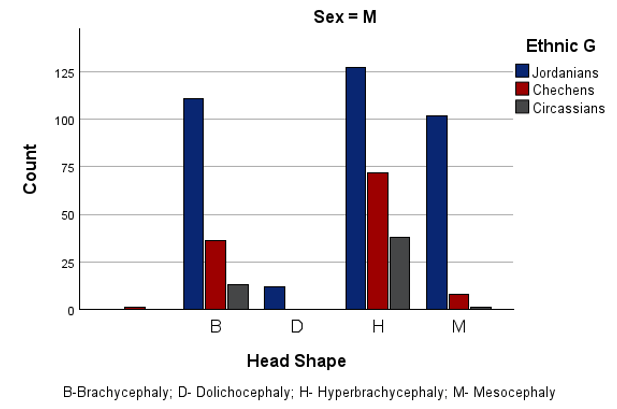
Figure 2. umber of males with each head shape by ethnic group.
Genetic traits: Nature vs. nurture
Head shape, as a qualitative genetic trait, is influenced by genetic materials on many loci and environmental factors. The impact of each is a controversial debated issue that is intensively discussed. Ecological and environmental factors, which greatly influence the phenotype of complex genetic traits, include nutrition, health care and social services quality, diseases, socio-economic status, and climate, etc.).
The purpose of intensive previous research was to investigate the profound influence of interaction between Environment and Gene (E by G) on the phenotypic characteristics of some genetic traits. The second group aimed to assess the influence of external environmental factors on gene expression and their capability to activate or inactivate (a) gene(s) that contribute(s) to the phenotypic features of a trait [8].
Phenotypic plasticity means the ability of living organisms to respond to the influence of environmental factors and the capability to display a degree of phenotypic variability of some genetic traits [9].
As a complex genetic trait, head shape among humans, is determined by genetic makeup and extrinsic factors. He was the first to conclude that head shape is a plastic genetic trait, based on his study conducted on European- born parents and their US born children [10]. He pointed to the great impact of change in European and American physical and social environment on head shape and variability among parents and their offspring. As an example, despite the importance of external environment, it is extremely critical to avoid neglecting the whole role of genetic mechanisms when researchers aim to understand the effects of softer diet associated with the transition to agriculture on skull shape, form, and size [11]. Furthermore, findings of new research emphasize on the genetic makeup influence on head shape. Directed by Weinberg, a research team efforts led to the identification of 30 genes that may responsible on shaping the head. The researchers are considered the first to discover 29 genes out 30 [12,13].
As mentioned above, the effects of several environmental variables on head shape are mostly discussed. A study aimed to assess the effect of climate on cranial variation among 361 crania. One of its findings is that most of cranial shape variation can be explained in terms of diet and altitude, and a low degree of variability is caused by annual temperature [14].
For interpreting results of our study, we have to mention that Jordanians, Chechens, Circassians, and their grandparents were born and living under the same socio-economic conditions in Jordan. This information makes us believe that most of variability in head shape of the three groups is due to environmental factors [15-17]. The genetic materials as a determinant of the variability is much lesser than the influential role of environment. Since the impact of external factors on head shape is almost similar, the difference in head shape in minimized across the three groups. In spite of a significant association between head shape and ethnic group as shown by Chisquare finding, the very little variability in head shape makes it extremely difficult to rely confidently on head shape to estimate ethnic group since the association between head shape and ethnic group is described as weak.
We concluded that living under almost similar living conditions may have equal influence on complex genetic traits. The impact of genetic materials, which cannot be ignored totally, is lesser than of environment. Furthermore, environmental factors are able to reduce genes capabilities to shape the head or inactivate them totally.
[Crossref] [Google Scholar] [PubMed]
[Crossref] [Google Scholar] [PubMed]
[Crossref] [Google Scholar] [PubMed]
[Crossref] [Google Scholar] [PubMed]
[Crossref] [Google Scholar] [PubMed]
[Crossref] [Google Scholar] [PubMed]
[Crossref] [Google Scholar] [PubMed]
Journal of Forensic Research received 2328 citations as per Google Scholar report