Research Article - (2021) Volume 12, Issue 4
Received: 27-May-2021
Published:
17-Jun-2021
, DOI: 10.37421/2151-6219.2021.12.364
Citation: Zeweld, Woldegebrial, Hidgot, Assefa and Gebregiorgis,
Gebrecherkos. “Impacts of Extension Services and Social Capital Influence on
Conservation Agriculture Adoption and Household Food Security Improvements” Bus Econ J 12(2021):363.
Copyright: © 2021 Zeweld W, et al. This is an open-access article distributed
under the terms of the Creative Commons Attribution License, which permits
unrestricted use, distribution, and reproduction in any medium, provided the
original author and source are credited.
There are limited empirical studies that explore how agricultural extension services and local institutions influence conservation agriculture adoption and household food security. Hence, this paper aims to investigate the potential impacts of extension services and local institutions (social capital) on conservation agriculture and food security. A cross-sectional data is collected from 350 randomly selected farmers in northern Ethiopia. The propensity matching method and endogenous switching regression are used to control for selection bias from observed and unobserved factors. Results indicate that extension services and social capital have significant and positive effects on adopting conservation agriculture and improving household food security. Farmers under the treated groups have higher per capita food consumption, per capita expenditure and food security levels than counterpart farmers. Besides, the rate of adoption of conservation agriculture for the treated farmers is relatively higher than for other farmers. This confirms that extension services, formal institutions and informal groups have motivated farmers to adopt conservation agriculture and replenish risks of food insecurity shocks. Therefore, governments, researchers, academicians, NGOs, development practitioners and others actors should exert utmost efforts and investments to empower local institutions and strength agricultural extension services, which are viable options to stimulate farmers to adopt sustainable agriculture in drought-prone areas of the country.
Extension services • Relational capital • Group membership • Agriculture • Food security
In Sub-Saharan Africa (SSA), food insecurity has been a frequent challenge. Nearly 0.8 billion people are undernourished worldwide. Of this, about 98% are living in low-income countries. Nearly 30% are in Africa, of which, 53% are living in East Africa. Since Ethiopia is a parcel of East Africa, about 25% of its population is living below the national poverty line. Food insecurity has often occurred due to a high dependence on unpredictable and unreliable natural factors, limited resilient capacity to risks of hazards, drought and shocks, unbalanced distribution and endowment of natural resources, and limited access to financial and market services. Besides, population pressure, the occurrence of pests/diseases and limited landholding size are other factors. Other authors also linked food insecurity problem with a lack of good governance, land tenure security and democracy [1-12].
To ensure food security and protect the livelihood of the poor, improving the adaptive capacity of agriculture to drought, diseases and pests, and climate change is imperative [13-16].
Investments in agriculture can enhance food security, overcome poverty and spur economic growth. Accordingly, agricultural growth is a good pathway to break food insecurity trap. In turn, disseminating yield increasing technologies like drought/disease-tolerant varieties, chemical fertilizers, pesticides, and herbicides is one way to achieve agricultural growth. For example, in some Asia and Latin America countries, these inputs were found to enhance agricultural productivity, reduce the adverse effects of weeds and diseases, ensure food security and accelerate economic growth and able many people to move out of poverty [17-20].
Since these external inputs are unaffordable for smallholders and inaccessible to those who live in marginal and remote areas, use of sustainable agricultural practices, such as soil and water conservation measures, use of organic fertilizers, plantation of multipurpose trees, and management of grazing and communal areas is identified as a suitable and feasible option that fits smallholder farmers. These farming practices have often used locally available resources and are based on farmers’ knowledge and skills. They have the potential to improve agricultural productivity, save financial resources that would have been used to purchase these intensified or external inputs and to reduce environmental problems such as erosion, degradation and CO2 emission [21-25].
However, the adoption of these farming practices remains low in many low-income countries because of supply-sides (e.g., lack of information and market inefficiencies) and other constraints. Since market in SSA is usually imperfect and many institutions are often missing, cooperative societies, extension services, farmers’ organizations, and other local institutions are found to replace these missing institutions. Investments in extension systems and local institutions have often played crucial roles in improving agricultural productivity and sharing loss from unforeseen events. Provision of information and improvement of farmers’ bargaining power was found to solve market inefficiency. Besides, local institutions were found to educate farmers about suitable farming practices, and to increase net returns and household welfare [26-32].
In Ethiopia context, the government has set agriculture-based development programs to facilitate agricultural growth, lift people out of food insecurity and bring overall economic development. Following this, many cooperative societies have been flourished to solve input and output market inefficiency. Besides, demonstration and training based agricultural extension system has been introduced. In doing so, Farmers’ Training Centre (FTC) has established at village level to provide technical support and information regarding technology application and climatic conditions. Furthermore, many Agricultural Technical Vocational Education and Training (ATVET) centers have opened in the country to improve the knowledge and skills of extension agents and upgrade their educational levels. Consequently, agricultural extension services and local institutions are important areas of research in Ethiopia, especially their roles in enhancing awareness and facilitating coordination and communication, which are normally difficult in SSA [33,34].
Having these backdrops in mind, how extension services and local institutions (social capital) influence the adoption of conservation agriculture are less researched empirically. Whether these have impacts on household food security also remain in Ethiopia under investigation. Therefore, this paper aims to assess food security levels between adopters and non-adopters of conservation agriculture. Impact of extension services and local institutions on conservation agriculture adoption and food security is also investigated. In this study, extension services and social capital are hypothesized as no effect conservation agriculture and household food security.
This study is one of the few empirical studies that assess the impact of social capital and extension services on conservation agriculture adoption and household food security. So, the paper is expected to have a knowledge contribution to contemporary literature by providing micro-level empirical evidence on the impact of extension services and social capital. Many countries have been deployed considerable human resources and invested more financial resources in public extension services to transform subsistence agriculture into market-oriented production systems. Consequently, the result of the paper is expected to have policy lessons in providing information on whether investing in extension services and local institutions worthwhile in motivating farmers to adopt conservation agriculture thereby improving food security.
Conceptual framework and model estimation
Theoretical framework of technology adoption: In literature, impact evaluation is often modelled based on the expected utility maximization framework. Farmers can use technology or treatment, for example, access to extension services and actively participate in local institutions to maximize their expected utility from it (Ui). They decide to choose it if the utility from adopting the technology ‘j’ exceeds from not adopting it ‘k’, viz., (Uij(X)>Uik(X), implying ATT=Uij(X)-Uik(X), where ATT=average treatment effect and k≠j). The net (true) impact of receiving treatment on outcome variables is given as follows:

Where W1 and W0 are the outcomes for treated and untreated farmers and T is a treatment. E (W0/T=1) refers to the outcome of treated farmers had they not been treated once they treated. But it is missing. It is difficult to get information on the counterfactual situations in a non-experimental and crosssectional survey. Farmers may not be randomly assigned to treatment, rather based on prior information, preference and others, such as innate managerial and technical abilities in using the technology. A failure to account for this may generate selection bias leading to over-/under-state the true impact of the treatment [35,36].
Measuring incidence, depth and severity of household food insecurity: Food security is defined as ‘a situation that exists when all people, at all times, have physical, social and economic access to sufficient, safe and nutritious food that meets their dietary needs and food preferences for an active and healthy life’. Variation of food security results from a difference in demographic characteristics, availability of physical resources and institutional factors, and technology uptake, extension services and formal and informal institutions. In this study, household food insecurity access scale (HFIAS) is used to assess the food insecurity situations in the areas [1,2,8,27,32]. Besides, the incidence and severity of food insecurity are assessed by the Foster-Greer-Thorbecke (FGT) as follows:
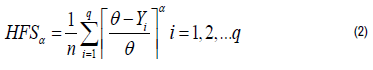
Where ‘HFS’ is household food security, 'n' is the number of sample size, 'q' is food insecure people (poor), 'θ' is a threshold level or food insecurity line that serves as a cut-off point between food secure and food insecure, 'Yj' is indicators of food security used, and 'α' is sensitivity parameter or policymaker degree of aversion to inequality among the poor. Three food insecurity indices are identified, first, headcount index (α=0) shows the incidence/extent of food insecurity to reflect the share of farmers below the threshold level. This is easy to understand and communicate although it fails to capture the intensity to which individual outcome falls below the food insecurity line. Second, food insecurity gap (α=1) indicates the depth/intensity of food insecurity to providing information regarding how far farmers are from the food insecurity line. This does not capture a difference in the severity of food insecurity among the poor. Also, it does not capture the transfer of resource among the poor, for example, if the resource is transferred from the poor to the least poor, the food insecurity gap remains unaffected. Squared food insecurity gap (=2) shows the severity of food insecurity by giving more weight to the poorest of the poor even if it is not easy to interpret. These three indices reflect availability, stability, accessibility and utilization of food [23,37,38].
Counterfactual analysis and conditional expectation in impact evaluation: In the absence of random assignment for treatment, different evaluation approaches (e.g. two-stage Heckman model, semi-parametric matching method, inverse probability weighted adjusted regression and endogenous switching regression) can be used to evaluate the aftermath of policy reforms. These can be corrected selection bias resulting from observable and unobservable factors and estimate the true impact of the treatment. In the propensity score matching (PSM), selection bias from observed factors can be eliminated by comparing the expected outcomes between treated and untreated groups following two steps (a) calculate the propensity score of treatment for each observation (b) estimate average treatment effect for the treated (ATTT) and untreated (ATTU) by matching each treated to untreated (counterfactual) with a similar propensity score. Once farmers are matched no systematic differences in unobservable factors between treated and untreated farmers is assumed. PSM does not require distributional and linear functional assumptions. However, it does not capture hidden bias. It is highly dependent on overlapping and unconfoundedness assumptions. Therefore, PSM may not yield efficient and unbiased estimates if there is misspecification in the propensity score model [7,12,39,40].
Endogenous switching regression (ESR) is applied to address PSM limitations. ESR explicitly captures unobserved bias by estimating the selection and outcome equations simultaneously using the full information maximum likelihood. ESR follows two stages: treatment is modelled using a multinomial/binary model (selection equation), and OLS selectivity correction model (continuous/categorical) is used to estimate the impact of treatment on outcomes [32,35,36]. The outcome that is derived from the treatment is given in two regimes (1 and 2) as follows:
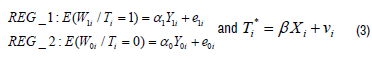
Where is an unobserved latent variable defining for treatment, is its observed factors, is the vector of covariates affecting treatment, and is the outcome indicators of treated and untreated farmers, is a vector of exogenous variables that affect the outcome and is the error term of the outcome equations. The error terms in the selection (vi) and outcome equations (ei) are assumed to have a trivariate normal distribution with mean zero and a covariance matrix of:
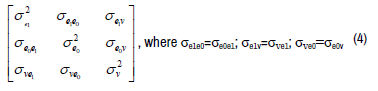
Where  are estimable scale factor and assumed to be
unity while cov (e1,e0) is not defined because Wi and W0 cannot be observed
simultaneously. The correlation between the error terms of the selection and
outcome equations is assumed not zero cov (e1,v) ≠ 0and cov (e0,v) ≠ 0. This
suggests the presence of selection bias. The expected values of the error
terms of the outcome equations are non-zero and given as follows:
are estimable scale factor and assumed to be
unity while cov (e1,e0) is not defined because Wi and W0 cannot be observed
simultaneously. The correlation between the error terms of the selection and
outcome equations is assumed not zero cov (e1,v) ≠ 0and cov (e0,v) ≠ 0. This
suggests the presence of selection bias. The expected values of the error
terms of the outcome equations are non-zero and given as follows:
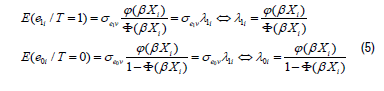
Where Φ(.) and Φ(.) show the standard normal density and standard normal cumulative functions. The switching approach addresses this selection bias by estimating the Inverse Mills Ratios (λ1i and λ0i) and the covariance terms (σe1v and σe0v) as stated in eq.5. These are included in the outcome equation as auxiliary terms (eq. 6). If σe1v and σe0v are statistically significant, treatment decision and the outcome are correlated. ESR is appropriate. The null hypothesis (absence of selection bias from observable factors) is rejected.
In the second stage of ESR, two basic questions are addressed, namely, how would the outcomes have affected had the treated farmers had not received treatment? What would have happened the outcomes of untreated farmers if they had received treatment? The conditional expectations for outcomes of the treated farmers with counterfactual hypothetical (untreated farmers) are computed and estimated as follows:
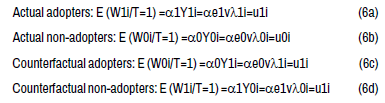
Eq.6a and eq.6b denote the actual expectation observed in the sample, and eq.6c and eq.6d are the counterfactual expected outcomes. The average treatment effect on the treated (ATTT) is the difference between eq.6a and eq.6c and given as:

The effect of treatment on the untreated farmers (ATTU) is calculated as a difference between eq.6b and eq.6d and is given as follows.

As stated by Carter and Milon, the effect of base heterogeneity effect for the group farmers that decided to receive treatment is defined as a difference between eq.6a and eq.6d and given as follows: [41].

The effect of base heterogeneity on the group farmers who decided not to adopt is defined as the difference between eq.6b and eq.6c and given by:

The transitional heterogeneity effect is computed as a difference between eq.7 and eq.8 (ATT-ATU), indicating if the effect of receiving treatment is larger or smaller for farmers that treated or untreated in the counterfactual case that they did adopt (see Annexe A).
Sampling framework and survey design
This study was conducted in Atsibwemberta district, northern Ethiopia, where its elevation ranges from 1003 to 3069 meters above sea level with a mean annual temperature of 18ºC and 400 mm for annual rainfall. Farmers often grow wheat, barley, maize, lentils, chickpeas, peas, and beans for home consumption and, very recently, for marketing due to an expansion of agro-industries in the country. Livestock, especially small ruminants and apiculture are also reared. The area is one of the drought-affected areas in the country. Since the area is predominantly characterized by hillsides, it is highly susceptible to soil erosion and land degradation. Various soil and water conservation measures and alternative water harvesting schemes have implemented for years to reduce degradation and enhance productivity [10].
In the district, there are 18 administration villages. These villages are categorized into two groups based on agroecology: these villages located in the temperate zone (16 villages) and the warm temperate zone (two villages). Felege Weyni, Habes, Hayelom, Michael Emba and Ruba Feleg from the temperate zone and Eira from the warm temperate zone were randomly selected. During the survey, these villages had about 9230 household heads and the required sample size (n=350 farmers) was determined following the Yamane sample size determination formula. After the sample size was proportionately allocated to each selected village, the respondents were selected from the sampling frame of each village using a systematic random sampling method.
A survey was carried out to assess the adoption of conservation agriculture and overall food security status. A draft questionnaire was prepared, which was evaluated by extension agents, and pretested by ten randomly selected farmers to ensure its validity and language. After improving the quality of the questions based on these prior assessments, a face-to-face interview was conducted by experienced and trained enumerators under constant supervision from the research team. The questionnaire covered a wide range of variables: demographic variables, rural facilities, farm characteristics, socioeconomic variables, institutional factors, food security indicators, and improved farming practices. The data regarding food and non-food consumptions were collected for the preceding year covering 12 months using a carefully calibrated frequency of buying that varied across purchased food items and the amount spent during each period.
Different procedures are used to address the research objectives. Initially, K-means clustering analysis is used to classify farmers based on their access to extension services, and local institutions. Farmers in the same clusters are more similar in the objects to each other than in other clusters. Household food insecurity access scale (HFIAS), which is easy and less costly to implement than other food security approaches, for example, supply and demand approach, anthropometric method, household coping strategies and dietary diversity index, is used to assess farmers’ food security situations in the areas. The equality of mean approach (chi-square test for categorical variables and sample t-test for continuous variables) is applied to compare food security status between conservation agriculture adopters and non-adopters. Besides, the incidence, depth, and severity of food insecurity are computed and estimated using the Foster-Greer-Thorbecke approach. Propensity score matching and endogenous switching regression are used to evaluate and estimate the true impact of treatment variables (social capital and extension services) on outcome variables (conservation agriculture and food security) [42].
Measuring target variables and validating their qualities
In this paper, membership in local institutions and access to agricultural extension services are target variables. These are latent (unobserved) constructed from observed variables in the dataset. Twenty observed variables are included in the questionnaire, which is responded by a five-point Likert scale (‘none’, ‘rare’, ‘sometimes’, ‘usually’ and ‘very often’ or ‘none’, ‘slightly’, ‘somewhat’, ‘high’ and ‘very high’) to measure these latent variables. A Bartlett principal component analysis with oblique target rotation is applied to construct these latent variables from these observed variables. Eleven observed variables are loaded into three latent variables, considering one and above Eigenvalue. Five variables that capture the level of informal learning, relationships, bonds, and communication from various community groups who are important for farmers, such as friends, neighbours, relatives, and informal groups are loaded into a factor named as ‘relational capital’.
Three statements that showing the influence of formal organizations, such as farmers’ associations, saving and credit associations, resource user groups and cooperatives are loaded into a factor known as ‘group membership’. A factor of ‘extension service’ is derived from three variables that explain the level of frequency that farmers have contacted with agricultural extension agents and confidence in their knowledge and skills (see Annexe B).
These 11 observed variables that are loaded into these three latent variables explained 75% of the available variance in the original 20 variables. Relational capital accounts for 31% of the total variance while 19% for group membership. The Kaiser-Meyer-Olkin is 71% with Bartlett’s test of Sphericity (P(χ2)=0.000). Factor loading, Cronbach alpha, and variance extracted are used to check the reliability and convergent validity of these observed variables that correspond to each latent variable. The coefficients of average factor loadings and variance extracted exceeded the minimum value. The coefficients of Cronbach alpha (α) for these latent variables were above 0.7. The normality assumption was checked by Skewness and did not deviate from the univariate normality assumption. The Doornick-Hansen test for multivariate normality (Chi-square=1.536 and P P(2)=0.128) did not lead to a rejection of the null hypothesis of the normality assumption. Multicollinearity was also tested by 2-tailed Pearson moment correlation and contingency coefficients and found statistically uncorrelated. Therefore, statements that correspond to the derived latent variable have common parts. They are reliable and valid to explain these latent variables.
Socioeconomic characteristics of respondents
Food security approximated by per-capita food consumption, per capita expenditure and self-reported household food insecurity scale (HFIAS), and conservation agriculture adoption captured by the use of crop rotation with legumes and intercropping farming systems are outcome variables of this study. Annexe C presents the summary statistics of the outcome and explanatory variables. During the survey, nearly 64% of farmers had adopted conservation agriculture to enhance productivity and yields, and termed them as ‘adopters or treated’ and the remaining did not adopt and named as ‘non-adopters or control’. Non-hierarchical (k-means) cluster analysis is used to classify farmers based on their similarities in accessing to extension services, and participation in informal and formal institutions [43]. For example, nearly 60% of farmers (n=210) had frequent contacts with extension agents (‘high access’) while the remaining had either rare or sometimes access to extension agent (‘low access’). Around 64% of farmers (n=224) had noticed a substantial influence of formal organizations on their decisions and behaviours and therefore had active participation in these organizations (‘active member’) while the remaining had either passive or no participation and they did not understand their importance (‘passive member’). About 69% of farmers (n=242) had high and strong interpersonal relationships, and communication with local community groups, such as families, fellow friends, relatives, neighbours, and endogenous groups (‘strong bond’), while the remaining had weak interpersonal relationships and communication among informal groups (‘weak bond’). of the total respondents, about 82% were living in villages that are found in the temperate zone. Around 58% were male-headed households. The average household size was about 5 persons with a mean age of 48 years. About 46% were literate with mean schooling of 2.2 years. The average landholding size was 0.56 hectare and 2.4TLU for livestock asset. About 12% owned a television or radio for information purpose. Around 45% were situated within a radius of 80 minutes walking distance from input-output market, and about 47% were located 6 km away from nearby farmers’ training centres (farmer-school). About 63% had access to all-weather roads within a mean distance of 6 km. Nearly 67% had primarily engaged in agriculture for their livelihoods and about 47% had additional income from small business, selling of firewood and charcoal, and causal works (nonfarm income). Moreover, farmers were requested to express their attitudes towards risks (natural hazards, human risks, technology risks, market volatility, and financial shocks) using a five-point Likert scale (‘very unlikely to take risks’, ‘unlikely to take risks’, ‘not sure about’, ‘prepared to take risks’ and ‘highly prepared to take risks’). Nearly 32% of farmers were unwilling and very unwilling to take any risk and renamed as risk-aversion and the remaining are either willing and very willing to take risks (risk-seeking) or undecided whether to take or evade risks (risk-neutral). About 56% had often suffered from drought, diseases, pests and other shocks that adversely affect their crops, livestock, and people and this is named as ‘stress’. About 45% of farmers had received credit from banks and the remaining either did not need any credit or no access to credit services.
Equality of means (chi-square test for categorical variables and sample t-test for continuous variables) is used to understand a statistical difference across variables. The mean differences for per capita expenditure, per capita food consumption, food security levels and conservation adoption are statistically higher for farmers who have frequent access to extension services, who have strong social ties and networks with local communities, and who are active participants in formal organizations than other farmers. Active members are found relatively to be better educated, have good access to all-weather rural roads, have more livestock assets and have better access to financial credits. Farmers who have frequent contact with extension agents (high access) are more of male-headed households, can read and write, and are located near to input-output market and all-weather rural roads than the counterpart farmers. Male-headed households, farmers who have more livestock assets and large landholdings, and farmers who are located close to the input-output market have strong relationships and networks with local community groups. These can either enhance farmers’ awareness or create opportunities to engage in non-agricultural activities. But these results cannot be used to conclude and make valid inference unless confounding or unobserved and observed factors are controlled well.
This paper examines the potential impacts of extension services and local institutions on adopting conservation agriculture and improving household food security using PSM and ESR. The major factors that influence farmers’ access to agricultural extension services and local institutions include demographic characteristics, farm conditions and rural services. The treated farmers have systematically different characteristics compared to untreated farmers, for example, in education, which is a source of variation between treated and untreated groups. According to PSM, conservation agriculture and household food security are significantly higher for treated farmers than untreated farmers. Even after controlling for all confounding factors using ESR, farmers who have frequent access to extension services and those who have active participation in the local institutions have a higher adoption rate of conservation agriculture, and higher probability to be food secure than counterfactual farmers. If treated farmers had not received treatments, they would have been lower probability to be food secure and lower rate of adopting conservation agriculture. This confirms the potential roles of receiving treatments in motivating farmers to adopt conservation agriculture and improving food security. Consequently, conservation adopters are in a better position in terms of conservation agriculture and food security than for non-adopters.
It is known that agriculture is a prime sector in Ethiopia. About 80% of its population (0.11 billion) are living in rural areas. Nearly 90% of these rural people are poor and smallholders and thereof do have less access to agricultural extension services. Many farmers are also passive participants in local institutions. Beside several institutions like local markets are often imperfect and many institutions, such as input markets and information centres are either absent or missing. Hence, the results of this study have important implications because extension services and local institutions have positive spill over effects in enhancing awareness, relaxing financial constraints, supplying inputs, and motivating farmers to adopt conservation agriculture. Therefore, government, NGOs, researchers and development practitioners should formulate specific strategies, for example, agricultural extension services should be leveraged and promoted. Extension agents should be capacitated technically. Social and physical infrastructure should be expanded especially in rural areas. Capacity building and information centres should be established in rural areas. Local institutions should be empowered and supported technically, financially and materially to exploit their potentials and opportunities to promote the adoption of conservation agriculture and improve household food security in the drought-prone and water-deficient areas.
Even if these results are still useful and valid for the selected villages and also other areas with similar farming practices and socio-cultural conditions, the study is subject to some limitations. For example, since the data recording system is weak, perception data for total expenditure, food consumption and self-reported food security level might suffer from recall errors and therefore the results might mislead when compared to the actual recorded data. Besides, the results are unlikely to automatically extrapolate to the entire country because the results are needed reassessment and readjustment. Moreover, the impacts of the treatments (extension services and local institutions) would have been nearly true or perfect if a longitudinal data was used than crosssectional data. Therefore, further investigation is suggested using a large sample size and panel data from a wider geographical coverage. This would help policymakers, NGOs, researchers, academicians and development practitioners to get real and useful information on how agricultural extension services and local institutions promote sustainable agriculture and improve household food security.
Business and Economics Journal received 6451 citations as per Google Scholar report


