Research Article - (2026) Volume 17, Issue 1
Received: 22-Oct-2024, Manuscript No. BEJ-24-150735;
Editor assigned: 25-Oct-2024, Pre QC No. BEJ-24-150735 (PQ);
Reviewed: 10-Nov-2024, QC No. BEJ-24-150735;
Revised: 13-Feb-2026, Manuscript No. BEJ-24-150735 (R);
Published:
20-Feb-2026
, DOI: 10.37421/2151-6219.2025.16.553
Citation: Khan, Raja Ased Azad. "Forecasting Pakistan Stock Market (PSX) Signals through Technical Analysis Using Artificial Neural Network." Bus Econ J 17 (2026): 546.
Copyright: © 2026 Khan RAA. This is an open-access article distributed under the terms of the creative commons attribution license which permits unrestricted
use, distribution and reproduction in any medium, provided the original author and source are credited.
Technical analysis is a good approach to observing price activity in a free market and is often used to forecast future price patterns. This research aims to forecasting Pakistan stock market signals through technical analysis using artificial neural networks. We used TTR predictors for technical analysis in the artificial neural network model to predict the Pakistan Stock Exchange (PSX). This study concludes that previous information is helpful in future forecasting, and future prices linked with the previous history. This survey also assists investors in understanding how to use these technical analyses on artificial neural networks to increase their proportion of winning trades and enhance their return on investment.
Technical analysis • Artificial neural networks • Future price patterns, Pakistan Stock Exchange (PSX) • Future forecasting • Return on investment • Forecasting • Pakistan stock market
Stock market is always considered a fundamental economic barometer of a country. According to the Efficient Market Hypothesis (EMH), current market prices of listed stocks reflect all available historical information such that investors should not be able to outperform on the market (buy-and-hold return) consistently by trading on past information [1]. The country's stock market and economic growth have a strong positive relationship [2]. The stock market growth shows efficient channelization of funds in the economy regarding investments and savings. In the stock market, financial instruments and stocks are bought or sold. The essential purpose of any financial asset and security is its return; in this situation, for investors and researchers, anticipating the stock market is critical. In recent years, political stability and better law and order situation show Pakistan's stabilization. Our KSE-100 index growth was 15% in 2016, which Bloomberg reports; this report also declares the Pakistan economy as the best Asian economy. Pakistan stock market is considered the best world best performing stock market due to the 26%annual return.
KSE-100 index started in November 1991 and was replaced by the KSE-50 index; the base value of the KSE-100 index is 1000 points. It consists of hundred (100) companies of different 35 sectors. These companies in 35 sectors represent 85% of the market. Companies are selected as the top capitalization companies of each sector, and the remaining companies are chosen based on market capitalization from any sector. In 2016 all three stocks of Pakistan (Islamabad Stock Exchange, Karachi Stock Exchange and Lahore Stock exchange) were merged and became Pakistan Stock Exchange (PSX) limited under the act of stock exchange 2012.
The market index is the primary indicator of that stock market which is measured daily; it shows the market trend and the performance of the stocks of different sectors. Investors are so sensitive to investing in stocks that if they know the market's direction, they better guided and securely invested in the market. The profit and loss of the investors are directly related to the prediction of the market and market trends. The Pakistan stock market is not a developed market, and efficient analysis is impossible here.
Technical analysis in which past prices of stocks have been analyzed for the prediction of future prices. It also studied investor behavior and its impact on future prices of stocks. The essential data which is used in technical analysis is previous data of the stock prices. Based on the last data and previous trends on underlying stock, we will predict that stock's future prices or trends. In developing, economies, where the markets are inefficient technical analysis, is better for prediction. The technical analysis approach is also known as the chartist approach; in this topic, we only focused on a detailed investigation of Pakistan Stock Market using different indicators.
Due to technological advancements, the use of neural network in financial markets is increasing daily. Neural network theory came out from artificial Intelligence research. An artificial neural network is an information system produced by biological nervous systems, such as the human brain. It is composed of a large number of interconnected units, which are called neurons.
The filter rule is well known for testing the efficiency of stock markets such as Qatar stock exchange [3], European markets [4], Taiwan stock exchange [5], Nigerian stock market [6], Arab stocks [7], and Australian share market [8]. There are few studies examining the performance of technical trading rules in Turkish stock markets with the help of filter rules [9]. Many banks are using ANN models for forecasting macroeconomic indicators, such as National Bank CZECH [10], Bank of Canada [11], Jamaica Bank [12]. Forecasting through ANN is helpful, and one can easily decide on the stock selection in the stock market and property evaluation. Bond-rating and others [13].
Neural networks are mainly used for financial forecasting because they can efficiently deal with non-linear problems. ANNs consist of computing units, and each unit is linked with another. It also includes layers. Finally, the output layer takes the values from the last hidden layer and transforms them into the final result value [14]. The first layer is based on input, and observations are shown on that input layer. The last layer shows the output or prediction of the specific problem. There are more hidden lawyers between the first and last layers. Figure 1 of neural network shows that it consists of three lawyers input layer, a hidden layer, and an output layer, and every layer is connected.

Figure 1. Structure of a feedforward neural network showing input, hidden, and output layers with interconnected neurons.
In this topic, we will use technical indicators for technical analysis of the artificial neural network model to predict the stock market, showing the trend of the market KSE-100 index. The efficient market hypothesis describes how quickly markets adjust in terms of pricing. In this form of market, the perfect competition hypothesis applies; it isn't easy to earn profit and beat the market. The main purpose of our topic is to predict the market through technical analysis of ANN, which is helpful for investors in investment decision-making. When an investor knows about the direction and trends of the market, then it's easy for him in decisions making during investment.
In Pakistan, most investors rely on the base of instructions and brokers due to a lack of basic knowledge and information about the market. Mark T. Leung, in 2001 worked on the neural network for the emerging economy of Taiwan and concluded that it helped in the trading experiment to obtain profit higher than other strategies. Artificial neural network is a new and novel concept in Pakistan for investors and researchers because there is no practical implementation of this concept here. This study focuses on forecasting with a neural network application, which can forecast with small or large samples for investors and users without market intelligence and knowledge. This work makes a substantial contribution in this area. These averages are calculated based on the historical price of the stocks. There are some available filter rules such as buy when 200-day simple moving average is greater than stock price [15].
This study also has the theoretical significance of the concept of Stiglitz and Grossman that the idea of market efficiency does not exist in the market. There is a lack of information and knowledge among investors and participants. Profit maximization is possible through handling, monitoring, and controlling the risk that exists in the market.
Two basic types are used for stock market prediction or asset prices in the financial market. The first one is a fundamental analysis that is based on essential factors which exist in the market. This type of analysis focuses on the intrinsic value of the stock or security through industry, company, and economic analysis. For example, a company's growth in earnings is the fundamental parameter to check the value of the company stock. It was determined that optimized filter rules were insufficient to show higher performance than the buy-andhold strategy. To improve the performance of the optimal filter rule against the buy-and-hold strategy, the stock selection process is performed with artificial neural networks. Artificial neural networks are used to increase the performance of process in various fields [16]. The stock selection procedure with artificial neural networks is as follows. Almujamed examined the predictability of nine filter rule and tested the validity of the weak form of the efficient market hypothesis for the Qatar Stock Exchange (QSE) [17]. In addition, fundamental analysis judges the risks and interests. Statistical and mathematical algorithms are used on the company's financial statements to calculate the company's stock price [18]. Jabari Lotf, et al. determined the parameters of the genetic algorithm by testing different values. Long-term investors use fundamental analysis because they are not interested in short-term investment, so they ignore the short-term fluctuations. For many years, two fundamental financial theories random walk and the efficient market hypothesis [19], gave the basic concept of market efficiency. The theory says that stocks in the market reflect all available information and rapid change, and an investor can't attain profit in that efficient market. Econometric test results indicate that there is not enough evidence to support the weak form efficiency of Borsa Istanbul. Aliyev utilized 10 years’ weekly data to test the weak form efficiency of Borsa Istanbul [20]. A smooth transition autoregressive type linear model is used in the study. The author reports that Borsa Istanbul returns are predictable at the given period since the proposed model outperformed the random walk model. Hailu and Vural assessed the weak form efficiency of BIST100, BISTBANK indices as well as banks listed in the BIST30 index by applying various econometric models.
Stiglitz and Grossman argued theoretically against the efficient market theory. They argued that there is no concept of market efficiency, and it is not present, and in this situation, there is no opportunity for profit. After that, another approach came (relative market efficiency). The stock market is unpredictable and efficient, only based on available information which exists in the market, not complete information. Exploring the new information on the excess of profit is possible for investors and researchers. Another concept was given by Mackinally and Lo; according to them, earning excess profit is possible for investors and brokers systematically using technology and advanced methodology.
There are different models: ARMA model, support vector machine, and neural networks used in time series analysis. This method is commonly used when the sample size of data is large, little information about the factor is available, and the prediction objective is short-term. When the short-term prediction is the objective of study or aim of any investor, then the residual component is pivotal. Technical research is a methodology of forecasting that uses a graphical analytic tool. It relies on stock charts to check or analyze the market trend rather than measuring the intrinsic value of stocks or securities. According to technical analysis, the buying and selling strategies are formulated based on previous data or information (price, trends and volume) about that particular security or stock. It assumes that the investors follow the previous trend and decide their investment according to the earlier stock trends. Benecki and colleagues developed a model to detect anomalies in spacecraft telemetry using a genetic algorithm.
The stock market modern technical analysis presented by Dow theory. Stock market prediction predicts where the stock market goes shortly and what trend investors should follow in the future. Researchers are interested in predicting the stock market from existence and use different techniques such as fundamental, technical, and statistical indicators from the start, but they cannot beat the market. Forecasting methods are measured and analyze the stock market through classic methods for stock market prediction and argue that there is much difference in every approach due to precision, complexity, and restrictions. Every method is better in defined circumstances. For short-term forecasting, the ARIMA model is a helpful option. Olaniyi Mathew and Olayiwola Studied stock prices using ARIMA in Nigerian Breweries; they can use a time plot to show the results and concluded that the fitted ARIMA model is best for the original series. Worked on time series data in the U.S. stock market to predict the stock market on that particular day; they concluded that the Support Vector Machine (SVM) best predicts stock market momentum among all models.
Pakistan's stock market is not efficient, and there is a weak form of efficiency. Most of the investors rely on brokers due to a lack of knowledge about the stock market. Ashraf researched uncertainty in the stock market and a lack of efficiency in the form in the stock market of Pakistan; they concluded that previous information helps forecast the prices of stocks due to market efficiency. There is another study conducted by Kashif studied the forecast of oil and gas sector prices in the stock market of Pakistan; they used different models such as ARCH, ARIMA, ARMA, and GARCH; they concluded that AR (1) and ARMA are most suitable models to represent the prices of oil sector.
In Pakistan, Asghar studied the forecasting of stock prices of the banking sector in the stock market of Pakistan; they compared GARCH and ARMA in forecasting they concluded that MCB bank is the best, and in the second part, they developed statistical distribution and concluded that Gen.Pareto is best among distribution. Muzammil studied the relationship between stock market volatility and macroeconomic variable in the stock market of Pakistan. They used GARCH, ARCH, and EGARCH models to check the volatility of stocks. They concluded that macroeconomic variables such as inflation and real exchange are essential indicators in explaining the stock market.
Now modern techniques are a tool for forecasting stock market returns. Stock market artificial neural networks is now used as a modern technique to predict the stock market because time series data is non-stationary data, and ANN can collect valuable information from an extensive number of data; it also compounds the trend of the data from the start and then gave the results. Artificial neural network also helps investors through stock market signs Mark T. Leung worked on the emerging economy of the Taiwan stock market using artificial neural network to predict the signs of buy and sell, which helps the investors in decision making they concluded that ANN's benefits in the trading experiment to obtain profit higher than other strategies. ANN also helps set different thresholds rather than single.
Artificial neural network is best in data mining in a large sample of data. It extracts useful information from a large number of data. Magdalena Daniela NEMES studied data mining techniques in the stock market of Roman to predict the stock market trends and directions in the near future. They can use three traded stocks in that market for prediction purposes and concluded that the neural networks technique is a feasible technique to predict the Roman stock market.
In a comparison of artificial neural network with other models, we saw that the results show that it is better in prediction than other models. Alaa F. Sheta compared different models such as support vector mechanics and artificial neural networks to predict the USA stock market. They linked 27 different economic and financial variables which affect stock market returns. They concluded that a support vector machine is a better predictor in this situation as compared to artificial neural networks. A. Rao studied Statistical approaches and ANN approaches in the Indian stock market to predict the stock market of India they compared, both of the techniques and concluded that ANN approach is best to predict the stock market returns. Mehra studied stock market prediction using real-time data. They can conclude that ANN networks are better predictors if both types of data, such as numeric and textual data, give better results than all other models. Narendra Pahuja studied on Indian stock exchange to predict the stock market. They compared the ARIMA model with ANN and concluded that ANN is better than the ARIMA model.
Artificial neural network in Pakistan is rare, but investors and researchers now focus on them due to technological advancement. Zia studied stock market price prediction using an artificial neural network in the stock market of Pakistan; the study results show that ANN is best due to the ability to dig information from a large number of data. HANIF and Haider worked on forecasting inflation in Pakistan through Artificial Neural Network; they used twelve years of previous data to forecast through ANN and then compared the results with ARIMA and AR (1) models. They concluded that the artificial neural network model is best for prediction.
Data and methodology
We used daily KSE-100 index data from 07 July 1997 to 30 June 2017 in this study with the 5400 observations. Yahoo finance secondary data source is used. KSE-100 index data from 07 July 1997 to 30 June 2011 is used as an in the sample while daily returns of the index from 01 July 2011 to 30 June 2017 have been used for testing out of sample. The sample periods cover the whole volatile events, which are; Pakistan on 28 May 1998 going for a nuclear test in response of Indian nuclear tests, which result in our stock market decline by 13%, and that was the worst decline in our Stock market history, in 2005 stock market of Pakistan crushed and in July 2008 due to political instability, law and order situation and bad economic conditions KSE plummeted one third (Figure 2).

Figure 2. KSE-100 Index trend from July 1997 to June 2017 showing long-term growth with periodic fluctuations.
As shown below, Figure 3 of the KSE-100 index shows the straight from 1997 to 2002. The increasing trend is shown from 2002 to 2008. Due to the stock market crash in 2008, the index showed a significant dip 2008. That was when the stock market was closed for a few months. From 2008 to 2012 trend increased but was too slow, and from 2012 to 2016 stock market was at the peak level of history due to political instability, control of terrorism, better law and order situation in the country, and one more reason that massive investment of China in Pakistan (China Pakistan Economic Corridor) CPEC. In mid-2017, due to political instability in the country and Panama's decision against the prime minister of Pakistan stock market graph downward trend from 2016 and 2017, and once again, at the end of the 2107 stock market went upward.

Figure 3. KSE-100 Index daily return fluctuations from July 1997 to June 2017 showing high volatility over the period.
KSE-100 index daily returns continued compounded daily returns of index data were transformed. The equation used for this purpose is:
Returns=(Pi-Po)/Po
Where Pi stands for current closing Index and Po stands for previous closing index.
The volatility of index returns is shown in Figure 4 from July 1997 to December 2017. Maximum volatility of index returns during the 1997 to 2000 period. This period included the nuclear explosion in 1998. In this period, daily returns plummeted to a loss of over 13%. The graph clearly shows that daily returns variance decreased significantly in 2009. From 2009 to 2016, daily returns variance increased, and the KSE-100 index yielded annual returns of 26%. In 2016 Bloomsburg declared the Pakistan stock market as the best stock market in Asia, and it is ranked fifth (5th) position globally. From mid-2017, daily returns decreased to the lowest level in history.
We used the predictors of (TTR) for technical analysis in the Artificial Neural Network model to predict the stock market of Pakistan (PSX) KSE-100 index.

Figure 4. A simple flow diagram showing Input → Processing → Output.
Predictors/Variables
To forecast the Pakistani stock market, we employ the following technical indicators in an artificial neural network, which are discussed below one by one in detail.
Average True Range (ATR): J. Welles Wilder developed the ATR, a volatility indicator; when ATR increases, the volatility also increases and tends toward higher; when it decreases, the volatility also decreases and tends towards lower. So the average true range indicates the high/low volatility it can set the market's benchmark.
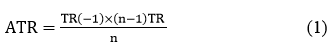
Where TR=True high–True low
Stochastic Momentum Index (SMI): SMI is a signal of movement developed by William Blau. It measures the closed difference in price and corresponds to the median array of performance prices. Values of SMI lie between +100 to -100 traders, and analysts use SMI to check the condition of the market, whether it is overbought or oversold. The stochastic momentum index also indicates the market trend, whether it is bullish or bearish; if the value is 40 or above, then there is a bullish trend in the market, and if it is less than -40, then there is a bearish trend in the market.
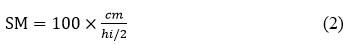
hi=Highest high–Lowest low, cm=close-(hi/2)
Welles Wilder's directional movement index (ADX): ADX, prepared by Welles Wilder, could not measure the actual direction; it only tells us the strength and weaknesses of the trend. ADX measures the upward and downward magnitude of prices from the true range.
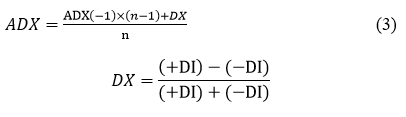
Where, +DI stands for plus directional indicator and –DI minus directional indicator.
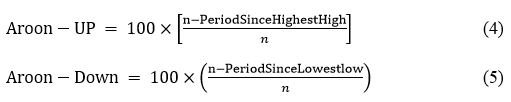
Aroon indicators (Aroon): Aroon, prepared by Tushar Chande tries to identify starting trends and consists of lines showing the highest and lowest index. The Aroon indicator consists of two lines, upward and downward; these two lines measure how much it is highest or lowest in a specific period range.
Bollinger Bands (BB): BB prepared by TradingGeek. It consists of three lines upper line band, lower line band, and middle line band. The top and bottom line areas represent F standard deviation two below and above the central band, respectively. On the other hand, the middle band is made out of a predicted response of the standard price.
Mid band=Simple moving average (T.P.)
Upper band=Mid band+Price × σ (T.P.)
Lower band=Mid band+Price ×σ (T.P.)
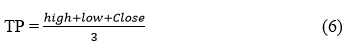
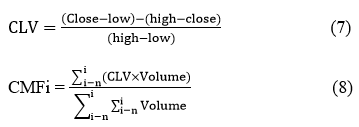
Chaikin Volatility (CV): Marc Chaikin's Chaikin volatility investigates the overall session volume in conjunction with the Closing Location Value (CLV). It measures the overall volume during the preceding periods (n) to the usable capacity points of time CLV (Closing Location Volume) (n). CLV can figure out whereby a real problem relative term concludes.
MACD oscillator: Gerald Appel creates MACD. MACD is a momentum indicator that indicates the new trend's strength and dynamics by indicating around the zero line in both dimensions. MACD is made up of three averages set to 9, 12, and 26 in their default parameters.

Signal line=9 day EMA of MACD line
Where, EMA=Exponential Moving Average
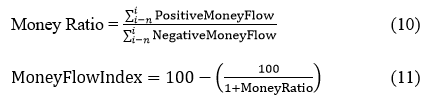
Money Flow Index (MFI): The money flow out of security ratio is calculated using MFI. Money flowing ratios are computed with MFI, ranging from zero (0) to Hundred (100). The above 80% indicates top while below 20% suggests bottoms.
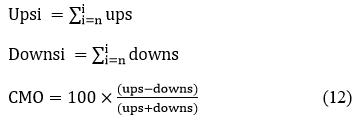
Chande Momentum Oscillator (CMO): CMO was developed by Tushar S. Chande. It indicates the signals of overbought and oversold conditions in the market. Value of CMO over 50 shows overbought conditions in the market while value -50 shows oversold market signals.
If Pi (current price)>Po (previous price) then
Up=Pi (current price)-Po (previous price) and Down=0 (zero)
If Pi (current price)<Po (previous Price)
Then, Up=Po (previous Price)-Pi (current price) and Down=0 (zero)
STDn=Standard deviation of n periods the closing price
C=Closing Price
Ci=Closing price for period i.
MAn=Moving average for n periods closing price
N=number of periods.
The parabolic SAR: SAR was developed by Wells Wilder, who was the creator of an indicator relative strength index. Traders and researchers use the parabolic SAR to determine the asset momentum direction and a specific point when momentum is higher than the normal probability of switching directions. It shows results in charts of the prices of assets above and below in dots.

xp is extreme point
af is acceleration factor
The above mention indicators are used in our study. TTR package consists of more than 36 different indicators, but we are discussing only ten of them here because only these ten indicators cross the benchmark of 15, which we set in the Pakistan stock market. These ten indicators can touch all the indicators such as volatility, momentum, money flow, etc.
Artificial neural networks
Artificial neural networks are a process of human brain inspiration that can learn through training and experience and store that information in memory for use later when required. ANNs can dig the meaning from complicated information and data. They have more advantages from other traditional linear models due to their nature of non-linearity. ANNs also can recognize the non-linear relationship between input and output variables. They also can change weights (parameters) when they deal with dynamic and stationary data. The special function, which is sigmoid, is used, transforming input variables into output.

W1ji and W2kj represent the weights in the first layer and the second layer, input going from i to hidden unit j, where M represents the hidden unit's number, d represents the number of output units, and W1j0 shows the bias of the hidden unit j. At the same time, W2k0 indicates the bias for the output unit k.
Findings market trends
In this topic, we used the ANN model for technical analysis to predict the stock market of Pakistan (PSX). In technical analysis, the charts are used to indicate the trends. Technical Analysis gave the results in the form of charts and graphs that show the market trend (Figure 5).

Figure 5. KSE-100 index candle chart.
In Figure 5, two graphs are shown above graph showing the basic information of the market in the form of a candle chart and the second graph showing the T value of the market; both of these graphs show the market trend. Now we discuss the above graph first and then the second graph.
The candle chart consists of candle boxes. These boxes are also known as trend boxes because they show the basic trend of the market. In Figure 6 there are orange, green, and empty boxes (colored and simple) are shown. The data was used from 01 October 2017 to 29 December 2017 (the last three months), and the following information is used from the data.
Date of the session
• The session's starting price
• The session's closing price
• The session's most expensive
• The session's cheapest pricing
Figure 6 shows two bullish and bearish candles; each candle shows the stock market's high, low, open and close values.

Figure 6. Candle boxes.
When close price of the stock<(less than) open price of the stock (Bearish candle) and
When close price of the stock>(greater than) open price of the stock (Bullish candle).
In Figure 5, the graph represents the daily quotes; dates and times are given on the graph's X-axis (horizontal). The vertical bar represents the stock market amplitude, including open and close amplitude. The orange box graph shows the Bearish trend of the market, which means that there is a downward trend and the green box (candle) shows the bullish trend in the market; the top and bottoms of the candles show how much prices are going down and up in the session. The candle line shows the day's average price, calculated through the average of the session's close, high and low prices.
The candle line shows the average prices of the session through which we easily conclude how much prices are going upward and downward in a session.
The second part of the graph in Figure 6 shows the T value, which indicates the signals of buying and selling the securities in the market. In any market, the essential transaction cost (broker commission or fee) is included in the prices of stocks and securities. It is a try of every investor to earn the maximum profit from the security. T values indicate that if investors want to sell or buy the security, they can attain the margin (including the transaction fee or broker fee). In the graph of figure 06, we make a ten (10) day session and set the margin (transaction cost or broker fee) as 2.5%; it is the maximum transaction in the stock market, so we include that here. The basic rule of the T value is as written below,

T values higher (positive) Buy Order
T values lower (Negative) Sell Securities
When T values are simultaneously higher than the threshold, the prices or trends are lower. It's time to order the purchase of securities in the market because prices are at a lower level, and when T values are at a lower level at that time, prices are at an extreme level, and it’s time to sell the securities. In graphs 12 October to 14, T values are higher than the margin, which shows the Buy signals, and from 27 November to 10 December, the prices are at a lower level, showing the Sell signals.
In our research question, is it possible to predict the stock market trends? Here, we answer that question. Yes, the stock market's developments can be predicted. In Figure 5, we predict the trends of the KSE-100 index through a candle chart (Bullish and Bearish boxes) and T values.
Technical indicators
We used the technical indicators to predict the stock market of Pakistan, and our fundamental question was which predictor is best in the KSE-100 index for forecasting the trends. Our basic purpose of data mining is to predict the behavior of the futures market based on previous experience and information. In the last graph, we used a single T indicator for prediction. We are using several indicators for forecasting the KSE-100 index and using these indicators in artificial neural networks through R.
Due to different indicators, our essential question is which indicator best predicts the KSE-100 index; we used a specific threshold and then compared the indicators according to our threshold. The threshold is set through the Mean Square Error (MSE).
Y stands original (value) and Y indicates the estimated
Mean Square Error (MSE) means that the difference between the actual results and estimated results sometimes the results are in positive values and sometimes in negative values both values have the same impact more or less than the original value, but we sum all these values the negative and positive signs cut off each other's and it is not possible to find out the average; so to remove the impact of signs we take the square root and then easily find out the average.
Our subsequent results of different indicators are in a graphic form known as random forests. It's used to calculate the relevance of variables in forecasting activities. Commonly, the variables' significance can be estimated by calculating the percentage increase in the error term of random forests if we remove every variable in turn. In a certain way, it resembles the basic idea of wrapper filters because it includes a modeling tool for selecting features. We will use another forecasting model to predict T, which means that the set of variables determined by this process is not optimized for other models. So we are going to use this method which is more like a filter method. This program is used to we can divide our data into two parts; the first part is used to construct the trading system of the given period, and the second part of the data is used for testing purposes. The results of the provided data are shown below in the graph and table.
Random forest KSE-100 index
The graph shows the results of indicators' importance in random forests. In the graph, the percentage MSE is plotted on the X-axis, and on the Y-axis, different indicators are plotted. Our threshold is 15 (fifteen), and the graph starts from 0 and ends at 25 with a gap of 5. In random forests, two strategies are utilized. The first is the percentage rise in the forest's error term when each variable is eliminated one by one. When each variable is eliminated, the mean square error of each tree out of the sample is calculated one by one. The increase is adjusted with standard error and averaged over all trees in the forest. The second approach is to reduce node impurity, responsible for each variable, by averaging all the trees. We followed the first way in this situation, and after collecting the findings, we can assess the significance of the indicators. The results of the graph in figure are given below in a table according to their ranking.
Results of random forests
The below Table 1 shows the graph results; according to the results, the indicators start from 5 and touch the maximum level of 25; one indicator SAR is at the maximum level and greater than 25. The second indicator, the Average Directional Movement Index (ADX), is at the second-highest level, and more than six indicators cross the threshold. The indicators that cross the threshold are effective, but the indicators below the range of 15 are not useable in the stock market of Pakistan (PSX). Our essential question was which indicator is best, so SAR is best among all other indicators for prediction in the stock market of Pakistan. This indicator SAR crosses the maximum level of 25, and we can say that it purely indicates the market trends. Other indicators equal to twenty or more than twenty range are also the best alternatives in forecasting the KSE-100 index. We only use the indicators above the threshold (15) in the next steps to clearly get the buy, sell, and hold signals of stocks and securities.
| Indicators ranking of figure | |
|
Name of indicators |
Less or greater |
|
SAR |
>25 |
|
ADX |
>20 |
|
MACD |
20 |
|
ATR |
20 |
|
AROON |
>15 but <20 |
|
SMI |
>15 but <20 |
|
VOL |
15 |
|
CLV |
>10 but <15 |
|
RSI |
>10 but <15 |
|
EMA |
>05 but <10 |
|
EMA |
>05 but <10 |
|
CHA |
<00 |
Table 1. Ranking of indicators.
KSE-100 index signals
In the previous two sections, we now predict the data with specific forecasting models; our goal is to predict the correct trading signals of the Pakistan stock market.
Sell if T < -0.1
Hold -0.1 ≤ T ≤ 0.1
Buy if T>0.1
The selection of values .1 and -0.1 is not a rule. We can use another threshold; in our case, these values mean that we use the average of 10 days and assume that there are four days out of ten when the closing price is more than 2.5% (4 × 2.5%=0.1). According to the high and low values of the market, we can change the threshold. The classification task is used here to use a target variable for the correct signal of the day or specific period. Data frames (Tdata. train and Tdata. evil) are used in R for training and evolution of periods. Our essential purpose is to find out the signals of sell and buy because hold signals have no importance; every investor wants to earn the maximum profit within a limited time period. Therefore, investors always focus on sell-and-buy signals rather than hold. Hold of security means no profit and loss, but it is better to hold the security rather than sell it in the loss. The following graph below shows the T values of the last five years, and we easily find the signals of buy, hold and sell from Figure 8.
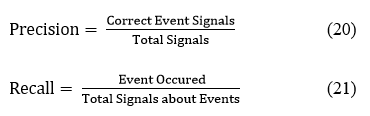
Figure 6 shows the graph of the KSE-100 index, and below that graph shows the T values of the KSE-100 index. These T values show the signals of Buy, Sell and Hold. Now we evaluate these signals through the Precision and recall approach. Precision means that the part (proportion) of the event (total session) signals are correct and how much percent signals are correct from the whole data or part; In contrast, recall means that part (proportion) of the event (total session) occurring in the time or domain which the model signals. Formulas of both precision and recall are given below.

Figure 8. KSE-100 index 06 years’ graph with t values.
Tables 2 and 3 of the precision and recall are given below to show the accuracy of the signals and how many signals are corrected.
| 05 days signals of KSE-100 index | ||
| Precision | Recall | |
| Sell | 0.2627451 | 0.4718310 |
| Buy | 0.3398693 | 0.3489933 |
| Hold | 0.2916667 | 0.4089347 |
Table 2. Precision and recall results.
|
10 days signals of KSE-100 index |
||
| Precision | Recall | |
| Sell | 0.4149660 | 0.4295775 |
| Buy | 0.3552632 | 0.7248322 |
| Hold | 0.1951220 | 0.3024055 |
Table 3. Precision and recall results.
According to the results shown in Tables 2 and 3, precision and recall about signals of sell, buy and hold, the Pakistan Stock Market (PSX) is predicted by the technical indicators through artificial neural networks is accurate and it is good forecasting. For example, in Table 2, our value of recall of sell is forty-seven (47) and buy thirty-four (34), which is good, while ten days’ prediction, the values of precision about sell and buy are forty-one (41) and thirty-five and recall values are too good forty-two (42) and seventy-two (72). It is also shown after the comparison of both tables that ten (10) days prediction is better than five days in the context of selling and buying, while in hold since five days’ prediction is better than ten days, but our primary focus is on Buying and selling; so ten days’ prediction is better.
The study's major objectives were to forecast the trends for coming days and signals of buy, hold, and sell in the stock market of Pakistan KSE-100 index are achieved in this study, and it's helpful for investors and researchers in future decision-making. KSE-100 index prediction has been made through various statistical, regression, and fundamental models having different results. This study is unique from all other studies that used different technical indicators (TTR) on artificial neural networks to predict the stock market of Pakistan. In this study, we use more than ten indicators on ANN to forecast the signals of the market, and at the end, we also find out the precision and recall of those signals, which shows the accuracy of the model and predictors. First, we forecast the trend of the Pakistan stock market through a candle chart and show the trends of the market through candle boxes in that graph; we also show the T value, which includes the essential transaction cost or broker commission, and set the threshold of 2.5% and shown the signals of buy, sell and hold in that graph that when investors are in that position when he attains the margin of the profit which also covers the basic transaction cost.
Secondly, we answered our second question of which indicator is best among all others; we used a random forest graph with Mean Square Error (MSE) on one side and all indicators on the other with a threshold of 15. It is a hard and fast rule that different markets use different thresholds (the USA used 30), but in our market, it is impossible to use a threshold above fifteen (15). As a result, various indicators cross the limit of fifteen (15), and three indicators are in the twenty (20) range. Therefore, we found that SAR is the best among all indicators, but the other indicators that cross the level of twenty are also helpful in the Pakistan Stock Market (PSX) prediction.
Third, the study predicted the signals and then checked the accuracy of those signals through precision and recall. We divided the testing data into two parts, one for the test and the other for the evolution of those signals. Precision and recall of different days (five and ten days) results for sell and buy five days’ sell (0.26, 0.47), buy (0.33, 0.34), and hold (0.29, 0.40). In comparison, ten days’ sell (0.41, 0.42), buy (0.35, 0.72), and hold (0.19, 0.30) show that sell and buy signals of ten days’ prediction are accurate than five days’ signals and hold signals are in five days’ prediction better than ten days, but investors always focus on sell and buy instead than have security or stock.
Managerial/Academic implications: The investigation results directly affect investors (individual and institutional), researchers, brokers, and policymakers. SECP (Securities and Exchange Commission of Pakistan) included EWMA (Exponential Weighted Moving Average) as one of the methods of risk metrics, technical indicators, and artificial neural networks that can be added to superior performance in the prediction of highly volatile Pakistan stock market (KSE-100 index), for their successful application on daily and weekly basis. Brokers, investors, researchers, and institutional investors are using conventional methods for forecasting in the Pakistan stock market; empirical findings of the study could give them insight and knowledge about the importance and effectiveness of technical indicators on neural networks for better prediction of the stock market. Using this technique, they can forecast market trends and behavior, which is helpful for investors in decisionmaking about their investments.
As the neural network is still not applicable practically and as a novel concept in Pakistan, the findings and conclusion of this study would incentivize them to further explore their usefulness in stock market prediction. Individual investors can also get insight from the study's findings as the advancement of technology has made access quite easy to data, and ANN's models can be applied with ease using the market's available data.
This study used daily data of the KSE-100 index from July 1997 to June 2017 to forecast the next day's trend or direction through technical analysis using artificial neural networks. As Pakistan's stock market is considered volatile, it will be interesting to test the findings of Poh and Yao for KSE weekly and monthly. As already mentioned, the back-propagation neural network used in future research can focus on applying advanced hybrid models such as Elman neural networks, Jordan neural networks, and probability neural networks for accuracy and better prediction. In our study, only twelve indicators are used in the future more indicators are used for better and more accurate predictions of the signals of the market. The collected data is employed in this investigation from 1997 to 2017 to train the data; however, in the future, the data set could be enhanced by the inception date from 2017 to 2021. In the future, this study with advanced hybrids of neural networks and inductions of more technical indicators will forecast the KSE-30 index, considered the most active index.
[Crossref] [Google Scholar] [PubMed]
[Crossref]
Business and Economics Journal received 6451 citations as per Google Scholar report


