Research Article - (2022) Volume 10, Issue 10
Received: 28-Sep-2022, Manuscript No. jnd-22-73414;
Editor assigned: 30-Sep-2022, Pre QC No. P-73414 (PQ);
Reviewed: 14-Oct-2022, QC No. Q-73414;
Revised: 19-Oct-2022, Manuscript No. R-73414 (R);
Published:
26-Oct-2022
, DOI: 10.4172/2329-6895.10.10.517
Citation: Wei, Xiaoyan, Cao X, Zhen Z and Zhou Y. "Epileptic Seizure Prediction from Multivariate Sequential Signals Using Multidimensional Convolution Network" J Neurol Disord 10 (2022):517.
Copyright: © 2022 Wei X, et al. This is an open-access article distributed
under the terms of the creative commons attribution license which permits
unrestricted use, distribution and reproduction in any medium, provided the
original author and source are credited.
Background: The ability to predict coming seizures will improve the quality of life of patients with epilepsy. Analysis of brain electrical activity using multivariate sequential signals can be used to predict seizures.
Methods: Seizure prediction can be regarded as a classification problem between interictal and preictal EEG signals. In this work, hospital multivariate sequential EEG signals were transformed into multidimensional input, multidimensional convolutional neural network models were constructed to predict seizures several channels segments were extracted from the interictal and preictal time duration and fed them to the proposed deep learning models.
Results: The average accuracy of multidimensional deep network model for multi-channel EEG data is about 94%, the average sensitivity is 88.47%, and the average specificity is 89.75%.
Conclusion: This study combines the advantages of multivariate sequential signals and multidimensional convolution network for EEG data analysis to predict epileptic seizures, thereby enabling early warning before epileptic seizures in clinical applications.
Epilepsy; Seizure prediction; Multidimensional; Convolutional network multivariate; EEG signals
(EEG) Electroencephalogram; (CNN) Convolutional Neural Network; (AS) Awake Stage; (SS) Sleep Stage; (IT) Ictal Time; (1D) One-Dimensional; (2D) Two-Dimensional; (SVM) Support Vector Machines; (ApEn) Approximate Entropy; (ReLU) Rectified Linear Unit
China accounts for nearly a quarter of the epilepsy patients worldwide [1], seizures at anytime and anywhere causes serious psychological burden to patients, which brings all kinds of restrictions that are difficult to prevent to daily life [2]. The World Health Organization led the global burden of disease study and analyzed the disability adjusted life years (DALYs) of 291 diseases in 21 regions. It reported that the DALYs of epilepsy were 253 (205- 308), ranking the second among neurological diseases [3]. During 1990- 2016, the age standardized prevalence rate of male and female specific epilepsy per 1,00,000 people showed the characteristics of rejuvenation and regionalization, the high prevalence rate and the imbalance of regional medical resources are prominent.
The study of seizure prediction is to identify the early stage of seizures to achieve the purpose of early warning of seizures [4], many algorithms have been developed to detect long-term epileptic activity using sequential signals [5]. The expected algorithms must have high accuracy and low false positives. The framework [6] includes data acquisition, signal prepossessing, and feature extraction, building model, evaluation and clinical application, as shown in Figure 1.

Figure 1. Seizure detection/prediction framework.
Traditional epileptic EEG research methods mainly focus on the feature extraction and model building stages [7]. In the feature extraction stage, the original EEG signal is abstracted into intuitive quantitative indicators, mainly including frequency-domain and time-domain indicators [8,9], to analyze the signal amplitude, frequency spectrum and other intuitive observable indicators; Information theory indicators [10], calculate the uncertainty and anti-persistence of signals according to information theory indicators such as entropy [11]; The nonlinear system methods used to reconstruct its nonlinear high-dimensional space tracking motion trajectory based on the chaos analysis of the system, such as correlation dimension [12] and energy aggregation index [13]; Synchronization analysis to calculate the cross-correlation coefficients of multiple time series on different leads [14], and then extract the equivalent width and other indicators to quantify the cross power information between different frequency bands and channels; In addition, there are methods such as high frequency oscillations, physiological and biochemical indexes [15,16]. Feature extraction involves uni-variate and bi-variate analysis, which belongs to manual design. Most importantly, considering the differences of patients, seizure patterns are different and may change with time, it is necessary to automatically extract and learn EEG feature information from EEG [17] data. The analysis time is long, so it is difficult to carry out rapid and intelligent seizure detection and prediction.
In the modeling stage, the solution of epilepsy prediction can be described in two ways [18]. First, researchers try to find some mathematical measures, which can be used as the thresh for alarm [19]. For example, Aarabi, a and he, B of the University of Minnesota [20] set multi-scale reference rules to trigger warning marks when probability statistics reach the threshold range. Another way is that we can regard it as a classification problem between preictal and interictal categories [21]. Focus on finding the time window of the onset or preictal state from different periods [22]. The classification performance is compared by probabilistic models [23] (such as Bayesian and Markov models) and generation models [24] (neural networks, support vector machines, etc.) [25]. Non deep learning algorithm is a limited choice in EEG analysis [26], which needs to be combined with the features of design, and it is difficult to meet the needs of high-dimensional and longterm data.
In the past few years, deep learning has shown an efficient self-learning ability to process big data [27-29]. Research has proved that [30], deep multi-layer perceptron neural network has better performance than traditional logistic regression and support vector machine. Engineering experts [31] use the 13 layer Convolutional Neural Network (CNN) to capture the position and translation invariant patterns in EEG signals. The accuracy, specificity and sensitivity of the algorithm are 95.00%, 90.00% and 88.67% respectively. Later, in the kaggle competition hosted by Mayo epilepsy research center, one of its champion algorithms used deep network to automatically extract features and deploy them in the integrated learning environment of random forest [32,33]. IBM Research Institute has designed a 12 layer CNN automatic extraction deep feature model suitable for embedded chips, which can be used for market expansion [34]. Long Short Term Memory (LSTM) is proposed to realize long-term prediction [35,36]. Most of the automatic seizure detection of deep learning are aimed at single or restricted electrodes [37], so it is difficult to learn the corresponding information of multiple electrodes at the same time. Due to the spread of neuroelectrical activities, epileptic EEG changes will involve multiple brain regions and even the whole brain. In fact, EEG can be analyzed as an image set of temporal flow. At present, the network model proposed in the field of video detection can meet the tasks of automatic feature extraction and real-time image recognition in video data [38].
In this work, epileptic seizure prediction was regarded as a binary classification problem. Multi-channel scalp EEG data will be normalized and passed to hybrid deep learning model to classify as interictal or preictal period. The convolutional layers extract features automatically without human intervention. This study comprehensively calculates and compares convolution network models based on different data dimensions, which will provide a new way to develop seizure detection algorithms for multi-lead EEG data.
Data
The data of this study came from part of the epilepsy data in the EEG room of the Department of Neurology of a top hospital. There were 13 cases of experimental data, including 4 males and 9 females, aged 6-51 years. Electrode placement refers to the international 10-20 system. The sampling frequency is 500 Hz. Because the types of epilepsy are complex and their seizure patterns are different, this paper selects the data of patients with partial epilepsy, including simple partial epilepsy (SPS) and complex partial epilepsy (CPS). Clinical electrophysiologists have labeled each seizure, a total of 155 seizures. Detailed EEG data information is shown in Table 1. EEG acquisition instruments generally include baseline drift, data preprocessing, EEG frequency analysis module, recording module, etc. Commonly used EEG acquisition devices are generally installed with the above basic modules, so signal denoising, baseline drift and other processing have been carried out in the equipment software.
| ID | Sex | Type | Age (year) | Channels | Time (h) | Number of seizures | Seizure time (s) |
|---|---|---|---|---|---|---|---|
| 1 | F | SPS | 36 | 22 | 8 | 10 | 654 |
| 2 | F | CPS | 22 | 22 | 48 | 12 | 274 |
| 3 | F | CPS | 36 | 22 | 8 | 14 | 1386 |
| 4 | F | SPS | 40 | 22 | 24 | 6 | 302 |
| 5 | M | SPS | 6 | 22 | 24 | 21 | 453 |
| 6 | F | SPS | 16 | 22 | 24 | 7 | 329 |
| 7 | F | SPS | 16 | 22 | 24 | 8 | 254 |
| 8 | F | CPS | 28 | 22 | 24 | 5 | 400 |
| 9 | F | SPS | 31 | 22 | 24 | 9 | 423 |
| 10 | M | SPS | 51 | 22 | 24 | 30 | 1064 |
| 11 | M | SPS | 20 | 22 | 24 | 19 | 4072 |
| 12 | M | SPS | 46 | 22 | 24 | 6 | 208 |
| 13 | F | CPS | 15 | 22 | 24 | 8 | 137 |
Data annotation
Deep neural network belongs to supervised learning. The premise of using convolution network model is to obtain labeled data. The original EEG signals in clinical practice are disordered and need to be labeled in advance. The seizure period refers to the EEG range with obvious seizure characteristics, which can be manually marked according to the patient's behavior in the video, and the EEG range between the two seizures is further reduced to remove the interictal period. The definition of preictal duration is still controversial. We have considered 30 minutes as the length of the pre-ictal region as suggested by Maiwald et al. [39], as shown in Figure 2.

Figure 2. Represent the interictal and preictal samples respectively form subject.
Input translation
Considering the subsequent use of multidimensional convolution network model to train the original data, it is necessary to convert the data into a form suitable for network input. Generally speaking, EEG is mainly understood as signal curve. But from the perspective of time and space, it can be seen as a two-dimensional image. Therefore, through this section, the original multi lead signal is transformed into one-dimensional and two-dimensional data input forms.
One dimensional input: The form of one-dimensional input is 1*n, where n is the number of data points, which is related to the size of the proposed data. Here we choose to intercept 5000 fixed time segments every 10 sec. Epileptic EEG the data derived from EEG is 22 leads *n, which contains multiple lead information. The processing method is not fixed. One is to select the optimal single lead one-dimensional data, and the other is to select the lead data in the same time range one by one for splicing as the input form. The data volume is generally too large, and the dimension can be reduced according to the computing capability. The convolution layer is very effective when creating feature maps from input data. When the convolution layers are stacked in the depth model, the layer closest to the input learns low-level features, while the deeper layer in the model learns higher-order or more abstract features, as shown in Figure 3.

Figure 3. Convolution operation in a 1D-CNN.
Two dimensional in put: Seizure signals have obvious waveform, keep the original image and train in the most primitive state is critical to the building model. That is, first build a two-dimensional EEG image, the original value of EEG data as the vertical axis of the image, and the horizontal axis is the time interval of EEG data sampling. Set the signal value range of EEG at (-1000, +1000), and construct a two-dimensional EEG image. EEG signals are non-stationary data. According to the pre-experiment, the sliding time window of the data is 5000 points (10 seconds), and there is no overlap. Finally, if the remaining length is not enough to support a sliding window, enough data information is obtained by overlapping forward. It can be seen that a single image includes 5000 points. Since the convolution network is generally square for image input, it is designed to have a resolution of 5000*5000. Considering the efficiency of subsequent model training, the data is mapped into the matrix and compressed to a size of 256*256, as shown in Figure 4.

Figure 4. Multi-channel two-dimensional image.
Model building and training
The overall research scheme of multidimensional convolution network is shown in Figure 5. Firstly, due to the existence of multi electrodes, the multichannel EEG time series are converted into one and two dimensional data input format by data transformation using the position of electrodes in the brain to meet the needs of synchronous fusion of multi-lead information. The data were input into one-dimensional and two-dimensional convolution network models for training, and the model was used to complete the automatic detection task of epileptic seizures. Deep CNN automatically learns patterns at different stages from EEG signals, and then tests the maintained data using the training model. The experimental environment is selected on the server according to Ubuntu 16.0. The model is built using tensor flow tool in Python language, and the CPU uses Intel 1.60 ghz. The hard disk on the server has a size of 1 T, which meets the storage requirements of more experimental data.

Figure 5. Overview of seizure detection model using multi-dimensional convolution network.
2D CNN network model: A 12 layer 2D depth convolution network structure was constructed as shown in Table 2. In the feature extraction stage, twodimensional convolution layer is used to collect EEG information, and each convolution layer adopts batch normalization to reduce the changes in the distribution of internal neurons. In order to reduce the over fitting stage, the whole connection layer also adopts the drop deactivation strategy. In layer 1-2, the larger convolution kernel (5*5) is used to obtain the global feature information of EEG itself, and then the smaller convolution kernel (3*3) is used to strengthen the local feature information.
| Layer | Type | Kernel Numbers | Kernel size | Stride | Strategy |
|---|---|---|---|---|---|
| 1 | Conv2D | 32 | 5*5 | 1 | LeakyReLU+BN |
| 2 | Max Pooling | 2*2 | 2 | ||
| 3 | Conv2D | 64 | 3*3 | 1 | LeakyReLU+BN |
| 4 | Max Pooling | 2*2 | 2 | ||
| 5 | Conv2D | 128 | 3*3 | 1 | LeakyReLU+BN |
| 6 | Max Pooling | 2*2 | 2 | ||
| 7 | Conv2D | 256 | 3*3 | 1 | LeakyReLU+BN |
| 8 | Max Pooling | 2*2 | 2 | ||
| 9 | Conv2D | 512 | 3*3 | 1 | LeakyReLU+BN |
| 10 | Max Pooling | 2*2 | 2 | ||
| 11 | Fully connected | 2048 | |||
| Dropout | 0.5 | ||||
| 12 | Fully connected | 1024 | |||
| Dropout | 0.5 | ||||
| Softmax |
1D CNN network architecture: One dimensional convolutional neural network is the most common network, which is mainly used for onedimensional data processing, and is commonly used, in signal and timing data. Among them, Wu used 33 layer convolution networks to classify dozens of disease types [40] this study refers to some research architectures, simplifies its network, and constructs the network architecture as shown in Table 3. The network consists of five convolution and pooling operations and two fully connected layers. Considering the one-dimensional convolution, the neuron function here directly uses the relu function.
| Layer | Type | Kernel Numbers | Kernel size | Stride | Strategy |
|---|---|---|---|---|---|
| 1 | Conv1D | 32 | 25 | 1 | ReLU+BN |
| 2 | Max Pooling | 5 | 2 | ||
| 3 | Conv1D | 64 | 25 | 1 | ReLU+BN |
| 4 | Max Pooling | 5 | 2 | ||
| 5 | Conv1D | 128 | 25 | 1 | ReLU+BN |
| 6 | Max Pooling | 5 | 2 | ||
| 7 | Conv1D | 256 | 5 | 1 | ReLU+BN |
| 8 | Max Pooling | 2 | 2 | ||
| 9 | Conv1D | 512 | 5 | 1 | ReLU+BN |
| 10 | Max Pooling | 2 | 2 | ||
| 11 | Fully connected | 2048 | |||
| 12 | Fully connected | 1024 | |||
| Softmax |
Model training and testing: Considering the problem of data imbalance, the data of preictal period is expanded to make the number of different types of data consistent. A total of 42,000 samples were finally obtained. The expansion method is to segment the data by resetting the overlapping window, and ensure that the data sets have the same samples after expansion. In the training phase 36,000 data were selected as the training set, and 10 times cross validation strategy was used to train the model. The data set is randomly scrambled and divided into 10 data of the same size. Select one as the validation data set, and the rest participate in the training. Cycle for 10 times to calculate the comprehensive performance of the overall model. In the reasoning test phase, 6000 independent test data are used to evaluate the performance of the model.
Instructive settings are proposed to help CNN better complete the task of seizure classification. Due to the limitation of hardware and the large amount of data, using a small batch of data for training will bring some data errors, but it can greatly reduce the calculation speed of the model. The batch size is set to 10, and the training complete data set is a cycle, which requires 3600 iterations, and a total of 500 epochs are completed. There are mature optimization algorithms in the network, in which Adam optimizer (initial rate=0.01, β1=0.9, β2=0.999, attenuation=0), optimize. The loss function setting is cross entropy. For the learning rate strategy: Slow down the number of rounds by setting a factor, and observe whether the loss decreases every 10 cycles. If not, halve the learning rate, otherwise divide the learning rate by 10 after meeting the 40 training cycles. Repeat the above three operations until all epoch are trained.
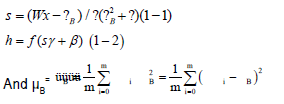
For limited available data sets, it is very important to prevent CNN from over fitting and improve the performance of the model. The first is the application of the drop strategy, which invalidates the weights of some hidden layer nodes. On the one hand, a new network model is generated every time. On the other hand, it increases the robustness of the network and will not affect the network performance because of the loss of individual neurons. Secondly, the data in neural network generally need to be normalized to eliminate the influence of quantitative dimension and extreme value. However, this is far from enough. On this basis, normalize each batch of data to form dual data normalization and reduce the minimum loss of data in the process of network transmission. The principle of BN layer is to remove the average value of batch data after data X completes the calculation of weight W, and then obtain the result through standard deviation transformation. Multiply by two unknown factors (generated in training), namely
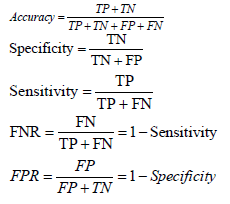
Evaluation index: In practice, it should be evaluated according to the actual situation by integrating a variety of indicators, mainly referring to the confusion matrix, as shown in Table 4.
|
Prediction | |||
|---|---|---|---|---|
| Preictal | Interictal | Total | ||
| Actual | Preictal | True Positive (TP) | False Positive (FP) | TP+FP |
| Interictal | False Negative (FN) | True Negative (TN) | FN+TN | |
| total | TP+FN | FP+TN | TP+FP+FN+TN | |
Clinically, specificity and sensitivity are often used as indicators, and a variety of indicators can be derived from the confusion matrix, as follows:
In the previous description, it is explained in detail that multidimensional data can be converted into one-dimensional (1D) and two-dimensional (2D) input. The 2D data is converting the lead EEG signals into images, and then reconstruct the 2D images of multiple electrodes. Multiple electrodes are all effective leads collected clinically. Whether single lead or multi-lead data, it has important value in EEG signal analysis. Different models have different convolution operations. According to the different forms of the above data, they are respectively input into the multidimensional convolution network model training. Use the test data to get the following classification results of different models.
Figure 6 shows the training and validation accuracy of 1D CNN and 2D CNN model over 500 epochs. We can see that model training accuracy increases and training loss decreases over each iteration. Also, validation accuracy and loss follow the training accuracy and loss trend, respectively. The problem of over fitting is reduced to a great extent. We could achieve a maximum training (Table 5).

Figure 6. Represent the 1D CNN and 2D CNN training loss s respectively.
| Model | Single channel | Multi-channel | |||||
|---|---|---|---|---|---|---|---|
| Accuracy | Specificity | Sensitivity | Accuracy | Specificity | Sensitivity | ||
| 2D CNN | Interictal | 88.53% | 89.65% | 81.30% | 94.13% | 91.10% | 88.60% |
| Preictal | 90.20% | 87.1% | 86.40% | 95.20% | 92.90% | 89.80% | |
The 2D CNN model is used to test the single lead and multi lead EEG data respectively, and the results are shown in the following table. According to Table 5, the test accuracy based on single channel data is 89.28%, FNR is 15.07%, and FPR is 12.20%. The accuracy of 2D cnn based on multichannel is 94.91%, FNR is 8.57%, and FPR is 8.62%. This shows that more EEG data channels carry more information, which can improve the specificity and sensitivity of epilepsy detection models.
1D CNN model is used to test single lead and multi lead EEG data respectively, and the results are shown in Table 6 above. Based on single channel data, the test accuracy is 89.91%, FNR is 15.20%, and FPR is 15.24%. The accuracy of multi-channel data test is 90.57%, FNR is 13.13%, FPR is 11.57%. It shows that multi lead data carries more information in capturing signals, and one-dimensional convolution is simple and fast in model construction, but in the study, the model shows over fitting phenomenon in the test data more frequently.
| Model | Single channel | Multi-channel | |||||
|---|---|---|---|---|---|---|---|
| Accuracy | specificity | Sensitivity | Accuracy | Specificity | Sensitivity | ||
| 1D CNN | Interictal | 88.17% | 85.10% | 82.20% | 90.13% | 88.10% | 86.20% |
| Preictal | 89.56% | 82.90% | 83.80% | 90.20% | 87.90% | 85.80% | |
In the above Table 7, the accuracy of 2D CNN based on multi-channel is 94.91%, FNR is 8.57%, and FPR is 8.62%. The accuracy of 1D CNN is 90.57%, FNR is 13.13%, and FPR is 11.57%. 2D CNN has high accuracy and sensitivity for the seizure prediction model. The FNR and FPR error rates of 1D CNN model are the highest, so it is easy to cause over fitting phenomenon to choose the appropriate lead. Although the 2D CNN model can fuse multi lead information here, its increased dimension makes the model training too complex, and the model performance is slightly lower than that of the 1D CNN. The 2D CNN model conforms to the characteristics of simultaneous analysis of EEG multiple leads, and the model has good performance. According to the different convolution dimensions, multidimensional convolution network provides an automatic seizure prediction method that can effectively fuse multi lead information.
| Model | Multi-channel | |||
|---|---|---|---|---|
| Accuracy | Specificity | Sensitivity | ||
| 2D CNN | Interictal | 94.13% | 91.10% | 88.60% |
| Preictal | 95.20% | 92.90% | 89.80% | |
| 1D CNN | Interictal | 90.13% | 88.10% | 86.20% |
| Preictal | 90.20% | 87.90% | 85.80% | |
Table 8 lists the comparison of 1D CNN based algorithm with traditional machine learning algorithm and 2D CNN. Three studies using the same data measured the proposed algorithm. The first method extracts the predefined feature approximate entropy from EEG data, and uses hyperplane to classify epileptic EEG. This takes a lot of time, and some information may be completely or partially omitted from the selected features. Next, we introduce deep learning strategies, which can automatically obtain data patterns. On average, the proposed 2D CNN method has better performance than 1D CNN method in terms of multi-channel information, shorter time and higher accuracy.
| Methods | Accuracy | Time |
|---|---|---|
| ApEn+SVM | 91.25% | 85.1s |
| 2D CNN | 94.91% | 11.2s |
| 1D CNN | 90.37% | 10.5s |
This study has developed multidimensional convolution network deep models for epileptic seizure prediction. For multi-lead EEG signals, an effective method is proposed to preprocess the original EEG data into one or two-dimensional data format suitable for CNN. Feeding 22 channel multivariate EEG samples of 10 seconds duration directly to the deep learning model yielded a better result than the existing works. The main advantage of this method is to make full use of multi-channel signal information without human intervention. The average accuracy of multi-dimensional depth network model for multi lead EEG data is about 94%, the average sensitivity is 88.47%, and the average specificity is 89.75%. Compared with other simple deep learning and signal processing methods, this method integrates multi-channel information, which has the characteristics of high accuracy and short time-consuming. In contrast, the 2D CNN is more stable, and the 1D CNN generally processes more single channel signals. This study combines the advantages of multivariate sequential signals and multi-dimensional convolution network for EEG data analysis to predict epileptic seizures, thereby enabling early warning before epileptic seizures in clinical applications.
Not applicable.
Not applicable.
Not applicable.
All data were confidentiality collected from the patients who had been admitted to the hospital, because of the hospital’s regulations, the data now cannot be made publicly available.
This research was supported by the National Natural Science Foundation of China (NSFC) [No.61876194], The National Key Research and Development Program of China [No.2018YFC0116902], The Science and Technology Program of Guangzhou [No.202201020625], Young Innovative Talents Project of Colleges and Universities in Guangdong Province [No.2021KQNCX092], Doctoral Program of Huizhou University [No.2020JB028] and Outstanding Youth Cultivation Project of Huizhou University [No.HZU202009].
XYW and YZ conceived of the study and collected the data. WXY, CXY and ZZ formulate the model and performed the computational coding. ZZ conducted the data analysis. XYW and ZZ drafted the manuscript. All the authors read and approved the final version of the manuscript.
Neurological Disorders received 1343 citations as per Google Scholar report