Research Article - (2025) Volume 14, Issue 2
Received: 02-May-2024, Manuscript No. JME-24-133907 ;
Editor assigned: 06-May-2024, Pre QC No. JME-24-133907 (PQ);
Reviewed: 20-May-2024, QC No. JME-24-133907 ;
Revised: 03-Mar-2025, Manuscript No. JME-24-133907 (R);
Published:
10-Mar-2025
, DOI: 10.37421/2169-0022.2025.14.697
Citation: Moges, Atalay Alemayehu and Meseret Ewunetu
Kiberet. "Development and Characterization of Bamboo Leaf Ash Particulate
Reinforced Aluminum Matrix Composite by Compocasting Method." J Material
Sci Eng 14 (2025): 697.
Copyright: © 2025 Moges AA, et al. This is an open-access article distributed under the terms of the creative commons attribution license which permits unrestricted use, distribution and reproduction in any medium, provided the original author and source are credited.
Aluminum Metal Matrix Composites (AMMCs) have continually generated a lot of interest due to the versatility of their applications such as in aerospace, automobile, marine, sports and recreation industries; due to having their outstanding properties of high strength-to-weight-ratio, superior wear resistance, controlled coefficient of thermal expansion, higher fatigue resistance and better stability at elevated temperatures. Even though; AMMCs are the most familiar materials in various applications, the cost of reinforcement materials and manufacturing processes are considered critical problems. Additionally, the mechanical properties such as impact and compressive strength correlated with the uniform distribution of particulates were not well studied. Therefore, this research work mainly focused on the development and characterization of an aluminum metal matrix with reinforced Bamboo Leaf Ash (BLA) through compocasting methods, due to having a high possibility to achieve uniform distribution of particulates. Consequently, the BLAs extracted from agricultural waste through the processes of collecting, drying and conditioning. The chemical composition of the aluminum metal scrap and as-prepared BLA were determined by using spectrometry and X-Ray Diffraction (XRD) respectively. Then, as-prepared BLA powder, weight percentages (0%, 2%, 4% and 6%) were used to develop the composite using the compocasting route, while all other parameters like stirring temperature, time, speed and melting temperature remained constant. The microstructural characterization of as synthesized composite samples carried out by using Optical Microscopy (OM). Moreover, the investigation of mechanical properties such as compression, hardness and impact tests of as-synthesized composites through by universal testing machines, Rockwell hardness and impact testing machines respectively. Thus, the sample synthesized by the weight percentage of 4% BLA showed a maximum hardness, compressive and impact strength of about 100.36 HRB, 100.11 MPa, and 37 J respectively. Hence, these BLA-reinforced aluminum metal matrix composites could be a potential candidate for applications such as roofing sheets, door and window panels.
Aluminum matrix composite • Bamboo leaf ash • Compocasting method • Impact strength
Composite materials are formed by combining two or more materials that have quite different properties and they do not dissolve or blend into each other. The different materials present in the composite work together to give the composite unique properties [1,2]. Based on their versatile advantages; composite materials have played an important role throughout human history, from housing early civilizations to enabling future innovations. Composites offer many benefits; the key among them are corrosion resistance, design flexibility, durability, lightweight and strength. Accordingly, there are different types of composite materials were available to solve the challenges of materials for specific applications. Among them, Metal Matrix Composites (MMCs) have emerged as an available alternative to different conventional materials. The application of these composites has been established in different industries such as aerospace, marine, defense and automobile [2]. The versatility of its application, lower cost of production and outstanding properties distinguished aluminum-based composites and it has remained the most used MMCs. In different research work, numerous reinforcement materials such as fly ash, silicon carbide, alumina, silica, graphite and mica among others have been selected due to their appreciable performance in specific applications area of metal matrix composites [1-3]. In the middle of them, the reinforcement materials from agro waste with Aluminum Matrix Composite (AMC) are very crucial for harnessing the desired properties of composite materials in various applications [2]. Many of other researchers confirmed that the AMMCs often have superior wear resistance when compared with unreinforced aluminum and are usually used for manufacturing automobile parts like brake disks, pistons, cylinder liners, valves, gears, pulleys, connecting rods and engine blocks [2,3]. Furthermore, other characteristics have extended the application of these materials from the automotive industries to aerospace, marine, defense and other notable industrial applications to the development of facilities for sports and recreation. Besides, their mechanical properties, amenability to conventional production techniques, the flexibility of obtaining tailored property combinations and the possibility of using less expensive raw materials were the most known advantages of metal matrix composites [3]. In particular, the use of less expensive and environmentally friendly reinforcing materials in the place of conventional synthetic reinforcements such as Silicon Carbide (SiC), Tungsten carbide (WC), Boron Carbide (B4C), Alumina (Al2O3) have received a lot of attention in the past few years especially in the developing countries [3,4]. Among them fly ash and Bamboo Leaf Ash (BLA) are the most inexpensive and suitable reinforcing materials due to containing high amount of silica and their appreciable amount of local availability; also may be collected from an agricultural waste form of materials [4]. It has a high possibility to minimize the cost of the reinforcement materials, due to their high amount of availability with very low cost from agro waste products, which have also been, tested as a potential reinforcing material for manufacturing the required products of composites [5]. Hence, this research work mainly focused on the development and characterization of bamboo leaves ash-reinforced low cost-high performance of aluminum metal matrix composites through compocasting methods for structural applications such as roofing sheets, door and window panels [5,6].
The following materials used to conduct this research works.
Bamboo leaves
It is locally available and collected from agricultural wastes (Figure 1).

Figure 1. Bamboo leaves as fresh and dried.
Aluminum scrap
Aluminum scrap is collected from the waste form of electric cables (Figures 2 and 3).

Figure 2. Aluminum scrap (a waste form of electric cables).

Figure 3. The following steps used as a method to conduct the experimental works.
Equipment and tools
During the experiment, various equipment and tools used to produce composite materials and perform mechanical testing. Some of these are listed below.
Electric resistance furnace, digital weight balance, universal testing machine, Charpy impact testing machine, spectroscopy, Rockwell hardness testing machine, portable hand drill machine, optical microscope, X-Ray Diffraction (XRD) machine, grinder, sieves and saw, abrasive paper [7].
Experimental work
After the selection of materials, the synthesization, characterizations and performance evaluation of mechanical properties of each specimen subjected to the following mechanical tests as per the workshop equipment are listed below in a tabular column as follows (Table 1).
|
S. no |
Activities |
Machine setup |
|
1 |
Selection of materials |
Qualitative study |
|
2 |
Formation of composites |
Compocasting method |
|
3 |
Study of microstructure |
OM |
|
4 |
Hardness test |
Rockwell hardness testing machine |
|
5 |
Impact test |
Charpy impact machine |
|
6 |
Compression test |
Universal testing machine |
|
6 |
Determining the composition of BLA |
XRD analysis |
|
7 |
Determining the composition of Al metal |
Spectrometry |
Table 1. Types of activities and machine setup.
Selection of materials
Preparation of matrix (aluminum scrap) for melting: Aluminum scraps as shown in Figure 4 collected from scraps of electric cables, which selected as the matrix material for investigation. Aluminum scraps (wires) were collected, cut into pieces of the cross-section about 150 mm by a saw, cleaned and dried for melting as shown in the below.

Figure 4. (a) Aluminum scraps (b) cut aluminum scraps (c) cleaned and (d) dried form scraps.
The chemical composition of the aluminum scrap presented in Table 2. The chemical composition of matrix material was determined using atomic absorption spectrophotometer.
| Symbol | Composition % (wt) in Al metal | Symbol | Composition % (wt) in Al metal |
| Li | 0.59 | Co | 0.032 |
| Fe | 0.31 | Ga | 0.025 |
| Zn | 0.23 | Si | 0.023 |
| Ce | 0.053 | Ni | 0.022 |
| Sn | 0.048 | Ti | 0.02 |
| Bi | 0.039 | Cr | 0.015 |
| Pb | 0.037 | Others | 0.058 |
| Cd | 0.036 | Al | 98.4 |
Table 2. Chemical composition of aluminum scrap (matrix materials).
Preparation of Bamboo Leaves Ash (BLA) for reinforcement materials: Dry bamboo leaves as shown in Figure 5, collected from farmlands having a large mass of bamboo trees found in Ethiopia Sidama and Gojam region; which were used to prepare the ash. The BLA was prepared following procedures and precautions reported by Alaneme et al. Based on the procedures, the collected bamboo leaves placed in a metallic drum and fired in the open air to allow for complete combustion. The ash produced from the burning process allowed to cool for 24 h before removal from the drum. The ash then milled and conditioned using a muffle furnace at a temperature of 650â?? for 3 h to remove carbonaceous materials. A sieve shaker used to sieve the BLA to obtain ashes with mesh size under 125 μm. Accordingly, the preparation of BLA that used as reinforcement materials in this research shown with the whole steps in Figure 5. Thus, the prepared BLA particles with a size of 125 μm, minimum particle size could be prepared in our laboratory and with varying amounts used as reinforcing material in the preparation of composites [8].

Figure 5. (a)Dry bamboo leaves (b) burning dried bamboo leaf (c) as-received bamboo leaf ash and milling (d) Bamboo leaf ash after conditioning in a muffle furnace at temperature of 650â?? for 3 hours and prepared bamboo leaf ash with particle size under 125 μm.
Composite molding and sample preparation
Before starting the composite molding, the required mass of the particle and matrix for each volume fraction was calculated according to the following equations [9,10].
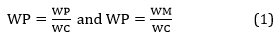
From the definition of the density of a single material wp.
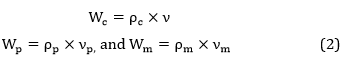
By substituting equation (2) in equation (1), the mass fractions and volume fractions related as:
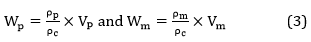
By using (wc=wp+wm) we can find the following equation
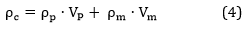
Where W=weight fraction, V=volume fraction, w=weight, υ=volume, ρ=density, p=particle and m=matrix for all the above equations. The percentage composition of matrix and reinforcement material was shown in Table 3 different wt% ratios of matrix metal and reinforcement were used (S1=2 wt%, S2=4 wt%, S3=6 wt% and S4=0 wt% of BLA).
| Samples | Aluminum metal (gm) | BLA (gm) |
| S1 | 1176 | 24 |
| S2 | 1150 | 50 |
| S3 | 1126 | 74 |
| S4 | 1200 | 0 |
Table 3. Different wt% ratios of matrix and reinforcement.
For the initial stages of preparation of the particle-reinforced metal composites, a mould was required and for this project work a 120 mm × 70 mm would as shown in Figure 6 were prepared from cast iron materials. Before pouring the molten metal into the mould, the mould preheated to 450°C to prevent rapid solidification.

Figure 6. The dimensions of the prepared moulds.
Development of composite materials
The compocasting technique was used for the synthesization of composites, which is the simplest and low-cost manufacturing method and is suitable for academic purposes/low-volume production. Consequentially, the charge calculation was utilized to determine the amount of BLA and Al cable scrap required to prepare 0, 2, 4 and 6 wt % reinforcements in the Al matrix. The BLA particles were initially preheated at a temperature of 650°C for 3 h to remove carbonaceous materials, remove moisture and help the improvement of wettability with the Al metal melt.
The aluminum was charged into a crucible furnace and heated to a temperature of 700°C ± 30°C (above the liquids temperature of the aluminum metals) to ensure the metal melts completely. The molten metal was poured into cast iron moulds as shown in Figure 6 having a diameter of 70 mm and length of 120 mm at a pouring temperature of 730°C. After the molten metal poured into the mould, the liquid alloy then allowed cooling in the mould to a semi-solid state at a temperature of about 550°C. The preheated BLA then charged into the melt at this temperature and stirring of the slurry performed by using a hand drill machine for 3 minutes. The total amount of reinforcement being introduced into the melt 3 times rather than introduced all at once. At every stage after the introduction of reinforcement, stirring carried out for a period of 3 minutes. The vigorous stirring operation performed at a high speed of 1500-2500 rpm ( 2000 rpm) for 3 minutes. For all the experiments, BLA particle sizes were maintained about 125 μm. The stirrer was preheated before immersing into the melt and is located approximately to a depth of 2/3 height of the molten metal from the bottom and runs at a speed of 1500-2500 ( 2000 rpm). Compo-casting setup consists of a hand drill that a hand-held tool with a rotating stirrer used to distribute BLA in a semisolid aluminum matrix. A tachometer is a device for counting the speeds, it used to measure the speed with the number of revolutions per minute (rpm) and the thermocouple is a sensor that used to measures temperature as shown in Figure 7.

Figure 7. (a) Pouring processes, (b) Stirring with charged BLA, (c) Measuring speed of 1500 rpm-2500 rpm (~2000 rpm).
The prepared composites as shown in Figure 8 were followed by characterization through by Optical Microscope (OM) and X-Ray Diffraction (XRD). For reanalysis, a plot of 2-theta versus intensity could be analyzed using origin plus software. To investigate the mechanical properties of the composites such as hardness, impact and compression tests were carried out using a Rockwell hardnesstesting machine, Charpy impact testing machine and universal testing machine, respectively.
The casting samples with different wt% reinforcements were prepared and labeled respectively as shown below:
Casting-1 (S-1): Al metal+2% BLA
Casting-2 (S-2): Al metal+4% BLA
Casting-3 (S-3): Al metal+6% BLA
Casting-4 (S-4): Al metal+0% BLA

Figure 8. Samples obtained after compocasting.
Characterizations and testing of mechanical properties of specimens after the development of composites, the characterizations and mechanical properties testing of each specimen subjected to the mechanical tests as per the workshop equipment explained as follows.
The microstructures of assynthesized composites examined using optical microscopy to assess the distribution of the reinforcements in the Al matrix. Specimens of 20 mm diameter and thickness of 10 mm were cut from the central portion of the casting, machined and then polished several times for microstructural studies conducted using Optical microscopy as shown in Figure 9.

Figure 9. Microstructural characterization of as prepared samples.
Hardness test
Hardness is the property of a material that enables it to resist plastic deformation usually by penetration. However, the term hardness may also refer to resistance to bending, scratching, abrasion or cutting. In this project work, the samples were cut from the bulk composite materials and machined for the hardness test. The machined samples were polished to obtain a flat and smooth surface finish before the test. The tests were conducted using 1/16 inch diameter diamond indenter at an applied load of 100 kg for 10 seconds. The hardness values of the composites before and after the addition of BLA particles were measured. The hardness value reported was the average value of five readings taken at various locations on the polished specimen. For each test, 5 different composition specimens were tested as shown in Figure 10 below.

Figure 10. (a) Specimen, (b) Impact testing.
Impact tests are designed to measure the resistance to failure of a material to a suddenly applied force. The test measures the impact energy or the energy absorbed prior to fracture. The most common method of measuring impact energy is the Charpy test. A bar supported at both ends as a simple beam and broken by a falling pendulum. While most commonly used on metals, it also used on polymers, ceramics and composites specimen. The Charpy impacttesting machine tested the impact strength of the composites. This test measured the kinetic energy needed to initiate the fracture and to continue until the breakage of the specimen. The matrix fracture, particle matrix de-bonding and particle pullout are important failure modes observed in the particle composites due to impact loading. The standard dimension for the Charpy test is ASTM D256. Aluminum metal be-fore and (b) after hardness test matrix BLA reinforced composite specimens of size 55 mm length, 10 mm width and 10 mm thickness according to ASTM D256 standards were prepared with 0 wt %, 2 wt%, 4 wt% and 6 wt% of BLA particulate (Figure 11).

Figure 11. (a) Specimens before and (b) After the impact test.
Compression test
A compression test determines the characteristics of materials under crushing loads. The sample is compressed and deformation at various loads is noted. A compression test is any test in which a material experience opposing forces that push inward upon the specimen from opposite sides or is otherwise compressed, squashed, crushed or flattened. It becomes important to find a suitable load to carry out the operations. Load depends on the materials and flow stress. The flow behavior of aluminum at different strain rates can be determined by establishing a relationship between flow stress, strain and strain rate. The compression test carried out using a standard compression test DIN 50106 at room temperature. Compression tests conducted on specimens of 15 mm diameter and 65 mm length machined from the cast composites.
The test sample placed in between two plates that distribute the applied load across the entire surface area of two opposite faces of the test sample and then the plates pushed together by a universal test machine causing the sample to flatten. A compressed sample usually shortened in the direction of the applied forces and expands in the direction perpendicular to the force. Compression tests carried out before and after the addition of BLA particles and for each composite three tests conducted and the average value reported as shown in Figure 12.

Figure 12. (a) Specimens before and (b) After compression test.
Microstructural analysis
Synthesization of metal matrix composites with BLA particles by casting processes is usually difficult because of the very low wettability of BLA particles and agglomeration phenomena that results in non-uniform distribution and poor mechanical properties. In the current work, an attempt has been made to prepare aluminum metal matrix composites with micro-size BLA particles by compocasting. The magnitude of BLA powder used in the composites was 0, 2, 4 and 6 wt%. The optical micrographs of the aluminum metal matrix with 0, 2, 4 and 6 wt% BLA particulates reinforced composites were shown in Figure 13.
Figure 13 shows that, the microstructure of as-cast aluminum containing porosity due to may gas entrapment and shrinkage, Al with 2 wt% BLA, 4 wt% and 6wt% BLA particulates. The microstructure of the prepared composites contains primary Al dendrites, tree-like structure and BLA particles separated at interdendritic regions. The Compocasting of the melt after introducing particles has resulted in the breaking of dendrite shaped structure into equiaxed form, having approximately equal dimensions in all directions; it improves the wettability and incorporation of particles within the melt and causes to disperse the particles more uniformly in the matrix. Figure 13 reveals the distribution of BLA particles in different specimens and it can be observed that there is a fairly uniform distribution of particles and also agglomeration of particles at few places were observed in the composites reinforced with 2 wt%, 4 wt % and 6 wt% BLA. The microphotographs also indicate that the BLA particles have a tendency to segregate and cluster at inter-dendritic regions. Further, the micrographs show that the grain size of the reinforced composite is smaller than the metal without BLA particles because BLA particles added to melt also act as heterogeneous nucleating sites during solidification. In a conclusion, the uniform distribution of particulates in composites was relatively better in the sample with 4 wt% of BLA. When the weight fraction of particle size is above optimum, it may lead to agglomeration and cause porosity as shown in Figure 13.

Figure 13. X-ray diffraction analysis.
Figure 14 shows that XRD analyses conducted on BLA particles in order to confirm the presence of SiO2 and to identify other phases formed. In the X-ray diffraction pattern, four major peaks have been obtained in the 2θ ranging from 10 to 80 and the peaks at 2θ of 22.44°,28.5°, 40.2°, and 59.2° belong to SiO2 and other remaining minor peaks attributed to impurity. The diffraction peaks of SiO2, which is the major constituent in BLA particles, are clearly observed by XRD analysis (JCPDS Card No. 00-046-1045 SiO2) and it confirms that the BLA has a high amount of silica contents. According to the research work of the major peaks of as-synthesized BLA particulates directly fit (confirms) with the standard peaks of silica.

Figure 14. XRD pattern of (a) as prepared BLA particulates (b) standard peaks of SiO2.
Hardness test results
The obtained results of the Rockwell hardness value of different samples based on the weight percentages of BLA with various indentation surfaces of the samples shown in Table 4 below.
| No. of test | 1 | 2 | 3 | 4 | 5 | Average |
| 0 wt.% of BLA | 87.4 | 84 | 88.5 | 90.3 | 83.3 | 86.7 |
| 2 wt.% of BLA | 87.7 | 100.8 | 87.5 | 100.6 | 90.2 | 93.36 |
| 4 wt.% of BLA | 94.9 | 107.7 | 102.3 | 103.7 | 93.2 | 100.36 |
| 6 wt.% of BLA | 97.3 | 98.2 | 96.9 | 101.1 | 100 | 98.74 |
Table 4. Hardness value (HRB) with 0, 2, 4 and 6 wt% of BLA particulate.
Accordingly, Figure 15 shows the results of hardness tests conducted on aluminum metal and the AMMCs containing different weight percentages of BLA particles. The hardness measured on the polished samples using a diamond cone indenter with a load of 100N and the value reported is the average of five readings taken at different locations. A significant increase in the hardness of the metal matrix can be seen with the addition of BLA particles. A higher value of hardness is a clear indication of the fact that the presence of particulates in the matrix has improved the overall hardness of the composites. This is true due to the fact that aluminum is a soft material and the reinforced particle being hard, contributes positively to the hardness of the composites. The presence of stiffer and harder BLA reinforcement leads to the increase in constraint to plastic deformation of the matrix during the hardness test. Thus, the increase in the hardness of composites could be attributed to the relatively high hardness of BLA itself. Among all the composites investigated, 4 wt % of BLA-reinforced com-posites exhibited the highest hardness value of 100.36 HRB. This also implies an in-crement of 13.66% in comparison with unreinforced aluminum metals. These trends attributed to the presence of BLA in the reinforced composites because the basic mechanism of composite deformation is a load transfer from matrix to reinforcement and good bonding between matrix and reinforcement gives rise to better load transfer and improved properties. Thus, in particulate reinforced composites, the load on the matrix is transferred to the reinforcing elements; thereby increasing the load-bearing capacity of the composites.

Figure 15. Variation in hardness of Al-metal before and after addition of BLA particulates.
Impact testing results
The obtained results of the impact strength of as-synthesized BLAreinforced composite sample with a variety of weight percentages of BLA were shown in Table 5 below.
| Weight % of BLA | Samples | Impact-absorbed energy (Joules) | Average |
| 0 wt% | S1 | 25.3 | 23.6 |
| S2 | 30 | ||
| S3 | 15.5 | ||
| 2 wt% | S1 | 24 | 31.33 |
| S2 | 35 | ||
| S3 | 35 | ||
| 4 wt% | S1 | 39 | 37 |
| S2 | 27 | ||
| S3 | 45 | ||
| 6 wt% | S1 | 21.3 | 29.77 |
| S2 | 35 | ||
| S3 | 33 |
Table 5. Impact strength value with 0, 2, 4 and 6 wt% of BLA particu-lates.
According to the obtained results, Table 5 shows that resistance to impact loading of composites improves with increasing BLA particle volume. The impact strength of the composite depends on the volume of the particle, the type of matrix and the orientation of the particle. Aluminum metal before and after the addition of different wt% of BLA particulates reinforced composite at 2 wt%, 4 wt% and 6 wt%of BLA as shown in Figure 16. Thus, the maximum impact energy absorption (impact strength) was obtained from a sample of AMMCs with 4 wt% of BLA. Hence, the fracture toughness values in comparison with 4 wt % of BLA increase in toughness, due to the presence of optimum volume fraction of BLA particulates.

Figure 16. Absorbed energy (impact strength) versus variation of weight % of BLA particulate in composites.
Compression testing results
The compression test results of as-synthesized composites shown in Tables 6-9 with different samples based on the variation of weight percentages (wt %) of BLA. The test carried out by using three samples for each weight percentage of BLA, then taking the average value for optimum compressive stress and elongation (strain).
| No. | Sample 1 | Sample 2 | Sample 3 | Average | ||||
| S (N/mm2) | E (%) | S (N/mm2) | E (%) | S (N/mm2) | E (%) | S (N/mm2) | E (%) | |
| 1 | 0 | 0 | 0 | 0 | 0 | 0 | 0 | 0 |
| 2 | 57.07 | 2.84 | 20.13 | 1.63 | 19.07 | 0.94 | 32.09 | 1.8 |
| 3 | 79.47 | 7.26 | 49 | 3.28 | 52.4 | 2.47 | 60.29 | 4.34 |
| 4 | 90.67 | 11.97 | 57.4 | 6 | 62.53 | 4.2 | 70.2 | 7.39 |
| 5 | 98 | 16.67 | 59.93 | 6.91 | 67.6 | 6.04 | 75.18 | 9.87 |
| 6 | 101.87 | 21.42 | 65.47 | 9.76 | 70.2 | 7.97 | 79.18 | 13.05 |
| 7 | 102.8 | 26.22 | 67.13 | 12.66 | 71.13 | 9.93 | 80.35 | 16.27 |
| 8 | 102 | 31.05 | 65.87 | 15.63 | 69.8 | 12.91 | 79.22 | 19.86 |
Table 6. Compressive Stress (S) and Elongation (E) values for 0-wt% of BLA.
| No. | Sample 1 | Sample 2 | Sample 3 | Average | ||||
| S (N/mm2) | E (%) | S (N/mm2) | E (%) | S (N/mm2) | E (%) | S (N/mm2) | E (%) | |
| 1 | 0 | 0 | 0 | 0 | 0 | 0 | 0 | 0 |
| 2 | 16.67 | 1.85 | 62.2 | 3.54 | 25.93 | 1.39 | 34.93 | 2.26 |
| 3 | 56 | 4.28 | 76.2 | 6.28 | 67.33 | 3.83 | 66.51 | 4.8 |
| 4 | 68.07 | 7.04 | 83.47 | 8.2 | 75.67 | 5.67 | 75.74 | 6.97 |
| 5 | 74.13 | 9.92 | 87.4 | 12.1 | 82.13 | 7.61 | 81.22 | 9.88 |
| 6 | 76.2 | 12.89 | 89.33 | 15.03 | 83.87 | 10.6 | 83.13 | 12.84 |
| 7 | 76.8 | 15.68 | 90 | 18 | 84.73 | 13.56 | 83.84 | 15.75 |
| 8 | 73.2 | 15.83 | 89.67 | 19.97 | 84.2 | 15.58 | 82.36 | 17.13 |
Table 7. Compressive Stress (S) and Elongation (E) values for 2 wt% of BLA.
| No. | Sample 1 | Sample 2 | Sample 3 | Average | ||||
| S (N/mm2) | E (%) | S (N/mm2) | E (%) | S (N/mm2) | E (%) | S (N/mm2) | E (%) | |
| 1 | 0 | 0 | 0 | 0 | 0 | 0 | 0 | 0 |
| 2 | 18 | 2.29 | 13.47 | 1.83 | 61.33 | 2.73 | 30.93 | 2.28 |
| 3 | 54.53 | 3.9 | 52 | 4.28 | 90.4 | 8.23 | 65.64 | 5.47 |
| 4 | 66.27 | 7.63 | 67.67 | 6.95 | 107.67 | 12.92 | 80.54 | 9.17 |
| 5 | 73.93 | 10.6 | 78.2 | 9.79 | 119.4 | 16.7 | 90.51 | 12.36 |
| 6 | 77.73 | 13.61 | 85.07 | 11.7 | 127.07 | 22.4 | 96.62 | 15.9 |
| 7 | 79.07 | 16.67 | 91.6 | 18.52 | 129.67 | 25.26 | 100.11 | 20.15 |
| 8 | 75.8 | 17.83 | 83.47 | 21.55 | 127.07 | 27.24 | 95.45 | 22.21 |
Table 8. Compressive stress (S) and Elongation (E) values for 4 wt% of BLA.
| No. | Sample 1 | Sample 2 | Sample 3 | Average | ||||
| S (N/mm2) | E (%) | S (N/mm2) | E (%) | S (N/mm2) | S (N/mm2) | E (%) | S (N/mm2) | |
| 1 | 0 | 0 | 0 | 0 | 0 | 0 | 0 | 0 |
| 2 | 12.87 | 1.09 | 54.27 | 2.49 | 14.73 | 1.26 | 27.29 | 1.61 |
| 3 | 54.2 | 2.52 | 78.87 | 5.05 | 51.33 | 2.75 | 61.47 | 3.44 |
| 4 | 68.93 | 4.28 | 91.2 | 7.86 | 66.33 | 4.57 | 75.49 | 5.57 |
| 5 | 76.73 | 6.15 | 97.47 | 10.73 | 74.27 | 6.49 | 82.82 | 7.79 |
| 6 | 81.33 | 8.07 | 100.5 | 13.77 | 78.73 | 8.47 | 86.84 | 10.1 |
| 7 | 85.2 | 14.01 | 100.9 | 16.63 | 81.4 | 11.5 | 89.18 | 14.05 |
| 8 | 83.4 | 16.02 | 99.2 | 19.6 | 80 | 14.66 | 87.53 | 16.76 |
Table 9. Compressive Stress (S) and Elongation (E) values for 6 wt% of BLA.
The compressive strength test before the addition of BLA performed in this work is used to compare and explain the difference between the compressive strength tests after the addition of BLA. With the increase in the volume fraction of particle material, more loads get transferred to reinforcement which leads to an increase in compression strength. The stress vs. elongation result and plot for 0, 2, 4 and 6 wt% of BLA particulate reinforcement of composite with a 65 mm length and 15 mm width before and after the addition of BLA is shown in Figure 17.

Figure 17. Compressive stress vs. elongation graph for 0 wt%, 2 wt %, 4 wt% and 6 wt% of BLA reinforced composites.
Table 10 as shown below is used to indicate the ultimate compressive strength of as-synthesized BLA-reinforced AMMCs with different weight percentages of BLA for further clarification. Moreover, the obtained average ultimate compressive results were shown in Figure 18.
| Percentage of BLA particulate | Ultimate compressive stress (MPa) |
| 0 wt% | 80.35 |
| 2 wt% | 83.84 |
| 4 wt% | 100.11 |
| 6 wt% | 89.18 |
Table 10. Average maximum compressive strength for different wt% of BLA particulates.

Figure 18. Compressive stresses against 0, 2, 4 and 6 wt%of BLA reinforced composites.
Based on the results shown on the above Figure 18 and Table 10; the compressive strength of as-synthesized BLA-reinforced aluminum matrix composites were increasing with the weight percentages (% wt) of BLA up to 4%. Then, it declines when the weight percentage increase to 6%. The reduction of strength at 6% BLA might be due to the relatively reducing of interfacial bonding of the matrix with particulates and also the formation of agglomerations of BLA particles in the matrix parts. Moreover, the strength decrease at 6% BLA in composite might be due to an increase in ash particles in the matrix which produces more sites for crack initiation and hence lowers the load-bearing capacity of the composites thus reducing the strength in mechanical testing (compressive, impact and hardness). Hence, the ultimate strength (100.11 Mpa) was obtained from the sample fabricated with 4% BLA, due to the presence of the optimum volume fraction of reinforcement in the metal matrix.
The present work on the preparation of BLA-reinforced Al-metal matrix composite by compocasting and evaluation of microstructural characterization and mechanical proper-ties such as compressive, hardness and impact tests has to lead to the following conclusions:
Journal of Material Sciences & Engineering received 3677 citations as per Google Scholar report