Review Article - (2023) Volume 11, Issue 4
Received: 21-Sep-2022, Manuscript No. ECONOMICS-22-75481;
Editor assigned: 26-Sep-2022, Pre QC No. ECONOMICS-22-75481(PQ);
Reviewed: 11-Oct-2022, QC No. ECONOMICS-22-75481;
Revised: 14-Dec-2022, Manuscript No. ECONOMICS-22-75481(R);
Published:
06-Jan-2023
, DOI: 10.37421/2375-4389.2023.11.376
Citation: Mulatu, Negese Tamirat and Achalu Berecha.
"Determinants of Gender Bias in South Western Ethiopia: Evidence
from Jimma Zone." J Glob Econ 11 (2023): 376.
Copyright: �?�© 2023 Mulatu NT, et al. This is an open-access article distributed under the terms of the creative commons attribution license which permits
unrestricted use, distribution and reproduction in any medium, provided the original author and source are credited.
The gender issue is a key concern of economic development in a less developed country in general and Ethiopia in particular. Therefore, this study attempts to investigate the factors affecting gender bias and its links to economic vulnerability in the Jimma Zone using cross-sectional survey data gathered in 2020/21. A cross-sectional survey data was collected from 399 respondents in Jimma Zone. Primary and secondary data were used. Qualitative and quantitative primary data were employed. Descriptive statistics and econometric methods were developed for the data analysis. The results of binary log it regression showed that the female was significantly affected by age, sex, sexual harassment, marital status, educational status, mother education, income status, community attitude, credit use, and access to information. Therefore, this study recommends the respective bodies focus on awareness creation for the gender issue, which is a base to achieving sustainable economic development.
Economic vulnerability • Ethiopia • Female • Gender bias • Logit regression
Gender is a social construction of relationships between women and men [1]. The gender issue is a crucial area of concern in national economic development [2]. Women and men are different in needs, access to and control over resources, benefits, and decision making power [3]. Girls’ child education is important to reduce gender inequality in less developed countries [4]. Education is a basic foundation of the developing process. It is a key factor in reducing gender bias [5]. Education fundamental factor of human resource development. Right to girl’s child education is denied higher than of boys [6]. Ethiopian women do have less access to education as compared to their male counterparts. Consequently, inequity in higher education represents a serious impact on their politics, economy, employment, and socio-culture [7]. In Ethiopia, a large portion of women participate in traditional roles and minimal in socio-economic development. Therefore, due to this females’ are underrepresented in development programs [8]. Education has a responsible effect on women’s ability to claim other rights, achieve status in society, raise a healthy family, and prevent the spread of diseases such as HIV and AIDS [9]. Gender issues have taken high severity in the education policy of Ethiopia since the new government came to power in the early 1990 [10]. The economic, social, and political situations of females are lower than that of their male counterparts in Ethiopia. Ethiopian females face a heavier burden than males. The larger part of women suffers from various forms of poverty due to unequal access to education, resource, assets, rights in the family and society. Lack of assets makes women vulnerable to various forms of violence and affects their decision making power in the family. Although Ethiopian laws give equal property rights to women tradition and women’s low execution, social and economic status limits their ownership of assets. Women suffer hurtful conditions because of their socio-cultural gender roles and culturally constructed norms [11].
Gender bias in education is a key problem within the Ethiopian society, belonging to poor society. Gender inequality in education, health, employment, work, and credit pay are more systematically has been experienced. Gender gaps and discrimination favoring males against in terms of various aspects large in Ethiopia. Sociocultural factors, socio-economic factors, access to materials and resources, time devoted towards activities, culture, and perspectives among society are the key documented factors to the gender gap. Society especially, girls usually possessed traditional way regarding education due to limited financial resources to spend on education rather than they believed that the resource should be saved for the marriage of their girls. Traditional practices, procedures, and policies usually affect the acquisition of education of girls. Ethiopia is a poor country in a less developed country. It has a predominantly maledominated culture and tradition. Ensuring employment opportunities in Ethiopia is challenging due to the widespread in formality, and seasonality of most jobs. Gender equality in employment has a key for the fulfilment of important sustainable development goals such as achieving gender equality empowerment of all women and girls and promoting inclusive and sustainable economic growth, development, employment, empowerment, and suitable work for all. The discrimination among girls is expressed in various aspects such as the acquisition of education, employment opportunities, attainments of empowerment opportunities, right to property, decision making matter, deprivation perspectives, discouraging social, economic, cultural, and political activities, implementing household chores, and taking care of a need, and requirements of their individuals, communities, and family members. Also, there was discrimination regarding adequate food. In terms of food quality, good quality of food was provided to the male than their counterparts. Obtaining equal rights and opportunities are key to achieving inclusive and sustainable economic growth. The responsibility of individuals, communities, and countries to ensure inclusive and sustainable economic growth they provide equal rights and opportunities to the girls. Girls should be given equal rights and opportunities regarding the acquisition of education, health, and medical facilities, diet and nutrition, poverty, wealth, and resource. Ensuring equal rights and opportunities to the women would promote their well-being and empowerment opportunities [12].
According to the 2011 global gender gap index, Ethiopia suffers from some of the lowest gender equality performance indicators in Sub-Saharan Africa. While remarkable progress has been made in several of the Millennium Development Goals (MDGs), it is lagging in MDG 3. The Global Gender Gap (GGG) report 2010 ranks Ethiopia at 121st position out of 134 countries in terms of the magnitude and scope of gender disparities, and it holds the last position on the literacy rate indicator. 38% of Ethiopian women are literate, as compared to 56.3% literacy among men. Literacy among women varies greatly by age, increasing sharply from 13% among women aged between 45-49 to 64% among women aged between 15-19. The Gross Enrolment Rate (GER) for girls at the primary level increased from 53.8% in 2002/03 to 93% in 2009/10 while the Gross Enrolment Rate (GER) for boys increased from 74.6% to 98.7% during the same period. The Gross Enrolment Rate (GER) of boys in both 2002/03 and 2009/10 were higher than girls. Gender Disparity (GD) is relatively lower in Tigray, Amhara, and Addis Ababa while it is higher in Benishangul-Gumuz (30%), Harari (16%), Gambella (14%), SNNP (13%), and Oromiya (11%). Gender Parity Index (GPI) denotes the ratio of female to male enrolment is 0.94 at the primary level, it declines to 0.83 for the first cycle of secondary education (grades 9-10) and 0.71 for the second cycle (grades 11-12) [13]. Systematic and adequate information on the process of reduction of gender bias was not developed in Jimma Zone. In the Jimma zone, there is no well-developed empirical review of literature for gender bias reducers. Therefore, this study attempts to investigate the factors affecting gender bias and its links to economic vulnerability in South Western Ethiopia, evidence from Jimma Zone. Specifically, to examine the major causes of gender bias and its links to girl’s child in school participation, and to assess the major cause of gender bias and its links to women employed in the formal sector in South Western Ethiopia: Evidence from Jimma Zone.
Gender equality is the equal participation of women and men in decision making, the ability to exercise their human rights, access to and control of resources, benefits of development, opportunities in employment, and all aspects of welfare [14]. Vulnerability is an inability of a system to withstand the perturbations of external stressors. Vulnerability is deeply rooted in the field of natural hazards and poverty. Vulnerability is a system that is exposed to a hazard. It varies from discipline to discipline because of the welfare outcomes. Fertility rate and maternal mortality are very high with the high prevalence rate of HIV/AIDS, due to a variety of factors women are more affected than men [15]. Gender inequality arises from forms like inequality survival, ownership, facilities, benefits, and natality. It takes the brutal high mortality rate of women. Many portrayed women as less deserving of basic life support and quality of life like health, education, right to work, self-respect, and political liberty. Gender bias prevails in terms of social, economic, and political opportunities [16]. Also, inequality between women and men inters of food, health, education, work and wage, and fertility. According to education is the crucial factor that influences gender. As their studies, women are highly influenced by gender bias than their counterparts. Age, mother education, income, community attitude, learning environment, and distance to school significantly influence girl school participation. Girls' child in school participation is positively correlated by school participation. Child girl's number and their proportion in education are very low. The studies of presented that education negatively influences gender bias. Increasing female students' education is a key factor to decrease gender bias. The studies done by presented that age, mother education, income, learning environment, sex of harassment, and religion significantly influenced girls' children in school participation [17].
Discovered a good history of development in the informal sector. Their studies revealed that education, marital status, use of credit, information, and women's training were positively significantly influenced the labour force in the formal sector. Similarly, the participation of women in the formal is lower than counterparts [18]. Democracy promotes gender equality. Hence, democracies promote gender equality through child girl education. Democracy facilitates gender equality. Political institutions, culture, and religion underlie gender inequality. Role of legal rights, political freedom, and religious affiliation found gender equality. Cultural traditions seem to be a more key factor in determining women in the modern trade. Building on the existing studies, the study extends the analysis by considering a comprehensive set of gender equality.
The study estimation strategy was guided by the conceptual framework. Accordingly, gender bias is affected by several demographics such as age, family size, marital status, educational level, mother education, and role model of female teacher; socioeconomic such as credit use and income; psychological factors such as community attitude, learning environment, information use, and access to infrastructure; institutional factors such as sex and sexual harassment are the key determinants that influence gender bias in the study area. Gender bias influences rural women's income and savings. This also, in turn, reduces income growth and induces poverty in the study area. The conceptual framework showed that the most crucial factors and the inter-relationship among them are expected to affect gender bias. The conceptual framework is presented in Figure 1.

Figure 1. Conceptual framework.
Description of the study area
The study was employed in the Jimma Zone, located in South Western Ethiopia. Jimma Zone is located between 7°13’ to 8°56’N latitude and 35°49 to 38°38’E longitudes. The total population of the study area is 212,277, of which 109,480 (51.57℅) is male and 102,797 (48.43%) is female. Agroecological, the Jimma zone is classified into three zones: Highland (35%), midland (47%), and lowland (18%). The largest part of the Jimma zone is midland and the zone is suitable for agricultural yield. The mean yearly rainfall ranges from 1, 200 mm and 2, 500 mm and has a mean annual temperature lies between 20°C and 25°C. The Jimma Zone receives low rains in March while high rains in July. The main production season is July and August during which all major cereal crops are grown. The largest part of this Zone falls within the south Western part of the country. The elevation in the Jimma zone varies from 880 m.a.s.l to 3,340 m.a.s.l. The total area of the Jimma zone is 1.1 million ha. The relatively high population density in the zone coupled with the high proportion of the young population in the rural areas of the zone exerts considerable pressure on farmland (Figure 2).

Figure 2. Map of the study area.
Types and sources of data
Descriptive statistics and econometric methods were employed for the data analysis. Primary and secondary data were used. Qualitative and quantitative primary data were employed. To get the required primary data different methodological approaches like questionnaires, key informant interviews, and focus group discussion were employed. To address the objectives of the study open and close ended questionnaires were prepared. The primary data collection included gender demographic, socio-economic, socio-cultural, and institutional characteristics. Before the field study, the instrument was rigorously reviewed and necessary changes were made. The questionnaires were administered to 399 respondents in Jimma zone, south western Ethiopia. Primary data was prepared from February to June 2020/21 data collection seasons. Classically, the questionnaires were distributed and collected at a later date after completion. The study was supplemented by secondary data obtained from different published and unpublished documents, office of women, office of SMEs, office of education, office of health, relevant literature, websites, and other relevant organizations. Information obtained from secondary sources includes a list of gender. Furthermore, interviews were held with key informants and the office of women and education of Jimma district.
Sampling techniques
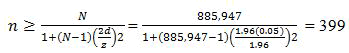
Multi-stage sampling methods were employed to determine sample size. In the first stage: The four districts such as Omo Nada, Gomma, Jimma, and Sokoru were selected purposively due to high girls' child in school participation, and women's employment in the formal sector. The sample respondents from four districts would be selected randomly by employing a random selecting method. The sample size was determined based on the formula given by. Accordingly, a total of 399 respondents were selected for the survey during the 2020/21 2020/21 data collection seasons.
In the third stage: A total sample size of 399 respondents was selected from each stratum using proportionate selecting procedures.
ni=Ni/N (n)
Where ni is the total number of selected samples from each ith selected district, Ni is the total number of populations from ith selected district, N is the total number of populations in the selected district, e is the acceptable error margin, and n is the total sample size (Table 1). Finally, the sample respondents from four districts would be selected randomly by employing randomly sampling methods.
| Selected site | Sample Frame | ni=Ni/N (n) | Sample size |
|---|---|---|---|
| Omo Nada | 3,48,173 | (348,173/885,947) × 399 | 157 |
| Gomma | 32,907 | (32,907/885,947) × 399 | 15 |
| Jimma | 3,81,646 | (381,646/885,947) × 399 | 172 |
| Sokoru | 1,23,221 | (123,221/885,947) × 399 | 55 |
| Total | 8,85,947 | (885,947/885,947) × 399 | 399 |
Method of analysis
Data analysis has been done after all relevant data have been gathered from the respondents. It was carried out using descriptive statistics, inferential statistics, and a logistic regression model. Descriptive analysis was examining demographic characteristics and socio-economic profiles of the gender respondents and performed using indicators such as frequency, averages, percentages, tables, standard deviation, maximum and minimum values, x2 and ttest. Next, the study applied econometric methods to provide a more appropriate and in-depth analysis. To compute the empirical relationship between the dependent variable and independent variables, the research was applied the binary logistic regression model because the dependent variable was gender bias is dummy/binary/take the value 1 if bias and 0 otherwise. A logit model was conducted to evaluate the determinants of gender. In this study, the logit model is employed for its simplicity and ease of interpretation of the parameter estimates in probability terms. A logit regression model with logistic probability distribution its simplicity calculation and probability lie between 1 and 0. It represents a close approximation to the cumulative normal distribution, a mathematically easily used model and is easier to work with. Therefore, the probability of gender bias:
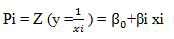
Representation of gender bias, Logit model becomes
Z=β0Σ βixi+ui
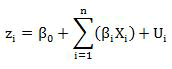
Where:
Zi: The function of explanatory variables (X).
β0: An intercept.
β0,β1,β2,β3…… βn: the slope of the equation in the model.
Xi: The vector of relevant characteristic or independent variables.
Ui: Disturbance term.
GB=β0+β1Ageh+β2Sexh+β3Fash+β4Eduh+β5Inch+β6Mash+β7Cah +β8Ach+β9Infh+β10Aih+ β11Maeduh+ β12Sexhr+ β13Rmft+ β14Le+Ui
Where:
Ageh: Age
Sexh: Sex
Fash: The size of family
Eduh: Educational status
Inch: Income level
Mash: Marital status
Cah: Community attitude
Ach: Access to credit use
Infh: Access to infrastructure
Aih: Access to information
Maeduh: Mother educational status
Sexhr: Sexual harassment
Rmft: The role model of a female teacher
Le: Learning environment
: Disturbance term
Description of variable
Logistic regression was developed to examine the determinants that influence gender bias in this study. The dependent variable for the binary logistic model is gender bias. The variable is binary/ dummy/if it takes 1 gender is bias and 0 otherwise. The demographic, socio-economic, socio-cultural, and institutional variables such as age, sex, size of family, educational status, income, marital status, community attitude, credit use, infrastructure, access to information, mother educational status, sexual harassment, a role model of a female teacher, and learning environment are explanatory variable that affects gender bias in this study (Table 2).
| S. No | Variable name | Variable type | Variable description and its measurement | Expected sign |
|---|---|---|---|---|
| Dependent variable | ||||
| Gender bias | Binary | If 1 for bias and 0 otherwise | ||
| Explanatory variable | ||||
| 1 | Age | Continuous | In years | - |
| 2 | Sex | Dummy | 1 if female and 0 otherwise | + |
| 3 | Family size | Continuous | In number | + |
| 4 | Educational status | Categorical | In years of education schooling | - |
| If 1 for illiterate | In years of education schooling | - | ||
| If 2 for primary education | In years of education schooling | - | ||
| If 3 for secondary education | In years of education schooling | - | ||
| If 4 higher education | In years of education schooling | |||
| 5 | Income | Continuous | ETB | - |
| 6 | Marital status | Dummy | 1 if married and 0 otherwise | - |
| 7 | Community attitude | Dummy | 1 if positive and 0 otherwise | - |
| 8 | Access to credit | Dummy | 1 if Yes and 0 otherwise | - |
| 9 | Infrastructure | Dummy | 1 if having and 0 otherwise | - |
| 10 | Access to information | Dummy | 1 if having and 0 otherwise | - |
| 11 | Mother educational status | Categorical | In years of education schooling | - |
| If 1 for illiterate | In years of education schooling | - | ||
| If 2 for primary education | In years of education schooling | - | ||
| If 3 for secondary education | In years of education schooling | - | ||
| If 4 higher education | In years of education schooling | |||
| 12 | Sexual harassment | Dummy | 1 if Yes and 0 otherwise | + |
| 13 | Role model of a female teacher | Dummy | 1 if Yes and 0 otherwise | - |
| 14 | Learning environment | Dummy | 1 if good and 0 otherwise | - |
| Source: Authors hypothesis 2020/21 | ||||
Description of the study
Table 3 shows the summary statistics of the data collected from a randomly selected sample of respondents. Out of total observations 399 (100%), about 160 (40.1%) of the respondents were not gendered biased, which was relatively smaller than those who gender bias 239 (59.9%) during the 2020/21 season.
| Sample youth | Frequency | Percent | Cumm. Percent |
|---|---|---|---|
| Not gender bias | 160 | 40.1 | 40.1 |
| Gender bias | 239 | 59.9 | 100 |
| Total youth | 399 | 100 | |
| Source: Own survey 2020/21 | |||
Based on responses open-ended questions put to respondents’ lack of personal interest were the main reasons cited for gender bias. Some of the respondents went to the extent of suggesting the need for government to consider distributing credit as a means to reduce gender bias. As the survey data on Table 4 below revealed that in terms of average age didn’t gender biased respondent’s smaller average age than those who did gender bias. The mean age of the respondents is 55.82 years.
| Variables | Obs | Mean | Std. Dev. | t- value |
|---|---|---|---|---|
| Age of respondents | 399 | 55.82 | 0.69 | - 79.4794*** |
| Family size of the respondents | 399 | 4.74 | 0.085 | -47.2369 |
| Income of the respondents | 399 | 10,159 | 345.01 | - 29.4452*** |
| Source: Own survey data 2020/21, ***, and ** implies significant at 1%, and 5% probability level respectively | ||||
The age of sample respondents is statistically significant at a 1% probability level [19]. There is a large family size on the side of gender-biased than not biased population. The variable is statistically insignificant with an average of 4.74. The summary statistics reveal that there is significant variation between didn’t gender biased and gender biased in terms of income of the respondents. The average income of respondents is ETB 10, 159.
The income of sample respondents is significantly influencing gender bias at 1% [20].
In Table 5, education is a categorical dummy variable. Variable can be categorized into four categories: 1 for illiterates, 2 for grade 1-4, 3 for grade 5-8, and 4 for above grade 8. According to the result of the sample data, the majority of the respondent on average attained grades 1-4 (35.84%). Education at grade 1-4 and grade 5-8 are significant at a 1% probability level, whereas education at illiterates and above grade 8 is statistically insignificant. About 53.63% of the sample respondents are literate while 46.37% of the sample respondents are illiterate. The statistical result showed that there was no significant variation between didn’t gender biased and gender biased of respondents in the status of education and the level of education of women-headed households was found statistically significant at 1% level. Mother educational status average attained 1-4 (35.54%) and 5-8 (10.28%) statistically significant at 1% probability level, whereas education at illiterates and above grade 8 was statistically insignificant. According to the descriptive statistics, about 53.13% of the sample respondents are literate while 46.87% of the sample respondents are illiterate. Mother education is statistically significant at a 1% probability level. This study presented that mother education is the most important variable to reduce gender bias.
| Category | 1 | 2 | 3 | 4 | Total |
|---|---|---|---|---|---|
| Mother education | 185 (46.37%) | 143 (35.84%) | 41 (10.28%) | 30 (7.52%) | 399 (100%) |
| Pearson chi2(P-value) | 70.4915 | 70.4915 | 70.4915 | 70.4915 (0.278) | 70.4915 |
| -0.346 | 0 | 0 | 0 | ||
| Educational status | 187 (46.87%) | 141 (35.54%) | 41 (10.28%) | 30 (7.51%) | 399 (100%) |
| Pearson chi2 (P-value) | 70.4915 | 70.4915 | 70.4915 | 70.4915 (0.423) | 70.4915 |
| -0.457 | 0 | 0 | 0 |
According to the data in Table 6, the result shows that majorities 55.65% of the respondents were faced sexual harassment. When we see the comparison of women headed households between sexual harassment and non-sex harassment, out of 100%, 55.65% gender biased households face sexual harassment, and 44.35% non-genderbiased households were not facing sex harassment. The result of statistical analysis showed that household sex harassment affects gender bias significantly at a 1% probability level. The survey statistical data presented that the 56.40% present’s majority respondents were females, whereas 43.60% respondents were male. The majority female respondents have faced more gender inequality than their counterparts. The regression result revealed that sex affects gender bias by a 1% significant probability level. The result of statistical analysis showed that household marital status affects participation in gender bias significantly at a 1% probability level. This result is similar to the results. This marital status is a dummy variable. The field survey data regression result indicated that out of 100%, 53.63% of respondent headed households were married, whereas 46.37% were unmarried. This finding is in line with the finding. The learning environment is a dummy variable. The statistical result showed that there was no significant variation between good and bad learning environments and the status of women headed households was found statistically insignificant. Community attitude is a dummy variable. According to the data, from the total sample of women headed households (52.39%), the sample respondents had negative community attitudes, whereas the remaining 47.62% had positive community attitudes. The result of statistical analysis showed that household community attitude affects gender bias significantly at a 1% probability level. This finding is in line with. According to the result of the sample data, the majority of respondents have no role model of a female teacher. Out of the total respondents 100%, 55.38% have no role model of female teachers, whereas 44.62% respondents have a role model of a female teacher. The regression analysis presented that the role model of a female teacher was found statistically insignificant.
| Category | Pearson chi2 (P-value) | ||
|---|---|---|---|
| Sex harassment | Yes | 222 (55.65%) | |
| No | 177 (44.36%) | ||
| Total | 399 (100%) | 2.8685 (0.0045) *** | |
| Sex | Female | 225 (56.40%) | |
| Male | 174 (43.60%) | ||
| Total | 399 (100%) | 2.5478 (0.0075) *** | |
| Marital status | Unmarried | 185 (46.37%) | |
| Married | 214 (53.63%) | ||
| Total | 399 (100%) | -3.6134 (0.0000) *** | |
| Learning environment | Bad | 211 (52.88%) | |
| Good | 188 (47.12%) | ||
| Total | 399 (100%) | -0.868 (0.8517) | |
| Community attitude | Positive | 190 (47.62%) | |
| Negative | 209 (52.39%) | ||
| Total | 399 (100%) | -2.5023 (0.0000) *** | |
| Role model of female teachers | Yes | 178 (44.62%) | |
| No | 221 (55.38%) | ||
| Total | 399 (100%) | -0.753 (0.6315) | |
| Access to information | Have not information | 219 (54.89%) | |
| Have information | 180 (45.11%) | ||
| Total | 399 (100%) | -2.4825 (0.0055)*** | |
| Use of credit | No access | 204 (51.13%) | |
| Have access | 195 (48.87%) | ||
| Total | 399 (100%) | -2.3275 (0.0200)** | |
| Access to infrastructure | Have no access to infrastructure | 228 (57.14%) | |
| Have access to infrastructure | 171 (42.86%) | ||
| Total | 399 (100%) | -1.1264 (0.0230)** | |
| Source: Own computation based on data (2021) | |||
According to the data, the result shows that majorities 54.89% of the respondents had no access to information, whereas 45.11% of the respondents have access to information. According to respondents of gender bias access to information is a very key variable to reduce gender inequality. The result of statistical analysis showed that access to information affects gender bias significantly at a 1% probability level. Credit was a very crucial variable to eradicate gender inequality and gender poverty. Out of the total 100%, the majority of respondents have no access to credit 51.13%, and the remaining 48.87% of respondents have access to credit. The result of statistical analysis showed that credit use affects gender bias significantly at a 1% probability level. According to the infrastructure use majority of respondents, 57.14% have no access to infrastructure, whereas 42.86% of respondents have access to infrastructure. The statistical result showed that there was significant variation biased and non-biased gender of respondents in terms of access to infrastructure and the access to the infrastructure of respondents was found statistically significant at a 5% probability level.
Multi-collinearity and heteroscedasticity
According to Table 7, before developing binary logistic regression Variance Inflation Factor (VIF) was conducted to test for the presence or absence of multicollinearity problem among the continuous explanatory variables. The variances Inflated Factor (VIF) of this study is 1.09 which is less than recommended values of Variance Inflated Factor (VIF) are 10. This indicates that in this study there is no problem with multicollinearity. So, this current study is free from any multicollinearity problem. For all discrete variables, their values are less than 0.75.
| Variable | VIF | 1/VIF |
|---|---|---|
| Family size of respondents | 1.14 | 0.88 |
| Age of respondents | 1.08 | 0.93 |
| Income of respondents | 1.05 | 0.95 |
| Mean | 1.09 | |
| Source: Own computation based on data 2021 | ||
Heteroscedasticity was tested by using the Breusch-Pagan test and heteroscedasticity was detected by using Breusch-Pagan test or hottest in STATA. This test resulted in the existence of heteroscedasticity hypothesis was needed to make the standard error robust. Using robust standard error, the problem of heteroscedasticity was corrected since the robust standard errors of all explanatory variables were less than 3.
Econometric results
Model estimates for the determinants of gender bias are presented in Table 8. The goodness fit concerning the predictive efficiency was high with 334 (83.70%) of the 399 total respondents included in the model perfectly predicted. Accordingly, ten of the fourteen variables included age, sex, sexual harassment, marital status; educational status, mother education, income status, community attitude, credit use, and access to information were found to have a significant association with the level of gender bias. Specifically, age was found to have a strong negative association with gender bias. Keeping other factors fixed, each extra year of the head’s age is expected to result in an 8.3% reduction in the probability of gender bias, a statistically significant association (P<0.01). Put differently, households whose heads are on average 10 years older are expected to be 83% less likely to gender bias than their younger counterpart, which is quite significant. From all ten significant variables head’s age, sex, sexual harassment, marital status, educational status (2), mother education (2), and income status were statistically significant at 1% probability level, whereas educational status (3), mother education (3), community attitude, credit use, and access to information were at 5% significant level. This result is consistent with findings.
| Variables | Coef. | Odds ratio | Robust std. err. | Z | P>|z| | dy/dx |
|---|---|---|---|---|---|---|
| Ageh | -0.055 | 0.946 | 0.014 | -3.86 | 0.006*** | -0.083 |
| Fash | 0.369 | 0.964 | 0.105 | 0.35 | 0.726 | 0.039 |
| Mash | -1.525 | 4.594 | 0.253 | -6.02 | 0.004*** | -0.375 |
| Eduh | -0.257 | 1.675 | 0.467 | -2.37 | 0.324 | -0.012 |
| -1.453 | 2.867 | 0.658 | -1.56 | 0.000*** | -0.123 | |
| -1.785 | 2,354 | 0.213 | -2.23 | 0.045** | -0.114 | |
| -1.369 | 3.899 | 0.278 | -4.9 | 0.453 | -0.054 | |
| Inch | -0.17 | 1.709 | 0.102 | -6.93 | 0.000*** | -0.174 |
| Sexh | 1.192 | 0.333 | 0.353 | 3.11 | 0.002*** | 0.266 |
| Sexhr | 1.571 | 0.366 | 0.361 | 2.79 | 0.005*** | 0.232 |
| Maeduh | -0.873 | 1.253 | 0.374 | -1.25 | 0.132 | -0.134 |
| -1.534 | 2.134 | 0.782 | -2.31 | 0.007*** | -0.093 | |
| -1.326 | 2.231 | 0.576 | -1.23 | 0.014** | -0.214 | |
| -0.232 | 1.261 | 0.361 | -0.64 | 0.521 | -0.053 | |
| Le | -0.289 | 1.334 | 0.345 | -0.83 | 0.404 | -0.709 |
| Cah | -1.042 | 2.834 | 0.437 | -2.39 | 0.017** | -0.25 |
| Ach | -0.164 | 1.177 | 0.444 | -0.37 | 0.012** | -0.037 |
| Rmft | -0.463 | 1.589 | 0.455 | -1.01 | 0.114 | -0.113 |
| Ifr | -0.192 | 1.211 | 0.408 | -0.47 | 0.639 | -0.045 |
| Aih | -0.671 | 1.957 | 0.356 | -1.87 | 0.032** | -0.164 |
| -Cons | -8.31535 | 0.000245 | 1.283507 | -6.48 | 0.000*** | - |
| Source: Own computation based on data 2021 ***, **and * significant level at 1%, 5% and 10 respectively | ||||||
On the other hand, factors such as head’s age, marital status, educational status, mother education, income status, community attitude, credit use, and access to information had all significant negative associations with gender bias, whereas sex and sex harassment had all significant positive associations with gender bias, with marginal effects ranging between 3.7% to 37.5% on average (citrus paribus). More specifically, an extra unit of head’s marital status, sex, sexual harassment, educational status (3), mother educational status (3), and income were respectively associated with a 37.5%, 26.6%, 23.2%, 23.2%, 21.4%, and 15.4% higher probability of reducing gender bias on average, all else remaining the same.
This study was focused on investigating the determinants of gender bias and its links to economic vulnerability in South-western Ethiopia, evidence from Jimma Zone. The study was used primary and secondary sources of the data. Primary data were collected from interview questionnaires, key informant interviews, and focused group discussions. Descriptive and econometric techniques were applied as the methods of data analysis. The findings revealed that reduction decision of gender bias was associated with significant improvements in women headed household livelihood as reflected in significantly increased women headed household income and saving. Consequently, it can be determined that the overall findings are remarkably robust supporting the robustness of the matching techniques. Moreover, key women headed household characteristics such as age, sex, sexual harassment, marital status; educational status, mother education, income status, community attitude, credit use, and access to information were found to be important factors underlying gender bias. Therefore, it is developed to improve the best gender bias reduction program can be considered as one option to increase women-headed households’ education, income, and saving in the study area.
Given these findings, several implications could emerge from our analysis upon which important suggestions could be made as key recommendations. First, even though the participation in gender bias reduction programs is relatively low in selected districts, women headed households who participated in gender bias reduction programs could generally enhance their income and saving. Consequently, participation in a gender bias reduction program could be considered as one important way to improve the livelihoods of the women headed household. Secondly, the positive impact associated with participation necessitates the need for strategies of expanding participation among gender bias reduction programs in the study area. In this regard, a better understanding of the factors influencing women-headed households’ choice of participation in gender bias reduction programs is quite imperative. More importantly, our findings of the key factors underlying rural women headed household decisions of participating in gender bias reduction programs could serve as an important input for designing policies and strategies aimed at enhancing participation. For instance, the educational status of headed and mother educational status has a strong correlation with the participation gender bias reduction program as it scales up women headed households’ income and savings. Therefore, due emphasis has to be given towards strengthening the educational status of headed and mother educational status at different levels, especially for rural women. Community attitude, access to credit, and information use are crucial activities in gender bias reduction programs, which induce women households’ income and savings. The result of this study indicated that didn’t gender-biased women household in gender biased reduction program has a significant effect on women-headed household’s income and saving. Hence, the gender institutions and other concerned bodies should give attention to women-headed households to enhance women-headed households’ participation in gender bias reduction programs. Therefore, expansion in the level of participation of gender bias reduction programs should consequently find substantial womenheaded households’ mean annual income and saving on a sustainable basis.
A practical limitation of the introduction of this study is the difficulty of taking into account the demographic, psychological, and socioeconomic characteristics of the Jimma Zone citizens, established traditions when making decisions in the field of gender bias reduction programs. There are no equal men and women-headed households treated and participate in gender bias reduction programs in the study area. With the limited scope of the study area, we may not ensure the indicated results of women-headed households’ gender bias reduction program in Ethiopia at the regional and national level. Interaction of knowledge, strategy, and promotion of the study is another limitation for the gender bias reduction program. There are several ways in which this study could be extended. Firstly, the appropriate approaches could be developed and compared to solve the problem of the study at large. Another suggestion would be to consider possible uncertainties in model parameters. A consideration of the delivery risk and incorporations would also be interesting. Therefore, policymakers and plan designers could bring better effectiveness of gender bias reduction programs including several model parameters, expanding the scope of the study area, and conducting comparisons among different countries. Hence, increasing participation in gender bias reduction programs is a crucial option to enhance saving and income.
[Crossref]
[Crossref] [Google Scholar] [PubMed]
[Crossref] [Google Scholar] [PubMed]
Journal of Global Economics received 2175 citations as per Google Scholar report