Research Article - (2022) Volume 13, Issue 8
Received: 03-Aug-2022, Manuscript No. hycr-22-75321;
Editor assigned: 05-Aug-2022, Pre QC No. P-75321;
Reviewed: 17-Aug-2022, QC No. Q-75321;
Revised: 21-Aug-2022, Manuscript No. R-75321;
Published:
29-Aug-2022
, DOI: 10.37421.2157-7587.2022.13.425
Citation: Taha, Mohamed S, Asaad M. Armanuos and Bakenaz A. Zeidan. “Creep of Seawater Intrusion in the Nile Delta Aquifer.” Hydrol Current Res 13 (2022): 425.
Copyright: © 2022 Taha MS, et al. This is an open-access article distributed under the terms of the Creative Commons Attribution License, which permits unrestricted use, distribution, and reproduction in any medium, provided the original author and source are credited.
Background: The Nile Delta aquifer in Egypt subjected to a severe seawater intrusion problems because of the excessive pumping over the last several decades. The seawater has intruded the aquifer up to a distance more than 70.0 km measured from the shoreline along the bottom boundary of the aquifer. Climate change and the rise of sea level will affect the groundwater quality in the Nile Delta aquifer in two methods. First, low and flat lands along the shoreline will be submerged with seawater and the aquifer below these lands will be damaged. Second, pressure heads of sea water will increase causing more intrusion. Seawater intrusion is a process which seawater infiltrates into freshwater aquifers due to natural processes or human activities. Seawater intrusion is caused by decreases in groundwater levels as a result of excessive pumping or by rises in seawater levels as a result of climate change. The salt water rises 40 m for every 1 m of freshwater depression and forms a cone of salt water. The effects of intrusion on water quality not only belongs to the pumping well sites, but also at other well sites, and undeveloped parts of the aquifer. The problem of seawater intrusion is mainly conditioned by three factors: first, the difference between the densities of the fresh and salt water, second, the hydrodynamic properties of the aquifer and third, the flow that the aquifer discharges into the sea. The first two factors are intrinsic to the seawater intrusion problem regardless of the climate in the region. Furthermore, these two parameters are established, and cannot be affected by the usual human activities. The flow that the aquifers discharge into the sea is conditioned by natural conditions (from rainfall) or artificial recharge (mainly from irrigation and canals networks) and by pumping. Therefore, anthropogenic actions can make some modifications. The most prevailing technique is to increase the flow of groundwater from the aquifers towards the sea. In this paper (ARC GIS) program is used to prepare the required maps for the 3-D models (MODFLOW + SEWAT) which are used to simulate saltwater intrusion in the Nile delta aquifer. The amount of water pumped from the Nile delta aquifer through wells belongs to 2008. The recent shore line of the Mediterranean sea is used. The results of the simulation show that the Equi-concentration line 35 reaches 81 km in the east of the Nile delta, 93 km in the middle and 68.5 km in the west for base case. The Equi-concentration line 35 of this simulation is compared with the Equi-concentration line of 1960, 1980 and 1992. It is observed that the creep of the iso saline water occurs at the west and the middle of the Nile delta compared to these years.
Seawater intrusion • Nile Delta aquifer • MODFLOW • Hydrodynamics • Equi-concentration line 35 • Iso saline
Groundwater is considered the main source of fresh water in many countries. Egypt is considered a semi-arid country so it suffers from constrained resources of fresh waters in comparison with its needs for uses and development activities. The major and almost exclusive source of water is the Nile River. The sequent source of water is groundwater where variations of aquifer systems exist. Coastal aquifers are commonly exposed to large-scale groundwater discharge which, in general, exceeds natural recharge rates. Seawater intrusion is a main problem in coastal aquifers. It is considered as a natural process which sea water infiltrates coastal groundwater systems, and mixing with the local freshwater in the coastal aquifer as shown in Figure 1. This process might be accelerated or decelerated by external elements like increasing or decreasing the groundwater discharge, recharge from canals and drains, surplus amount of drainage from agriculture and land use. Seawater intrusion problem was under investigation for over a century [1]. Nile Delta is vulnerable due to the impact of climate change and related sea level rise. Due to low elevation in the Nile delta region, especially low land areas in Alexandria, Behira, Port-Said and Damietta governorates [2]. The Intergovernmental Panel on Climate Change investigated that the average rise of seawater levels varied from 10 to 20 cm during the previous century. It is also expected that during current century the rising of seawater level will range of 11 to 88 cm [3,4]. Due to climate change which may cause sea level rise in presence of low and flat topography of costal area many problems may be occurred. Saline water of the sea will intrude inland through large areas of coastal governorates inundates large coastal areas and the saline line would attack the fresh water of the aquifer. Climate change may lead to rare rainfall forcing people to depend more on ground water abstraction may decrease the level of fresh water head and accelerate salt water intrusion process. The hydraulic gradient of the water table and Piezometric head in the Nile Delta Aquifer would decline as a result of the expected increase in sea level. Deep coastal aquifers with simple hydraulic gradients would have more vulnerability under the cases of climate change and seawater level rise. For the Nile Delta Aquifer, [5,6] investigated the response of Dead and Mediterranean Sea coastal aquifers to sea level rise. A quick response was noticed in the coastal aquifer of the Dead Sea. The simulations of the Mediterranean aquifer showed that for the condition of a steep topography of the coast, simulated as a cliff, the interface, and the shore line are not expected to migrate inland. Inland advance of the shoreline and the interface is proposed for the flat coastal topography with mild slope. Decrease recharge as a result of climate change and/or over pumping of the groundwater would increase the advance of the interface. The possible effects of seawater level rise in the Mediterranean Sea on the seawater intrusion problem in the Nile Delta Aquifer are investigated using FEFLOW. The simulations are implemented in horizontal view while taking into consideration the movement of the shoreline landward employing digital elevation models. In addition the base case (current conditions), six other scenarios are considered. The first three scenarios assume arise of a 0.5 m of seawater while the total abstraction is decreased by 50%, doubled and maintained as the current conditions, respectively. The second three scenarios assume a rise of 1.0 m of seawater and the total abstraction is changed as in the first three scenarios. It is reported that, great areas in the coastal zone of the Nile Delta will be covered by seawater and the coast line will migrate landward by many kilometers in the eastern and western part of the Delta. Scenario six reveals the worst case which the freshwater volume will be decreased to about 513 km3 (billion m3). [2,7] used 3D model (SEAWAT) to examine seawater intrusion in Nile delta aquifer taking into consideration different scenarios, the first scenario is to increase the sea level by 25, 50 and 100 cm. Second scenario is to reduce the surface water system by 25, 50 and 100 cm, the third is to enhance the abstraction rate by 25, 50 and 100% and last scenario is to combine the first three scenarios. The results detect that saltwater intrusion in East Nile delta advanced to 76.25 km from shore line for base case, but migrate to 79.25 km, 79 km, 82 km and 83 km for Equi concentration line 35 and advanced to 92.25 km, 92 km, 91.75 km and 92.75 km for scenarios 1, 2, 3 and 4 respectively.

Figure 1. Sea water - fresh water intrusion [7].
Study area: Nile delta aquifer
The Nile Delta aquifer is considered one of the largest groundwater reservoirs in the world. The Nile delta area is about 22000 km2. It has two thirds of Egypt’s agricultural lands and represents the most fertile land in Egypt [8]. The Nile delta is located between longitudes 29°50 and 32°15E and latitudes 30°05 and 31°30N. It extends from a distance about 20 km North of Cairo which has an elevation of 17 m above mean sea level at the South to the Mediterranean sea at North and from Port Said and Suez canal at east to Alexandria and Nubaria canal at west, the Nile Valley opens out into triangular alluvial Delta has a base of (245 km) at the Mediterranean Sea as illustrated in Figure 2. Nile delta has two branches, the first branch is Damietta branch with a length of 240 km and the other branch is Rosetta branch with a length of 235 km. The thickness of Nile Delta aquifer decrease from 1000 m in the North directions at the Mediterranean Sea to reach about 200 m near Cairo city in the South [9]. The depth of groundwater level in the Nile Delta aquifer decreases from the South towards the North. It differs between 1 and 2 m in the North, increasing to vary from 3 to 4 m in the middle part and reaches the maximum value which is 5 m in the South [10,11].

Figure 2. Nile Delta aquifer, Egypt [19].
Hydrogeology of the Nile Delta Aquifer
The Nile Delta aquifer consists of the following major hydrogeological units; Aquitard Quaternary aquifer, Aquiclude. Aquitard is the top strata of the deltaic deposits is a forming associated with the Holocene time (10,000 years). This forming is made of a semi-pervious clay and silt aquitard. It considers the main Quaternary aquifers cap. It is mainly anisotropic and heterogeneous. This unit generally composed of sandy clay, Nile silt, clayey sand, infrequently with fine sand intercalations [12]. The hydraulic conductivity at the vertical direction of the clay cap is 2.5 mm/day, and the hydraulic conductivity at the horizontal direction varies between 50 and 500 mm/day [13]. The thickness of clay cap of the Nile Delta aquifer differs from 40 m in the North, middle and West Delta regions and increasing to 95 m at the East of the delta coast of and descends till it disappears at the aquifer borders [14].
Quaternary aquifer is the main part of the aquifer. It is a massive unit related with Pleistocene era and contains gravel and coarse sand with an amount of clay lenses intercalations. It is under the Holocene top clay layer and above the lower Neocene impervious clay. This strata thickness enhances Northward. It varies from about 150 m. at El-Quanater El-Khairiya in the South part to more than 500 m. next to Tanta Advancing Northward till reaching about 1000 m near the coast of Mediterranean sea. The hydraulic conductivity of the Nile Delta Aquifer is relatively high and varies between 70 and 100 m/d [15]. The slope of this aquifer at its base is about 400 cm/km. This unit forms the main groundwater aquifer in the Nile Delta region, which is treated as a leaky (semi-confined) aquifer in most region of Nile Delta where the aquifer is covered with clay cap. Unconfined (phreatic) groundwater aquifer is found in the fringes of the Nile Delta where the clay cap are no exist above quaternary sediments.
Numerical modeling of Nile Delta Aquifer
MODFLOW code is designed to describe and predict the behavior of groundwater system. This model employed Finite Difference techniques to simulate the hydrodynamic of the groundwater flow under non-equilibrium conditions in a heterogeneous and anisotropic medium. MT3DMS can be used to simulate changes in concentrations of miscible contaminants in groundwater considering advection, dispersion, diffusion and some basic chemical reactions, with various types of boundary conditions and external sources or sinks. MT3DMS is designed for use with any block-centered finitedifference flow model, such as the modular finite-difference groundwater flow model. It simulates solute transport by using the calculated hydraulic heads and various flow terms saved by MODFLOW. SEWAT 2000 is the most recent version of SEWAT computer program for simulation of 3-D, variable density transient ground water flow in porous media. SEWAT 2000 was designed by merging MODFLOW 2000 and MT3DMS in one program. SEWAT 2000 involve all of the processes existed in MODFLOW program in addition to the variable density flow process and integrated MT3DMS transport process. The solute transport of contaminant in ground water flow represented by partial – differential equation as follow:
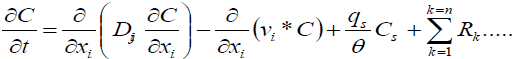 ……[Equation 1]
C contaminant concentration which is dissolved in ground water, 
T Time (T)
X the distance along the specific Cartesian coordinate axis (L)
Di j the coefficient of the hydrodynamic dispersion (L2 T-1)
qs the volumetric flux of water per unit volume of aquifer, source is represented as (positive) and sink represented as negative
Cs CConcentration of sink or source, ML-3
θ Porous media porosity, (-)
R k the term of chemical reaction, (ML-3 T-1)
Preparing the numerical model by converting the conceptual model of the aquifer system to a numerical model which represents the physical systems utilizing mathematical equations based on certain simplifying assumptions. These assumptions, typically, involve the geometry of the aquifer, and its properties (hydraulic conductivity, storage coefficient, initial head, etc.), boundary condition (recharge, constant head, constant concentration, etc.). Results of this process are generated in terms of groundwater head and budgets. Because aquifers are heterogeneous and have complex boundary conditions, exact analytical solutions to the governing equations cannot be obtained directly. Instead, numerical methods are used, in which the continuous variables of the governing equations are replaced with discrete variables that are defined at grid blocks (or cells or nodes). Thus, the continuous differential equation, which defines hydraulic head or solute concentration everywhere in the system, is replaced by a finite number of algebraic equations that defines them at specific points. However, numerical methods yield only approximate solutions to the governing equation; they require discretization of space and time. The variable internal properties, boundaries, and stresses of the system are approximated within the discretized format. In general, the finer the discretization, the closer the numerical solution will be to the true solution.
Hydraulic input parameters
The hydraulic parameters such as hydraulic conductivity(k) which is one of the most important parameters,specific storage (Ss), specific yield (Sy), effective porosity(n) and total porosity was taken as follow in Table 1 and was calibrated through the simulation of the model. The aquifer is recharged by excessive water from irrigation process which is considered the biggest factor in the aquifer recharge as shown in Figure 3 and the leakage of Nile branches and canals and drainage system and rainfall. The total value of discharge equal 2.78*109 m3/year in 2008 as reported by Morsy WS [11]. Figure 4 shows the map of abstraction wells distribution in the study area. The longitudinal dispersivity value α Į equal 100m, the value of the transverse dispersivity αT equal 10 m, the vertical dispersivity αν value equal 1m and the diffusion coefficient value equal 10-4 m2/day [17].
| Main hydraulic units | Hydraulic Conductivity |
Transmissivity | Storage | Specific yield | Total porosity | Effective Porosity |
|---|---|---|---|---|---|---|
| K | T | S | Sy | n | nef | |
| m/day | (m 2 /day) | (m/day) | (1/m) | % | % | |
| RIGW(1992) | 75 | 15000-75000 | 10-4 - 10-3 | ………… | 25-40 | ……….. |
| Farid(1980) | 112 | ……………….. | 2.35*10-3 | ………… | 40 | 37.35 |
| Zaghloul(1958) | 119 | ……………….. | 10-4 - 10-3 | 0.15 | 30 | |
| Shahin(1981) | 50 | 25000-25900 | 10-5 - 10-4 | 0.2 | 25 | 23.25 |
| Leaven(1991) | 150 | 10350-59800 | ……………. | …………. | 25-30 | ………… |
| Bahr(1995) | 75 | ………………. | 1.1*10-3 | …………. | 25 | 18 |
| (Sefelnasr et al .2021) | 70-100 | ………………. | ||||
| RIGW(2011) | 50 | |||||

Figure 3. Distribution of drainage surplus in the Nile Delta region in 2008 [11].

Figure 4. Location map of abstraction wells [7].
Model discretization
The study area of the simulated model is about 40,800 km2 along a distance of 170 km in the North -South direction and 240 km in the East-West direction. The model is divided into 240 columns and 170 rows for all active and inactive cells. The cell dimensions is 1.00 km *1.00 km. Figure 5 reveal the horizontal cross section of the aquifer. The vertical thickness of the aquifer varies from 200 m in South near Cairo and 1000 m in North at the Mediterranean sea. The vertical thickness is divided into eleven layers, the first layer represents the clay cap of the aquifer with an average depth 50 m, the layers from two to eleven represent the quaternary aquifer. Figure 6a reveals the vertical cross section in Y direction from North to South. Figure 6b reveals the vertical cross section in X direction from east to west.

Figure 5. Discretization of Nile Delta Aquifer.

Figure 6a. Vertical Cross Sections in the Nile Delta Aquifer Model Sec (1-1).

Figure 6b. Vertical Cross Sections in the Nile Delta Aquifer Model Sec (2-2)
Boundary and initial conditions
The coastal boundary along the Mediterranean Sea is represented by constant head which is taken as zero and constant concentration which is taken as 40,000 mg/L. The head and salinity concentration don’t change over time. The Southern boundary near Cairo is represented by constant head which is taken as 16.96 m, the constant head backs to the presence of Delta barrage. The eastern boundary along the red sea and Suez canal is represented by constant concentration which equal 35,000 mg/l. Ismailia canal at the South east boundary (starting head=18.5 m, Ending head=7.6 m), Nubaria canal and Rayah Nassri at the west boundary (starting head=18.3 m, ending head=2.92 m) form a natural controlled head boundary. The Nile branches also act as controlled head boundary. Figure 7 shows the boundary conditions of Nile delta.

Figure 7. Boundary conditions of Nile Delta region [19].
Calibration of groundwater level model
While the calibration process, it took many times to run the model for getting the minimum difference between the simulated head by the model and the measured hydraulic head by RIGW in 2008. A sixty observation wells which are distributed in the study area have been selected for the process of calibration until the RMSE between the simulated head and measured head by RIGW in 2008 and simulated hydraulic head level became 0.42 [18-20]. The ratio between the vertical and horizontal hydraulic conductivity was 1:10. Figure 8 shows the calibrated values of the vertical hydraulic conductivity of the first layer varied between 0.00365 and 0.024m/day. Figure 9 shows the values of the calibrated horizontal hydraulic conductivity of the layers from 2-11 varied from 40 to 243 m/day. Figures 10a-b presents the simulated and observed groundwater levels. The relation between the simulated and observed groundwater levels for 60 records from different observation wells by RIGW in 2008. The RMSE and the correlation factor R2 between the simulated and observed groundwater levels were, 0.42 and 0.9925 respectively, as shown in Figure 11

Figure 8. Calibrated vertical hydraulic conductivity of the first layer.

Figure 9. Calibrated horizontal hydraulic conductivity of quaternary aquifer.

Figure 10a. Simulated ground water head in the Nile Delta Aquifer.

Figure 10b. Groundwater head in the Nile Delta aquifer 2008 [11].

Figure 11. Relationships between observed and simulated groundwater levels.
Model output and calibration of the groundwater salinity model
The model was applied with available data of 2008 and this case considered the base case. Salt water intrusion distributions are the important output of transport model. Figure 12 illustrates the distributions of TDS at layer 9 with average depth 675 m at North and 150 mat South. Figure 13 shows the distribution of TDS at layer 11 (at the bottom of the aquifer) with average depth 1000 m at North and 200 at South. Three cross sections are taken in the Nile delta cross section 1 at west, cross section 2 at middle and cross section 3 at east. At cross section 1, the equiconcentration line 35,0 which expresses salt water,advanced inland to a distance of 40 km from the shore line, measured at the base of the aquifer (at layer 11), the equiconcentration line 1 which characterizes fresh water from salt water, advanced in land to a distance of 68.5 km measured at the base of the aquifer and the dispersion zone has a width of 28.5 km as shown in Figure 14a. At cross section 2, the equiconcentration line 35,0 advanced inland to a distance of 43 km from the shore line, measured at the bottom of the aquifer, the equiconcentration line 1,0 advanced inland to a distance of 93 km, measured at the bottom of the aquifer and the dispersion zone has a width of 50 km as shown in Figure 14b. At cross section 3 the equiconcentration line 35,0 advanced inland to a distance of 50 km from the shore line, measured at the bottom of the aquifer, the equiconcentration line 1,0 advanced inland to a distance of 81 km and the dispersion zone has a width of 31 km as shown in Figure 14c.

Figure 12. Horizontal Distribution of TDS in Nile Delta Aquifer at layer [9]

Figure 13. Horizontal Distribution of TDS in Nile Delta Aquifer at layer [11].

Figure 14a.Vertical distribution of salt concentration in the Nile Delta aquifer for base case at cross sections 1 (West).

Figure 14b.Vertical distribution of salt concentration in the Nile Delta aquifer for base case at cross sections 2 (Middle).

Figure 14c.Vertical distribution of salt concentration in the Nile Delta aquifer for base case at cross sections 3 (East).
A calibration process was made between simulated ground water salinity and resulted ground water salinity of recent studies. The calibration based on the advancement of equiconcentration line 35, 0 and equiconcentration line 1, 0 inland in the base case. The calibration showed a good relevant between simulated and results of recent studies as shown in Table 2 and Figures 15a-c.
| Study | This study | (2) | (7) | (18) | (20) | |
|---|---|---|---|---|---|---|
| Position | Line | |||||
| West | Equi-line 35 | 40 km | 37 km | 48 km | 40 km | 23 km |
| Equi-line 1 | 68.5 km | 66 km | 72.5 km | 66 km | 53 km | |
| Middle | Equi-line 35 | 43 km | 43 km | 63.75 | 56 km | 43.5 km |
| Equi-line 1 | 93 km | 75 km | 93.75 | 105 km | 68 km | |
| East | Equi-line 35 | 50 km | 50 km | 76.25 | 75 km | 33.5 km |
| Equi-line 1 | 81 km | 86 km | 90.75 | 100 km | 78 km | |

Figure 15a. Simulated ground water salinity .

Figure 15b. Observed ground water salinity [2].

Figure 15c. Observed ground water salinity [7].
An investigation of the creep of salt water in Nile delta aquifer over the last 60 years is conducted. The equiconcentration line 1, 0 of this study (2022) was compared with the equiconcentration line 1, 0 of the following years 1960, 1980 and 1992 which were taken from [11]. The Results showed that The equiconcentration line 1.0 advanced inland a distance of 55 km, 59 km,44 km and 68.5 km from the shore line at west,72.5km, 70 km, 65 km and 93 km at middle, 83.5km, 90 km, 93 km,and 81 km at east for the years 1960,1980,1992,and 2022 respectively. It is clear that the creep of salt water increases at west and middle, but decreases at east of Nile delta as shown in Figure 16.

Figure 16. Salinity (TDS) in groundwater during the periods 1960, 1980, 1992 and 2022.
The main objective of this study is to investigate the intrusion of fresh water/sea water and migration of salt water inland. A lot of activities has been established in order to complete the requirements of this study. ARC. GIS, visual MODFLOW and SEWAT were used. The head of 2008 was used versus the simulated head to calibrate the model. Parameters such as hydraulic conductivity, recharge and dispersivity are modified during the calibration of the model. The results showed that a large area of the Nile delta aquifer is polluted by saline water in base case without any external factors such as sea level rise, increasing abstraction from wells and decreasing the amount of recharge. The creep of salt water occurs at a large scale in west and middle counter to east where the creep is more slower in compared with years 1960, 1980 and 1992. That is due to the high recharge of drainage surplus at east compared to rest of the study area as shown in Figure 3.
Google Scholar, Crossref, Indexed at
Google Scholar, Crossref, Indexed at
Google Scholar, Crossref, Indexed at
Google Scholar, Crossref, Indexed at
Google Scholar, Crossref, Indexed at
Google Scholar, Crossref, Indexed at
Google Scholar, Crossref, Indexed at
Google Scholar, Crossref, Indexed at
Google Scholar, Crossref, Indexed at
Google Scholar, Crossref, Indexed at
Google Scholar, Crossref, Indexed at
Google Scholar, Crossref, Indexed at
Google Scholar, Crossref, Indexed at
Google Scholar, Crossref, Indexed at
Google Scholar, Crossref, Indexed at
Google Scholar, Crossref, Indexed at
Google Scholar, Crossref, Indexed at
Google Scholar, Crossref, Indexed at
Hydrology: Current Research received 2843 citations as per Google Scholar report