Research Article - (2021) Volume 12, Issue 8
Received: 19-Jul-2021
Published:
09-Aug-2021
, DOI: 10.37421/2155-9619.21.12.446
Citation: Rilwan, U, Sabiu L.K, Umar I and S.D. Yusuf, et al."Assessment of Radiation Dose in Computed Tomography Examination of Adult Patient in Abuja and Keffi, Hospitals in Nigerian". J Nucl Med Radiat Ther 12 (2021): 446.
Copyright: © 2021 Usman R, et al. This is an open-access article distributed under the terms of the Creative Commons Attribution License, which permits unrestricted use, distribution, and reproduction in any medium, provided the original author and source are credited.
Assessment of Radiation dose in computed tomography examination of Adult patient in Abuja and Keffi, Hospitals in Nigerian was carried out. The three study centers are National hospital Abuja, Garki hospital and federal Medical Centre Keffi, Nasarawa State. CT scan is considered to be the first investigative modality of choice for patient with severe head, chest and abdominal injuries. For us to achieve this, professionals must adhere to the principles of justification of practice and optimization of radiation protection. Dose report and scan parameters for head, chest and abdomen were assessed during seven months period at the three study centres. Ethical approval was obtained from the study centers. Data on CT Dose index (CTDI w) and dose length product (DLP) available and achieved on CT scanner control console was recorded for a minimum of 10 average sized patients for each facility to established a local Diagnostic reference level (LDRLs) and radiation dose optimization Data were collected, using a purposive sampling technique, from 131 adult patients weighing 70 ± 3 kg) from Philip brilliance, Toshiba Alexion and General Electric (GE) CT scanners for the study. The collected data were analyzed using SPPSS version (20) statistical software. Third quartile values of the estimated LDRLs for CTDI w and DLP were determined as (49.8 mGy and 9639 mGy) and (10.9 mGy and 432.8 mCy*cm) and (12.7 mGy and 560 mGy*cm) for head, chest and abdominal CT scan, respectively. This study has established local diagnostic reference levels (LDRLs). And the CTDI w obtained are almost relatively higher to the reported data from the European Commission (Head: 10 mGy, Chest: 10 mGy and Abdomen 12.7 mGy). The DLP are comparably lower than all the reported value from the European commission (Head: 1000mGy, Chest: 600 mGy and Abdomen: 800 mGy). Therefore, CT dose optimization is recommended.
Radiation dose • MSCT• VGA • CTDI v • CTDI w • DLP • LDRL.
Computed Tomography (CT) is the largest source of exposure to ionizing radiation in medicine, contributing approximately 30% of the radiation dose to the population in the United States. In 2010 an estimated note 80 million CT scans were performed, with the use of CT increasing (Milwauke, Wisconsine May 2012) this is due in part to the larger head, chest, abdominal and areas to be covered in the examination as well as the presence of many radiation sensitive tissue or organs. Additionally, a routine CT examination normally involves pre- and post- contrast media series which increases the irradiated volume by a factor of more than one [1]. Computed tomography (CT) was introduced into clinical practice in 1972 and had revolutionized x-ray image by providing high quality images which reproduced transverse cross sections. The technique offered improved low contrast resolution for better visualization of soft tissue, with relatively high in absorbed radiation dose. The initial potential of the imaging modality has been realized by paid technological developments, resulting in the continuing expansion of CT practices. As a result, the numbers of examinations are increasing; to the extent that CT has made a substantial impact on not only patients care but also patients and population exposure from medical x-rays. Today, it accounts for up to 40% of the resultant collective does from diagnostic radiology in some countries of the European Union (EU). Special measures are consequently required to ensure optimization of performance in CT, and of parent’s protection [2].
Materials
The materials requirements for the conduct of this research were included;
i. Computer tomography scanner machines located at the study centers.
ii. Data Collection Sheet
iii. SPSS version (20) software for data analysis
iv. Ethical clearance from the participated hospital that allowed this research to be conducted.
Study area
Federal Capital Territory (FCT) Abuja: Abuja is planned city, research have it that it was built in 1980s, its shares boundary with Kogi, Kaduna, Niger and Nasarawa, it is in the central region of the country which is one of the reason it was chosen as the federal capital territory. According to the United Nation (UN) Abuja is one of the fastest growing city in the word and the fastest growing city in African continent, it grew by 139.7% between the year 2000-2010. Abuja occupies a land area of 7,753.9 sqkm while other sources are of the view it occupies, 8,000 sqkm. It is a highly populated state with over three million people in its unofficial metropolitan area, making it the fourth largest metropolitan area in Nigeria, surpassed by Lagos, Kano and Ibadan. In the year 2016 the metropolitan area of Abuja is estimated at 6 million persons. Abuja vegetation is mainly savannah with limited forest areas. They produce crops like Yam, beans, maize, millet and sorghum. Its minerals resources includes Mable, iron, ore felt pare, gold and tank. The indigenous inhabitants of the state comprises the Gbagi, Koro, Gwandara, Ganagana, Afo and Bassa ethnic groups, primary dairy farmers, Hausa and Fulani also lived in the territory (Figure 1).

Figure 1. Map of Federal capital Territory (FCT) Abuja, Showing the Study Area.
Keffi town, Nasarawa State, Central Nigeria: It was founded about 1800 by Abdu Zanga (Abdullahi) a Fulani warrior from the north who made it the seat of vassal emirate subject to the emir of Zaria (a town 153 miles (246 km north). Although, Keffi paid tribute to Zaria through the 19th century. It was constantly raided for salves; its war in the reign of Sidi Umaru (1877-94) with the nearby town of Nasarawa resulted in a further payment of slaves to Zaria.
Most of the inhabitants of the traditional emirates are Gwandara people engaged in tin and columbite and mining and farming, the chief crops are millet, sorghum, yams and cotton. Keffi town has university, school of health technology, teachers college etc. Keffi town is located just west of junction of Local roads that given it access to Abuja, Nasarawa, the trunk high to Akwanga and the main railway at Lafia.
Keffi town has a population of 92,664 according to census (Figure 2).
Methods

Figure 2. Map of Keffi Showing the Study Area.
The study adopted a retrospective and quantitative design to determine the absorbed radiation dose to patient undergoing CT scan of the head, chest and abdomen. A quantitative design was appropriate because the study involved the uses of numerical data, was conducted retrospectively to ensure more reliable and valid data [3], and acquired from the computer archive system, where the dose report and exposure parameters are stored.
Study population: The study consisted of all adult patients that attended for CT scans examinations of head, chest and abdomen.
Methods of data collection: The data was collected by me with the assistant of the CT radiographers who are well trained on how to collect the data. The data collection sheet used for the study was adopted from the IAEA, survey from (Appendix A) and has the following sections: participant demographic information, scan parameters and dose parameters.
Sample size: A simple size (60) participant patient was recruited for head CT head in the study. This was obtained through selection of 20 participants each that come for CT examination of the head in center A, B and C respectively.
In chest CT examination, a simple size of participant was used in the study. This was obtained through selection of 16 participants from center A and 10 participants from center C while center B has zero participants. In the abdominal CT examination, a total of (45) participant was used in the study. This was obtained through selection of 15 participants from center A, 20 participants from center B and 10 participants from center C respectively using a purposive method of sampling [4]. The variation in the number of sample size occurred because of the limitation of the participated patients in the study centers. Therefore, purposive sampling technique was considered as the most appropriate as standard-sized patients are essential to the design [5].
Based on the recommendation guideline for sample recruitment made by the European commission which says a minimum of 10 participants shall be recruited for each body part under examination. Furthermore, the larger a sample, the more representative it will be of the population from which it has been taken [4]. All patients that met the inclusion criteria and agreed to participate in the study were weighed, and were within the weight limits of standard size patient which is 70 ± 3 kg for the European population. The European weight limit was adopted to make comparison with published values easier because a standard-size patient for Nigeria population could not be found in the literature.
Inclusion criteria
i. Only adult patients weighing in the range of 67 to 73 kg were included in the study [2].
ii. Only adult patients that attended for routine CT scans of brain, chest and abdominal CT scan examination was considered.
iii. Data was acquired on a CT scanner that was calibrated by the Nigeria Nuclear Regulatory Authority (NNRA).
Exclusion criteria
i. Patient that attended for non-routine CT procedure such as CT angiography, CT colonography.
ii. Patients with weight above or below the specified limit [6].
iii. CT scanner that was not calibrated by the Nigeria Nuclear Regulatory Authority (NNRA).
Data analysis
The data obtained were saved on an excel spread sheet (appendix J, K & L). The data contained the followings: the demographic information (age, gender and weight). The scan parameters (KV, MA, MAS, Rotation time, Pitch and scanning range) and dose parameters (CTDI & DLP). The data were analyzed to provide answers to the research problems itemized in chapter one, two statistical methods were employed for the data namely: descriptive and inferential analysis. The descriptive analysis was employed to summaries the data for this study they are used to give a descriptive of the data by the determining the measures of location (mean, median and mode) and to express its variability (range, standard deviation and standard error). Inferential statistical analysis was employed to measure the significance (whether any difference between two samples is due to chance or a real effect of a test result). It is represented using P values. Data was analysis using statistical packet social sciences (SPSS) version 22 software. The mean standard deviation and third quartile value at 95% confidence interval was used. Comparison was made between the measured doses and reported data from the European countries where there are established DRLs. Statistically significant results of dose values between CT centers were determined using chi-square and student t-test at 0.05 level of significance [4].
CT Dose measurement parameters
Multiple Scan Average Dose (MSAD): MSAD is the average radiation dose over the central scan of a CT procedure consisting of multiple parallel scan. The MSAD describes the average patient dose only if the scan protocol uses more than just a few parallel scans. Like the CTDI, the MSAD requires thermoluminescent dosimeters for measurement and is rarely performed [6].
According to Morin [6], the MSAD for non-spiral scans can be estimated from the CTDI in the equation below:
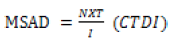 ...............(1)
Where N is the number of scans, T is the nominal scan with (mm), and I am the distance between scans (mm). For MSCT system, N X T is the total nominal scan width, and I correspond to the patient table movement during 1 gantry rotation. Therefore, given the definition of pitch as the table movement per gantry rotation to be collimated. According to the work of Karthikeyan & Chegu, the MSAD for spiral scans can be expressed as:
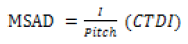 ............(2)
CTDIVol
Volume computed Tomography Dose Index (CTDIVol) is expressed as the average dose delivered to the scan volume for a specific examination. It is delivered from the CTDI. CTDIVol is also considered as a new radiation dose parameter agreed by the International Electrochemical Commission [7].
According to Morin et al, (2003) CTDIVol for single-Slice scanners is defined as:
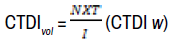 ................(3)
When N is the number of scans, T is the nominal scan width (mm) and I is the distance between  scans (AAPS). Also, CTDIvol for MSCT is defined as:
CTDIvol = (CTDI w) ...........(4)
The CTDIVol is now the preferred expression of radiation dose in CT dosimetry and is considered more useful in comparing radiation dose to critical organs such as the thyroid and lens for CT examination of neck [8].
Effective Dose
Effective dose quantities the risk from partial body exposure to that form an equivalent whole body exposure. The term is used to take into account the type of radiation and the sensitivity to tissues to ionizing radiation [9]. In CT, according to Ling (2009), the effective dose is expressed as:
E = EDLPX DLP ........(5)
Where E = Effective dose
EDLP = Normalized effective dose
DLP = Dose Length product
Data Capture Sheet
The data collection sheet used was adopted from the IAEA document [3], and it had been tested in other countries like Canada, Greece and India where similar studies had been conducted [4]. The recorded data were thoroughly checked (i.e. data were entered into an excel spread sheet). Each entry was then checked by the researched to ensure that no mistakes were made during data capture) by the researcher before entered in the software for processing (Table 1) [6].
| Exams | Head | Chest | Abdomen | |||||||||||||||
| Parameter | ||||||||||||||||||
| A | B | C | A | B | C | A | B | C | ||||||||||
| Age (years) | 57.5 ± 10.7 | 55.3 ± 11.5 | 60.3 ± 14.3 | 54.0 ± 11.5 | NA | 60.8 ± 11.7 | 49.3 ± 12.7 | 50.3 ± 11.3 | 50.3 ± 9.6 | |||||||||
| Weight (Kg) | 64.4 ± 15.9 | 77.2 ± 25.0 | 62.4 ± 16.1 | 75.4 ± 19.5 | 63.3 ± 5.4 | NA | 71.6 ± 20.9 | 81.7 ± 27.6 | 52.6 ± 11.6 | |||||||||
| kV | 120 | 120 | 120 | 120 | NA | 100 | 120 | 100 | 120 | |||||||||
| mA | NR | NR | 237.7 ± 29.6 | NR | NA | 108.2 ± 38.1 | NR | NR | 268.9 ± 113.5 | |||||||||
| mAs | 324.2 ± 75.7 | 152.5 ± 10.9 | 237.7 ± 29.6 | 153.3 ± 12.5 | NA | NR | 212.5 ± 9.7 | 76.9 ± 43.0 | NR | |||||||||
| Scan Range | 198.2 ± 42.5 | 174.1 ± 16.1 | 121.3 ± 14.9 | 362.7 ± 38.6 | NA | 342 ± 35.6 | 418.3 ± 18.8 | 433.0 ± 63.0 | 385.9 ± 35.5 | |||||||||
| CTDIw (mGy) | 52.5 ± 96 | 49.8 ± 0 | 43.7 ± 3.59 | 10.8 ± 0.87 | NA | 10.7 ± 2.58 | 15.1 ± 0.60 | 7.3 ± 4.67 | 11.7 ± 3.95 | |||||||||
| DLP (mGy*cm) | 1098.0 ± 475.12 | 1003.1 ± 77.37 | 820.1 ± 173.32 | 431.0 ± 91.96 | NA | 442.6 ± 139.81 | 689.6 ± 43.98 | 356.7 ± 248.15 | 491.7 ± 134.77 | |||||||||
| Mean CTDI (mGy) | 48.7 ± 3.91 | 10.8 ± 1.8 | 11.0 ± 3.6 | |||||||||||||||
| Mean DLP (mGy*cm) | 973.7 ± 295.6 | 435.6 ± 113.6 | 500.9 ± 173.5 | |||||||||||||||
| Scanner | Phillip | Simen | General Electric | Phillip | Simen | General Electric | Phillip | Simen | General Electric | |||||||||
| Model | Brilliance | Alexion | Bright Speed | Brilliance | Alexion | Bright Speed | Brilliance | Alexion | Bright Speed | |||||||||
| Number of Slides | 16 | 32 | 16 | 16 | 32 | 16 | 16 | 32 | 16 | |||||||||
| Manufactured Year | 2008 | 2015 | 2008 | 2008 | 2015 | 2008 | 2008 | 2015 | 2008 | |||||||||
| Installed Year | 2009 | 2015 | 2014 | 2009 | 2015 | 2014 | 2009 | 2015 | 2014 | |||||||||
| Number of Male | 12 | 13 | 13 | 5 | NA | 5 | 6 | 6 | 6 | |||||||||
| Number of Female | 8 | 7 | 7 | 10 | NA | 5 | 10 | 14 | 9 | |||||||||
| Total | 20 | 20 | 20 | 15 | NA | 10 | 16 | 20 | 15 | |||||||||
In order to analyze the results obtained and presented in Table 1, charts were plotted and comparison was made with European Commission for all the CT Dose Measurement Parameters (Figures 3-8).

Figure 3. Comparison of Head CT scan parameters between the Study Centres.

Figure 4. Comparison of Chest CT scan parameters between the Study Centres.

Figure 5. Comparison of Abdominal CT scan parameters between the Study Centres.

Figure 6. Mean head CTDIw (mGy) and DLP (mGy*cm) from the study centre.

Figure 7. Mean Chest CTDIw (mGy) and DLP (mGy*cm) from the study centres.

Figure 8. Mean Abdomen CTDIw (mGy) and DLP (mGy*cm) from the study centres.
From the result obtained above, Brain CT at centre (A) has the higher CTDI w, value followed by centre (B) and (C) with 52 May, 49 May and 43 May respectively. Meanwhile, the highest DLP values were noted at centre (A) then Centre (B) and (C) as 1089 mGy*cm, 100mGy*cm and 820 Gy*cm respectively. For the chest CT, centre (A) and (C) almost have the same CTDI w values as 10mGy and May but the DLP in centre (C) was slightly higher than centre (A) with 431 Gy*cm and 442 Gy*cm respectively, centre (B) has no available data for both CTDI w and DLP values during the study period. In abdominal CT, Centre (A) has higher CTDI w value, follows by centre (C) then centre (B) with 15 May, 11 May and 7 May respectively. Then Centre (A) happened to be highest in terms of DLP values followed by centre (C) and (B) with 689 Gy*cm and 356 Gy*cm respectively. The reason for high CTDI w and DLP values in centre (A) is because of the high KV and MAS used during the CT procedure. And the scan parameters and the protocol used were the main contributors to this higher output particularly, the tube current and the tube potentials (Figure 9-10).

Figure 9. Established DRLs in terms of CTDIw(mGy) values.

Figure 10. Established DRLs in terms of DLP(mGy*cm) values.
Comparison of DRLs in terms of CTDI with the international
The comparison of the new DRLs obtained with the established reference levels from the European countries as well as other countries is presented from Tables 2 and 3. This would determine the possibility of radiation dose variance between the CT scanners and show the causes of that radiation dose variation in CT procedures (Figures 11-16).
| Region | This study 2017 | European commission | Portugal | Australia |
| Author | European Union, | Santos et al., | Arpansa | |
| 2014 | 2014 | 2013 | ||
| Head | 49.8 | 10 | 75 | 47 |
| Chest | 10.9 | 10 | 14 | 9.5 |
| Abdomen | 12.7 | 35 | 18 | 10.9 |
| Region | This study 2017 | European commission | Portugal | Australia |
| Author | European Union, | Santos et al., | Arpansa | |
| 2014 | 2014 | 2013 | ||
| Head | 963 | 1000 | 1010 | 527 |
| Chest | 432.8 | 600 | 470 | 447 |
| Abdomen | 560 | 800 | 800 | 696 |

Figure 11. Comparison of head DRLs in terms of CTDIw (mGy) with internationals values.

Figure 12. Comparison of Chest DRLs in terms of CTDIw (mGy) with internationals values.

Figure 13. Comparison of Abdomen DRLs in terms of CTDIw (mGy) with internationals values.

Figure 14. Comparison of head DRLs in terms of DLP (mGy*cm) with internationals values.

Figure 15. Comparison of Chest DRLs in terms of DLP (mGy*cm) with internationals values.

Figure 16. Comparison of Abdomen DRLs in terms of DLP (mGy*cm) with internationals values.
This study determined the CTDI w and DLP for adult pertinent undergoing routine, brain chest and abdominal CT scan in three Nigerian hospitals one located in Keffi, Nasarawa State while the other two are located in Abuja Federal Capital territory (FCT). Potential Local diagnostic reference levels were established. Moreover factors, responsible for CTDI w and DLP variation between scanners are investigated and discussed in this chapter. The international commission on Radiological Protection (ICRP) and European Union Directives adopted a concept known s Diagnostic reference level (DRL) in order to investigate incidences where patient dose during a radiological is usually high and in urgent need of reduction. The DRLs help to avoid excessive radiation dose to patients and population and that does not contribute to the clinical purpose of medical imaging tac. As such, in recent years it has become an important entity in the management of radiation doses delivered to the patient in diagnostic and interventional radiology. International, regional and national bodies have shown a keen interest in DRLs. Previous studies have reported different dose value in CT imaging due to the variations in applied scan protocols and this limits comparison between studies [10]. The findings of the present study also showed that the use of different scan parameters such as KV, MA, MAS, scanning range, pitch and scan time, being employed at different centres result in different CTDI and DLP values for the same procedure (Table 3). The measured CTDI w and DLP value for all the centres in this study were found to be different (Table 3 and comparably the head and lower in centre (B) and (C) but lower compare to values reported in European. For chest CT, the CTDI w values were the same from centre (A) and (C) were also the scan with the value reported from European (Karim et al., 2016). The CTDI w values of abdomen were found to be lower in all centers than the reported values from European. Measured DLP values for all the centers in this study were also found to be different and by comparison the DLP values for head is higher at centre (A), (B) and (C) and they were all higher than the values reported in the Europe [11]. The chest DLP values were lower than the reported values in Europe likewise, abdomen shows lover DLP values in center (A), (B) and (C) respectively. Compare to the reported values in the Europe [12]. This is because of the different scan parameters employed at each center, and the fact that, the dose optimization strategies were not being observed. Moreover, the scan parameters (exposure factors) are almost the same for adults, head, chest and abdominal CT a particular center. Irrespective of the patient characteristics (age and weight) of the adult protocol does not change. Moreover, it has also been observed that setting of scan parameters such as the MA, MAs, KV, tube rotation time, pitch collimation and scanning range is a major contributor to the patient dose received during a CT scan procedure. It has been recommended that the DRLs should be set at the level of the third quartile in the dose distribution of the measured CTDI w per series and DLP per examination. The third quartile value is chosen as an appropriate investigation level on the grounds that if 75% of the CT units can operate satisfactory below this dose level, then the remaining 25% should be made aware of their considerably. Less than optimal performance operators of units should be encouraged to adjust their radiographic protocols by lowering the KV, MA and MAs or increasing the slice thickness to bring their dose in line with 75% majority. DRLs should be established using routine examinations [13]. Therefore, this study considered only those scans dose on axial and helical mode as this is the routine protocol at the study site.
Diagnostic reference level was primarily introduced to avoid situations of high patient absorbed radiation dose. Furthermore, the CTDI’s and DRL’s should not be exceeded when departments operate under normal diagnostic and technical practices. The aim of this study was to establish a Local Diagnostic Reference Level for routine head, chest and abdomen CT scan in three Nigerian hospitals for the purpose of dose optimization. The CTDI and DLP evaluation was done following EC guidelines. However, variation of CTDI w and DLP for the same procedure was observed from one centre to another. This is due to the application of different scan protocols at each of the centres. The reason the CTDIw with higher than in other studies is due to a high tube current and tube current-time product being employed. However, the CTDI and the DLP in most of the study centres are within or below the values in the European Commission Report.
Although the CTDI w obtained is relatively similar to the reported data in the literature, and the DLP values is comparably higher than all of the reported data as compared with published results from other countries, these are the recommended initial Local Diagnostic Reference Levels (LDRLs) for three centers. Also, variation between CT scan centers was noted. It is therefore recommended that the tube current and tube current-time product be investigated and reduced where possible in order to reduce the absorbed radiation dose, and the protocol for head, chest and abdomen CT is harmonized across all CT centers in Nigeria. The final recommendation is that an audit should be conducted in two (2) or more years’ time to establish revised LDRLs that should be conducted in two (2) years’ time to establish revised LDRLs that should be equal or similar to the internationally established DRLs. A need for means to assess image quality in CT was seen, in order to measure the performance of the CT scanners in an objective way. Simpler method for local assessment of image quality and dose might also contribute to the optimization of examination practices. There is needs to conduct a research to determine whether the displayed Computed Tomography Dose Index (CTDI) and the Dose Length Product (DLP) values from CT console are accurate or not. And also, determine the effective does for patients undergoing these common CT examinations.
Nuclear Medicine & Radiation Therapy received 706 citations as per Google Scholar report