Research Article - (2025) Volume 16, Issue 2
Received: 07-Oct-2024, Manuscript No. JBMBS-24-149728;
Editor assigned: 10-Oct-2024, Pre QC No. JBMBS-24-149728 (PQ);
Reviewed: 25-Oct-2024, QC No. JBMBS-24-149728;
Revised: 21-Apr-2025, Manuscript No. JBMBS-24-149728 (R);
Published:
28-Apr-2025
, DOI: 10.37421/2155-6180.2025.16.261
Citation: Tegegne, Awoke Seyoum, Aschalew Dgoma, Shambel Molla, and Tizita Lemma, et al. "Assessment of Education Quality Culture in Bahir Dar University, Ethiopia." J Biom Biostat 16 (2025): 261.
Copyright: © 2025 Tegegne AS, et al. This is an open-access article distributed under the terms of the creative commons attribution license which permits unrestricted use, distribution and reproduction in any medium, provided the original author and source are credited.
Background: The organizational context (structure, management, communication), working mechanisms (knowledge, shared ownership, commitment), outcomes of the quality culture (student and staff satisfaction, ongoing improvement of the teaching and learning process), and quality management interventions all interact with each other to create a successful organization. Examining the status of quality culture at Bahir Dar University was the major objective of this study.
Methods: A cross-sectional study design was conducted in current investigation. Data were collected from academic and administrative staffs. The technique of proportional cluster sampling was employed to select samples. As a result, 205 academic staff members, and 420 administrative staff members were proportionally chosen from each academic unit of the university. The t-test, ANOVA, and descriptive statistics were used to analyze the survey data.
Results: The study's findings show that there was no statistical evidence for the above-average existence of a quality culture as perceived by the university’s academic and admin staffs (mean value: 3.01; p-value: 0.551); and, the results further show that quality cultures within university differ from what the university’s vision and mission expected. Hence, there is significance, difference of effective communication, shared value, trust of employees on the system, employees’ attitude about leaders, admin process, infrastructure availability, service quality, change leadership, feeling of responsibility, and work commitment between colleges, facilities, schools and institutes.
Conclusion and recommendation: In order to improve the education quality culture in its system, the university should improve communication, simplify administrative procedures, and increase service delivery. Additionally, it is suggested that individual efforts will not produce the intended results if they cannot be transformed into a team and collaborative commitment to creating synergy. Thus, top leaders at the university should concentrate on developing a system of collaborative teamwork in order to achieve the university's goal of becoming one of the top research universities in Africa.
Quality • Quality culture • Bahir Dar University • Structural formal • Organizational psychological
The terms 'quality,' 'quality assurance,' 'organizational culture,' and 'quality culture' all refer to interdisciplinary constructs that are essential in higher education, engineering, business administration, and the social sciences [1]. All disciplines strive to increase the quality of products, processes, and/or services [2]. Customers' everincreasing expectations for on-going quality improvement in their own standards have fueled this quest for excellence. As a result, every aspect of an organization's process, whether it's service delivery or manufacturing, is linked to quality in some way [3].
Workplace organization, technology, organizational structure, company strategy, and financial decision-making are all inherently linked to quality culture [4]. They increase complexity as a result of its networked and interdependent nature, and as a result, it is frequently reduced to an ordinary cliché that no longer explains anything [5].
Organizational culture is a response to an organization's obstacles and the achievement of its goals [6]. It can be seen in the way members of the organization communicate, as well as in their shared ideas, values, symbols, and rituals. It's comparable to the unstated unspoken communication standards that are never mentioned but that everyone is aware of. One organization's culture is distinct from that of other organizations, and new members must go through an
enculturation process when they join. Organizational culture is not consistent, and subcultures and subgroups within an organization might have cultural patterns that are partially or completely different from others. Although distinct cultural patterns exist inside organizations, it is critical to harmonize them in order to generate a feeling of direction [7]. As a result, communication and engagement inside organizations become critical for harmonizing multiple (sub) cultures and establishing collective commitment.
The organizational setting and cultures are inextricably linked to quality culture. As can be seen from the preceding ideas regarding organizational culture, there is widespread agreement that culture is not something that an organization has or does not have, but rather that it is a part of any organization whether consciously or unconsciously observed [8]. Organizational culture can be fostered and nurtured, but it does not have to be created from the ground up (as marketing slogans of consulting companies sometimes suggest) [9]. However, the distinction between different sorts or kinds of organizational cultures should not be taken too seriously: Defining an organization's quality culture is inextricably linked to examining other "types" of culture, such as management culture, communication culture, and organizational culture [10].
Quality culture is an organizational culture that aims to continuously improve quality and is defined by two distinct elements: On the one hand, a cultural/psychological element of shared values, beliefs, expectations, and commitment to quality, and on the other hand, a structural/managerial element of defined processes that improve quality and aim to coordinate individual efforts [11].
Higher education quality culture is a complex subject, and it has been difficult to build a widely acknowledged method until now. Quality culture, according to the European University Association, is defined as a combination of factors that include common values, beliefs, expectations, and a dedication to quality [12]. Although there are various techniques to conceptualizing quality cultures in industrial settings, the heiQUALITY cultures project's definition and approach to studying quality culture in higher education is the most thorough [13].
One of the primary issues facing today's globally active universities is the deployment of quality instruments and quality management practices. Higher Education Institutions (HEIs) are operating in a more competitive environment, which has resulted in increased quality demands in teaching and research, as well as service and administration [14]. Quality has also become one of the most significant subjects of higher education policy talks in Europe since the beginning of the Bologna process in 1999 [15]. The need of adopting comparable quality assurance criteria and methodologies is underlined in this context [15]. As a result, a plethora of standards (e.g., 'Standards and Guidelines for Quality Assurance in the European Higher Education Area') and instruments (e.g., accreditation, assessment, and audit) have evolved in recent years to aid HEIs in their pursuit of self-sufficient quality assurance and development [16].
Quality assurance arguments served as a springboard for introducing the concept of quality culture [17]. Quality culture emphasizes the need of an organizational-psychological perspective in addition to structural-formal quality assurance techniques, expanding on the somewhat technocratic approach of quality assurance. As a result, the quality culture notion entails a shift in mindset from quality control, responsibility, and regulation to institutional autonomy, credibility, and quality improvement [18]. Whereas academics frequently dispute over the comparability of quality criteria, quality culture may become a concept that they can all identify with, regardless of their discipline [19].
In this sense, Bahir Dar University strives to deliver high-quality education while also conducting research and engaging with the community. The Ethiopian government established the Higher Education Relevance and Quality Agency (HERQA) through the higher education proclamation (Proc. no. 351/2003) to guide and supervise the country's higher education system's quality and relevance [20]. Furthermore, the higher education proclamation (Proc. no. 1152/2019, Article 22) states that every institution must have a reliable internal quality assurance and enhancement system that is responsible for monitoring and improving the quality and relevance of teaching-learning, research, and community engagement activities.
The quality assurance and enhancement directorate (formerly known as the Academic Development and Resource Center (ADRCD) at Bahir Dar University has been updated, and the Total Quality Management (TQM) office has been created. Because the university places a premium on great teaching, research, and community engagement, the TQM office plays a vital role in the university's ambitions to become one of Africa's premier research-intensive universities and Ethiopia's first option by 2030. This means that the TQM Directorate's ultimate goal is to ensure and improve the quality and standards of the university's core functions, primarily through assessing and auditing the quality and relevance of the stated functions' inputs, processes, and outputs. The general objective of the study was to look at how Bahir Dar University practices quality culture in accordance with the hiQUALITY model, and to suggest solutions for implementing it in the university system.
Notwithstanding that at national level and different higher education institutions have due concern regarding quality, the concept is far from being a culture and low efforts are made to make it a system. Bahir Dar University to achieve its vision of becoming one of the ten leading African Research Universities, making quality as the center of its activities is mandatory. In addition, the outcome of this research can help Bahir Dar University to be competent nationally as well as internationally. Other Ethiopian higher education institutions can also use the result of this study as a baseline to further explore their own contexts of quality culture. The community and students as an external stakeholder can also benefit a lot when quality becomes a culture at higher education institutions in Ethiopia.
This quality assurance project has the aim of developing a comprehensive and practical definition of the term ‘quality culture’, and developing a viable and valid quality culture inventory which is able to collect and describe both structural-formal and organizationalpsychological elements. As a result, this research used this model, and the variables used in the model are the focuses of this research project.
Most authors agree that quality assurance is a critical component of quality culture. At the same time, the concept of 'organizational culture is closely linked to the quality culture approach.
A lot of studies have been undertaken to see how academic institutions might develop a quality culture. Almost all of the attempts to date have been based on individual researcher findings, which mean that the universality and the depth of the findings may not be generalizable in any way. In this regard, the findings of two of the most thorough research to date emerge as very complete and authoritative for other similar investigations. Such studies include the heiQUALITY cultures project, which was carried out by three German institutions as mentioned above in the framework and the European University Association study on quality culture at European Universities: A bottom-up approach, which was carried out in 2006. The network research is a good example of the latter investigation. Hence, the main objective of this study was investigating the quality culture status at Bahir Dar University. Putting the concept into context helps us in identifying and proposing relevant techniques and frameworks to establish a long-term quality culture in Bahir Dar University’s system.
Study area and study design
The data for this study were collected from Bahir Dar University, Ethiopia. Bahir Dar University is one of the first generation universities in Ethiopia. The university consists of seven campuses namely Tibebe Giwon, Peda, Selam, Polly, Zenzelima and Yibab Campuses. The university also consists of five collages namely Medicine and health Science, Science, Educational and Behavioral science, Business and Economics, Agricultural and Environmental colleges. The university has seven faculties, two schools, four institutes and two academies. A cross sectional study design was conducted for assessing the quality culture in the university.
Study population and study period
In this study, the study population was all the community of Bahir Dar University which consists of students, academic staffs, leaders at different position and admin staffs. The study includes all teaching and learning activities currently conducting in the university.
Sample size determination formulae
Currently, Bahir Dar University has 2260 academic staffs and 4469 admin staffs. There are different formulae for determination of appropriate sample size when different techniques of sampling are used. Here, we had discussed about the formulae for determining representative sample size when simple random sampling technique is used. Simple random sampling is the most common and the simplest method of sampling. Therefore, it is a method of selecting n units out of a population of size N by giving equal probability to all units.
In this investigation, Cochran’s formula Cochran was used for calculating sample size as population was large. Hence, the sample size that was included under current investigation was 697. Having this for the whole sample, the proportional sample size for academic staff, administrative staff, for each of campuses and academic units was calculated using the formula ni=(Ni/N) × n, i=1,2,3. Hence, a total of 234 from academic staff and 461 from the admin staff were selected randomly to be included under investigation. After determining, the size of the sample from academic and admin staff, systematic random sampling techniques were used based on the id number of each of the two categories.
Source of data and sampling procedure
In this study, the primary data and secondary data sources were used to assess the quality culture of Bahir Dar University. Primary data were collected in formal questionnaires. University leaders (President, Vice Presidents, Directors, Deans, Vice Deans and HOD) and senior staffs were included under investigation. Hence, academic staffs, technical staffs, senior admin staffs were considered under investigation.
Inclusion and exclusion criteria
All academic and administration staff in any service were included as participants in current investigation. Hence, instructors at any level, technical assistants, and administrative staff at any position were included in this study as respondents.
Study variables
The outcome variable consider for this study was the status quality culture in Bahir Dar University. This was measured in terms of important variables as indicated in Figure 1.
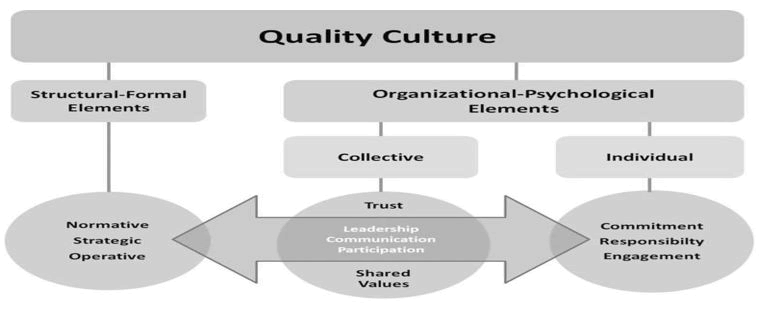
Figure 1. The quality culture model, adopted from Christine and Sonntag.
Data analysis
Data analysis was conducted using SPSS software. Descriptive statistics and t-test was used in data analysis to assess the existing situation of quality culture within the university. Analysis usually moves through five phases, transcribing, compiling and sorting data; coding and memo writing; looking for patterns, themes; interpretation and drawing conclusion.
A sample of 233 academic staff members and 458 administrative staff members, who were chosen using the proportional sampling techniques, were participated in responding standardized questionnaires, with a 10% non-return rate being taken into account. As a result, 205 academic staff members and 423 administrative staff members’ questionnaires were usable and returned to be included under investigation. These returned samples serve as the basis for the analysis. There are 377 male respondents and 251 female respondents in the returned questionnaire when we break it down based on sex.
The baseline characteristics of respondents are indicated in Table 1. In Table 1, it is indicated that the majority of the respondents (41.2%) had service year between 5 and 10 years followed by participants whose service year 10 to 15 years. Regarding the educational status, among the participants about 73.2% had second degree and 15% of the participants had third degree status. In terms of college/school/campus, college of medicine and health science has taken largest proportion of respondents (123, 19.6%) followed by college of agriculture (which stands on college of agriculture and environmental science (95, 15.1%) and college of business and economics (94.15%) Refer to Table 1.
| Variable | Categories | Frequency | Percent |
| Sex | Female | 251 | 40 |
| Male | 377 | 60 | |
| Service years | <5 years | 36 | 5.7 |
| 5-10 | 259 | 41.2 | |
| 10-15 | 211 | 33.6 | |
| 15-20 | 105 | 16.7 | |
| Educational level | First degree | 73 | 11.6 |
| Second degree | 460 | 73.2 | |
| Third degree | 95 | 15.1 | |
| Academic unit | BIT | 58 | 9.2 |
| Agriculture | 95 | 15.1 | |
| COBE | 94 | 15 | |
| Education | 68 | 10.8 | |
| Yibab | 19 | 3 | |
| Science and maritime | 46 | 7.3 | |
| Textile | 72 | 11.5 | |
| Tibebe Gion/Medicine/Health science | 123 | 19.6 | |
| Wisdom | 53 | 8.4 | |
| Staff category | Academic staff | 205 | 32.6 |
| Administration | 423 | 67.4 |
Table 1. Baseline characteristics of respondents (staffs).
Status of total quality culture
The fundamental objective of this study was to understand the status of quality culture which was defined the interaction between organizational psychological elements and structural function of the given organization. Thus, staffs who are working in different campuses, with different working experience and sex disparities were selected as respondents of the study. The data obtained from the closed ended questionnaire was analyzed and presented in Table 2 below to show the status of total quality culture in the university. This was investigated using one sample t-test (considering the test value=3).
|
|
Test value=3 |
|||||
|
t |
df |
Sig. (2-tailed) |
Mean difference |
95% confidence interval of the difference |
||
|
Lower |
Upper |
|||||
|
Quality |
6.296 |
627 |
0 |
0.12956 |
0.0891 |
0.17 |
Table 2. One sample t-test in assessing the total quality culture at Bahir Dar University.
The over status of quality culture at Bahir Dar University was a little bit above the cut of point (test value=3). For the sake simplicity of intervention, the evaluation was conducted based on different categories of study variables. Hence, the evaluation of psychological components such as belongingness (M=3.82, p-value<0.01), responsibility (M=4.14, p-value<0.01), effort for change or engagement (m=4.34, p-value<0.01), curriculum set ups (M=3.17, pvalue= 0.003) and commitment (M=3.21, p-value<0.01) was significantly above average (M=3.079, Std.=.54). However, there was little or no quality culture in other constructs of quality culture such as average score in leadership (M=2.61, p-value<0.01), transformational quality (M=2.63, p-value<0.01), communication (M=2.62, pvalue< 0.01), contribution (M=2.86, p-value=0,003), qualities of supportive services (M=2.43, p-value<0.01), teaching infrastructure (M=2.57, p-value<0.01) and administrative quality attitude and behavior (M=2.7, p-value<0.01) were found to be significantly below the expected/hypothetical mean (Mean=3.0).
To assess the status of quality culture at different campuses, oneway Analysis of Variance (ANOVA) was conducted as shown in Table 3. Table 3 revealed that the status of quality culture was at different levels at different campuses.
| Sum of squares | df | Mean square | F | Sig. | |
| Between groups | 3.462 | 8 | 0.433 | 1.641 | 0.01 |
| Within groups | 163.267 | 619 | 0.264 | ||
| Total | 166.73 | 627 |
Table 3. Status of quality culture among different campuses.
Table 3 indicates that there was statistical significant variation (Pvalue= 0.010) of quality culture among different campuses in Bahir Dar University. The result in Figure 2 revealed that quality culture at Wisdom was at very good status followed by College of Educational and Behavioral Science and College of Agriculture and Environmental Science. The least performance regarding to quality culture in the university was in the technology institutes (BIT and Eitex).
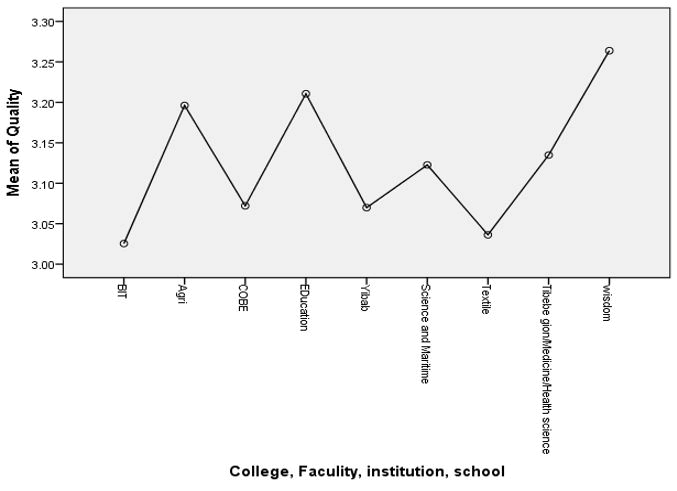
Figure 2. The expected status of total quality culture at different campuses of Bahir Dar University.
The other possible inference from this result was that staffs’ expected scores were below the aggregated mean in relation to structural-formative element and collective dimension of organizationalpsychological component of quality culture. This further showed that there are quality problems such as unsatisfactory administrative service provision behavior and negative attitude in serving others, low quality of infrastructure for teaching, negative beliefs in leadership, and low contribution of each staff for institutionalized quality culture. These inferences can also be summarized more in Table 4 that showed aggregated status of structural-formative elements and organizationalpsychological elements.
| Category | Variables | N | Mean | Std. | t | Sig. (2 tailed) |
| Structural–formal elements | Administrative quality attitude and behavior | 628 | 2.7094 | 0.70034 | -5.9 | 0 |
| Teaching infrastructure | 628 | 2.5695 | 0.83158 | -7.4 | 0 | |
| Relevance of curriculum | 628 | 3.1724 | 0.80953 | 3.05 | 0.003 | |
| Professional assessment | 628 | 3.6258 | 0.74973 | 11.9 | 0.062 | |
| Quality of supportive facilities | 628 | 2.4333 | 0.78184 | -10.4 | 0 | |
| Trans-formative quality | 628 | 2.6081 | 0.92316 | -6.1 | 0 | |
| Organizational-psychological element | Commitment | 628 | 3.2098 | 0.9225 | 2.99 | 0.003 |
| Belongingness | 628 | 3.8224 | 0.91613 | 12.9 | 0 | |
| Responsibility | 628 | 4.139 | 0.85617 | 19.05 | 0 | |
| Engagement | 628 | 4.3402 | 0.95795 | 20.03 | 0 | |
| Leadership | 628 | 2.6073 | 0.99557 | -5.6 | 0 | |
| Trust | 628 | 2.6329 | 0.96873 | -5.4 | 0 | |
| Shard value | 628 | 2.9451 | 0.92008 | -0.85 | 0.034 | |
| Communication | 628 | 2.6234 | 0.95272 | -5.7 | 0 | |
| Contribution | 628 | 2.8646 | 0.9012 | -2.2 | 0.033 |
Table 4. Status of quality culture as a function of Structural-formal element and organizational-psychological elements (Given the expected mean=3.00).
The status of quality culture with respect to structural formal elements and organizational psychological elements among the different campuses were also investigated using one-way ANOVA as shown in Table 5.
| Variables | Sum of squares | df | Mean square | F | Sig. | |
| Structural formal element | Between groups | 5.471 | 6 | 0.912 | 2.896 | 0.001 |
| Within groups | 62.012 | 197 | 0.315 | |||
| Total | 67.482 | 203 | ||||
| Organizational psychological element | Between groups | 7.023 | 6 | 1.171 | 3.155 | 0.006 |
| Within groups | 73.466 | 198 | 0.371 | |||
| Total | 80.49 | 204 |
Table 5. Assessment of the quality culture differences among campuses using one way ANOVA.
Table 5 depicted that there was a significant variation of Structural–formal element among academic units/campuses (pvalue= 0.001). Similarly, Table 5 indicates that there was a significant variation of organizational psychological element among academic units/campuses. To assess those campuses which had high performance and low performance with respect to major dimensions of quality culture, multiple comparisons was conducted among the campuses as shown in Table 6.
The multiple comparison in Table 6 indicates that the quality culture at COBE was significantly less than college of Agriculture (pvalue= 0.047, 95% CI (-0.6582, -0.0017). Similarly, the quality culture conducted at COBE was significantly smaller than that of the Institute of Disaster and Sustainable Development, BIT and medicine and other health sciences with (p-value=0.042, 95% CI: (-1.4378, -0.0125), (p-value=0.042, 95% CI: (-0.5694, -0.0045) and (pvalue< 0.01; 95% CI: ( -0.8521, -0.2095) respectively.
| (I) College | (J) College | Mean difference (I-J) | Std. error | Sig. | 95% confidence interval | |
| Lower bound | Upper bound | |||||
| COBE | Science and maritime | -0.19386 | 0.10452 | 0.821 | -0.5414 | 0.1537 |
| Education and behavioral science | -0.54793 | 0.18217 | 0.123 | -1.1537 | 0.0578 | |
| Agriculture | -.32993* | 0.09873 | .047* | -0.6582 | -0.0017 | |
| Humanity | -0.21953 | 0.12856 | 0.891 | -0.647 | 0.2079 | |
| Social science | -0.13817 | 0.12436 | 0.997 | -0.5517 | 0.2753 | |
| Law | -0.25671 | 0.11658 | 0.59 | -0.6443 | 0.1309 | |
| Land admin | -0.27742 | 0.12856 | 0.622 | -0.7049 | 0.15 | |
| Disaster and sustainable development | -.72515* | 0.21434 | .042* | -1.4378 | -0.0125 | |
| Geology | -0.26775 | 0.19597 | 0.979 | -0.9193 | 0.3838 | |
| BIT | -.28699* | 0.08495 | 0.042 | -0.5694 | -0.0045 | |
| Eitex | -0.20635 | 0.09569 | 0.623 | -0.5245 | 0.1118 | |
| Medicine and health science | -.53084* | 0.09664 | .000* | -0.8521 | -0.2095 | |
| Agriculture | Business and economics | .32993* | 0.09873 | 0.047 | 0.0017 | 0.6582 |
| Science and maritime | 0.13606 | 0.1081 | 0.989 | -0.2234 | 0.4955 | |
| Education and behavioral science | -0.21801 | 0.18425 | 0.994 | -0.8306 | 0.3946 | |
| Disaster and sustainable development | Business and economics | .72515* | 0.21434 | 0.042 | 0.0125 | 1.4378 |
| Science and maritime | 0.53128 | 0.21881 | 0.425 | -0.1962 | 1.2588 | |
| Education and behavioral science | 0.17722 | 0.26484 | 1 | -0.7034 | 1.0578 | |
| BIT | Business and economics | .28699* | 0.08495 | 0.042 | 0.0045 | 0.5694 |
| Science and maritime | 0.09312 | 0.09568 | 0.999 | -0.225 | 0.4112 | |
| Education and behavioral science | -0.26095 | 0.17724 | 0.962 | -0.8503 | 0.3284 | |
| Agriculture | -0.04294 | 0.08931 | 1 | -0.3399 | 0.254 | |
| Medicine and health science | Business and economics | .53084* | 0.09664 | 0 | 0.2095 | 0.8521 |
| Science and maritime | 0.33698 | 0.10619 | 0.078 | -0.0161 | 0.69 | |
| Education and behavioral science | -0.01709 | 0.18313 | 1 | -0.626 | 0.5918 | |
| Note: *: Indicates the mean difference is significant at the 0.05 level. | ||||||
Table 6. The multiple comparisons of organizational psychological elements in different academic units.
The result in Figure 3 also indicates that there was a variation of organizational psychological elements between agriculture and CoBE.
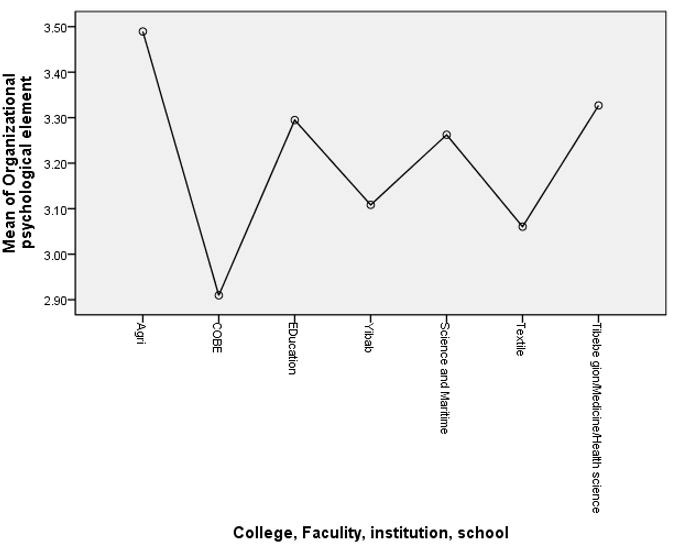
Figure 3. Average differences among respondents in different colleges and/or campuses.
To identify the intervention area within the university, important variables were compared among the academic units as shown in Table 7. Table 7 indicates that the admin process, availability of infrastructure, service quality, change of leadership, felling of responsibility, work commitment, employee’s attitude about leaders, employee’s trust on the system, shared values, effective communication among employees have significant variation among academic units within the university and need intervention for the parameters to be similar. Hence, the variables that require intervention in this context are service quality, change leadership, staffs’ attitude about leaders, employees trust in the system, developing shared value, and communications.
|
|
|
Sum of squares |
Mean square |
F |
Sig. |
|
Attitude of the staff
|
Between groups |
3.709 |
0.464 |
0.662
|
0.725
|
|
Within groups |
270.466 |
0.701 |
|||
|
Total |
274.175 |
|
|||
|
Admin process
|
Between groups |
11.787 |
1.473 |
2.028
|
0.042
|
|
Within groups |
280.452 |
0.727 |
|||
|
Total |
292.239 |
|
|||
|
Infrastructure availability
|
Between groups |
21.185 |
2.648 |
3.687
|
0
|
|
Within groups |
277.214 |
0.718 |
|||
|
Total |
298.399 |
|
|||
|
Service quality
|
Between groups |
20.618 |
2.577 |
4.918
|
0
|
|
Within groups |
202.286 |
0.524 |
|||
|
Total |
222.904 |
|
|||
|
Change leadership
|
Between groups |
35.463 |
4.433 |
5.317
|
0
|
|
Within groups |
321.792 |
0.834 |
|||
|
Total |
357.255 |
|
|||
|
Commitment of employees
|
Between groups |
3.758 |
0.47 |
0.536
|
0.829
|
|
Within groups |
311.312 |
0.877 |
|||
|
Total |
315.071 |
|
|||
|
Belongingness of employees
|
Between groups |
8.715 |
1.089 |
1.205
|
0.295
|
|
Within groups |
320.115 |
0.904 |
|||
|
Total |
328.83 |
|
|||
|
Feeling of responsibility
|
Between groups |
20.708 |
2.589 |
3.407
|
0.001
|
|
Within groups |
269.744 |
0.76 |
|||
|
Total |
290.452 |
|
|||
|
Work commitment
|
Between groups |
19.979 |
2.497 |
3.59
|
0
|
|
Within groups |
268.497 |
0.696 |
|||
|
Total |
288.476 |
|
|||
|
Employees attitude about leaders
|
Between groups |
27.052 |
3.382 |
3.229
|
0.001
|
|
Within groups |
364.482 |
1.047 |
|||
|
Total |
391.534 |
|
|||
|
Employees trust on the system
|
Between groups |
11.492 |
1.437 |
2.097
|
0.035
|
|
Within groups |
264.436 |
0.685 |
|||
|
Total |
275.928 |
|
|||
|
Shared value
|
Between groups |
14.665 |
1.833 |
2.478
|
0.012
|
|
Within groups |
285.497 |
0.74 |
|||
|
Total |
300.161 |
|
|||
|
Effective communication to employees
|
Between groups |
20.846 |
2.606 |
3.128
|
0.002
|
|
Within groups |
321.582 |
0.833 |
|||
|
Total |
342.428 |
|
|||
|
Contribution of employees towards quality
|
Between groups |
10.532 |
1.316 |
1.428
|
0.183
|
|
Within groups |
355.959 |
0.922 |
|||
|
Total |
366.491 |
|
Table 7. Differences in perceptions of quality culture variables among campuses.
In this study some intervention areas were identified for the university to achieve its mission and vision. Some of the important variables that need intervention are discussed below:
Effective communication: Effective communication is very important for all staffs to have common vision and mission and to have sense of ownership by all staffs. As part of university’s job as a leader is to generate a commitment to university’s vision. To do this, leaders have to communicate the vision in a way that matters to people. You want people in the organization to believe the vision and to pass it on to others. This result is supported by the previous study which states that there are 7 ways of communicating the vision and mission of the organization. Some of the means of communicating staffs are tell a history with trusts and capture heart minds with perfect elevator speech, Use multiple mass media like coffee mugs, T-shirts, luggage tags and the like.
Shared value: Shared value was one of the important intervention areas that need attention. Shared value harnesses the resources, skills and innovation of an organization to target the issues that intersect with its business. As a differentiation strategy, it seeks to address these issues in a way the rest of the market is not. Shared values are organizational values that are usually developed by the organization's leadership and then adopted by the other members of the organization. The values are shared and followed by all members of the organization when acting on behalf of the organization.
Trust of employees on the system: One of the other intervention areas under this study is trust of employee on the university. Trust in the workplace means the university’s employees enjoy a culture of honesty, psychological safety, and mutual respect. They’re proud of where they work and are more willing to go above and beyond for your organization. Trust in the workplace also helps employees feel secure in their jobs and, in turn, reduces turnover.
Employees’ attitude about leaders: Another intervention area under this study is the attitude of employee on their leaders. Previous study also states that leadership practices/styles remain a key focus for organizational intervention. Another previous study also states that leaders’ realization of their potentials following particular style can bring influential consequences.
Similarly, admin process, infrastructure availability, service quality, change leadership, feeling of responsibility and work commitment are the other important intervention areas that need attention to be addressed.
The results obtained in current investigation had both quantitative and qualitative investigations. The result in this study indicates that there was a significant variation of both structural formal element and organizational psychological elements among campuses, academic units. Examining the state of the quality culture in BDU is the first specific study goal. The data were examined using a one sample ttest, and the results show that there is no statistical evidence for the practice of a quality culture as assessed by the staff and students (mean value: 3.01; p-value: 0.551). When we consider the principles shared by academic staff, administrative employees, and students, the outcome is not the same. According to the academic staff's view, which is much higher than the average or hypothetical value (3.0), the quality culture at BDU is relatively at better level. The amount of quality culture inside the university varies from academic unit to academic unit, nevertheless.
The quality culture measure parameters, such as administrative process, administrative quality, level of infrastructure development, relevance of curriculum, teaching-learning, quality of students' service, quality of change, and belongingness trust, as a result, significantly differ between academic units. Additionally, it was discovered that while there was no significant variation in organizational psychological elements among campuses, there was a significant variation in structural formal elements, which was different from the finding from the administrative staff's response, which was different from the academic staff's response. To understand why academic staff and administrative staff perform differently, more investigation should be done.
The results demonstrated that the university's overall quality culture is about average, and it is plausible to conclude that this is the case given the results. For a university that aspires autonomy, just average performance is insufficient; in order to remain competitive, it must perform better than average in measurements of its primary stakeholders' (students' and staff') attitudes. In this view, the university's operations must be centered on quality, and everything it does must be intended to support a culture of excellence in some way. Hence, for the university to have good quality culture and to be competent with other universities, there should be support services and substandard infrastructure for teaching and learning, make appropriate decisions, and maintain adequate communication addressing issues of shared concern at the university, adequate leadership support and communication, instilling trust among the staff, change leadership and how it was handled in the university. The organizational psychological dimensions' individual components, such as commitment, responsibility, and involvement, received considerably higher scores, indicating that respondents believe they are making progress with regard to their own problems. However, the results are the reverse when it comes to the collaborative glue that connects both individual components and the structural organization dimension. Therefore, if individual efforts cannot be turned into a team and collaborative commitment to build synergy, they will not result in the desired outcome.
This study was not without limitation. One of the limitations is that the study was conducted only one sector, Bahir Dar University. Including other higher education universities might give us additional information. Hence, authors recommend further investigation including more universities for the study to be countrywide research.
The informed consent for this cross-sectional study was waived by Bahir Dar University ethics committee, Ethiopia.
This manuscript has not been published elsewhere and is not under consideration by any other journal. Authors agreed this manuscript to be submitted in this journal for publication.
Authors declared that, there is no conflict of financial interest between the author and institutions.
This research did not receive any specific grant from funding agencies in the public, commercial, or not-from-profit sectors.
[Crossref] [Google Scholar] [PubMed]
Journal of Biometrics & Biostatistics received 3496 citations as per Google Scholar report