Research Article - (2023) Volume 14, Issue 6
Received: 03-Nov-2023, Manuscript No. bej-23-119185;
Editor assigned: 06-Nov-2023, Pre QC No. P-119185;
Reviewed: 17-Nov-2023, QC No. Q-119185;
Revised: 22-Nov-2023, Manuscript No. R-119185;
Published:
29-Nov-2023
, DOI: 10.37421/2151-6219.2023.14.461
Citation: Saini, Suman and D. P. Warne. “The Impact of the Us
Market on Herding Behavior in Indian Equity Market.” Bus Econ J 14 (2023): 461.
Copyright: © 2023 Saini S, et al. This is an open-access article distributed under the terms of the Creative Commons Attribution License, which permits unrestricted use, distribution, and reproduction in any medium, provided the original author and source are credited.
The presented study investigates the impact of the US Market on the herding behavior in the Indian Equity Market through an analysis of daily returns from the top 100 companies of the National Stock Exchange and S&P 500 index of the US market in tenure ranging from October 2017 to April 2023. The selected study period is very productive because during this time the Covid-19 Pandemic spread all over the world and those distinct circumstances can precipitate herding behavior. The outcomes exhibit that there is no polarization effect between the US and the Indian Market. This outcome may be due to the different market structures of both of countries. The US markets are primarily self-governing while In the Indian Equity Market government can easily interrupt the situation of destabilizing.
Herding behavior • Indian equity market • S & P 500 • NSE • US market
JEL Classification: G15; G14
Behavioral biases are the main determinant of high volatility in the Indian Equity Market and herding is defined as the most noteworthy bias among them. Argued that widespread herding among investors is the main determinant of the financial crisis. The Global Financial Crisis 2008 clearly demonstrated that market prices may considerably deviate from fundamental values for a prolonged period [1]. A well-documented behavior encountered in such extreme market conditions [2] in herding. Characterize herding as the trading in the same direction by a group of investors for a period of time, [3,4] define human herding behavior usually results from a tendency to imitate the actions of others. Herding behavior in the equity market can be defined in three forms: Information based herding, Reputational herding and Compensation based herding. Information-based herding occurs when investors react in the same direction to announced information. Reputational-based herding happens because respected investors or crucial trading houses when care about their reputation and take similar decisions to ensure the safety of this reputation. Compensation-based herding arises when the performance of investment managers is compared with other investment managers or benchmark and their salary and compensation depend on their good performance from others [5] Classify herding in two forms: intentional and spontaneous (unintentional or rational) herding. In spurious herding, a group of investors take similar decisions based on similar problems and fundamentals. This form of herding is rational and unintentional because investors are not copying others but taking a rational decision based on determined information set. The reason behind this behavior could be such as watching the same business-related channels or reading the same reports. On the other hand, intentional herding is a situation where investors irrationally mimic the other investor’s decision without knowing the reason behind it.
They ignore their private information and follow the other investor’s decisions blindly. There can be many reasons for this behavior - investors assume that other investors’ decisions are more consistent and they got the information from a good source [6]. Investigated the herding behavior in Indian Equity Market in a different context [7,8] pointed out that the vast majority of these empirical works are restricted to a single market. However, in the phase of rapidly increasing globalization, herding behavior is not exclusively affected by the national factor itself whereas the international markets also affect the behavior of a market Bui ND, et al. [9] Observe that the market participants in the Vietnam stock market always observe the market movement of the US market and make an investment decision based on the US movement. The presented article investigates the impact of the US equity market on herding behavior in the Indian equity market. On the other hand, this article also focuses on the cross-country effect of herding behavior in extreme market conditions including the S&P 500 index as it represents approximately 80% of the total value of the US Equity Market.
We analyzed the past consequential literature and found that several studies have been done to analyze the herding behavior in the equity market. One of the primary research projects on herding was done by Lakonishok J, et al. [10] in this Literature, the author observes the role of herding and positive feedback trading in destabilizing the stock prices. They use data on the holding of 769 pension funds from 1985 to 1989 and they don’t find any significant evidence of herding or positive feedback trading by pension fund managers except in small stocks. Also investigate the existence of herding in condition of extreme market stress on the market as a whole and in the bull and bear phase of the market individually. They used both the Cheng mode and Huang model and found no existence of herding in the Indian stock market as a whole but it existed in the bull phase of the market. Inspecting the herding behavior in the Indian stock market in the market-wide sense that was the standard behavior of all investors in the equity market for the same portfolio.
They take daily and weekly observations of fifty stocks listed on the NSE. The methodology that they used was CSAD (cross-sectional standard deviation) developed by Cheng, Chang and Khorana. In their findings herding did not exist in the Indian stock market for a long period. They also detect herding behavior in the pre-financial crisis period, post-financial crisis period and during the crisis period and found that herding was absent in all these time periods. Study the presence of herding in the Indian stock market separately for large-cap and small-cap stocks. They take daily data from NSE nifty hundred and used CSAD (Cross-Sectional Absolute Deviation method. In their study they observe that herding propensity is a priced risk factor in large-cap stocks; however, the same does not hold for small-cap stocks for several reasons.
Inspected herding based on primary respondents from Indian Equity Markets. They explain the empirical endorsement by applying the CSAD technique. This paper also analyzes the market-wide herding in the Indian stock market during normal and extreme market situations and in both increasing and decreasing market stages.
The author concludes that there is no demonstration of herd behavior in any market condition (normal, extreme and decreasing or increasing) mainly due to the dominance of institutional investors and secondly due to low market participation [11] developed a test to identify herding behavior in the market. They developed CSSD (Cross-Sectional Standard Deviation) method to analyze the herding behavior in the stock market. They observe that market alternates between normal and extreme market scenarios and herding exit in the extreme market phase only. They infer that when investors follow the cumulous market movement and neglect their own judgment (herding) then individual asset returns will not divagate substantially from overall market return. Consequently, the value of CSSD gets reduced. Further, Chang EC, et al. [12] enhanced the study of Christie WG and Huang RD [11] and evolved a new approach to detect herd behavior. In their paper, they used a less drastic method that is based on the non-linear regression model, in this method, they examined the relationship between the dispersion of equity return that we calculate by using the CSAD (Cross-Sectional Absolute Deviation) method and market return. They detect herding behavior in five different international markets that were- U.S., JAPAN, HONG-KONG, TAIWAN and SOUTH KOREA, in their result, they found partial evidence of herding in Japan but Taiwan and south-Korea show a significant amount of herding and the finding of the U.S. stock market consists with the result of detected herding in the international market, selecting 18 countries by using daily data from 1988 to 2009. To operate a test for this, they ameliorate CCK [11] method. They observe that CCK’s method is derived from the condition version of the Capital Asset Pricing Model (CAPM). But they follow the method of Christie and Huang and Gleason, et al. to estimate beta in their method. So that we can avoid the possible specification error which is associated with a single element Capital asset pricing model. This paper highlights many shortcomings of the CCK’s study and method and fulfilled it in this study. They include 18 global countries for detecting herding behavior in international markets and they find vindication of herding in the advanced stock market (sans US market) and also in the Asian market. They conclude that Stock return dispersion of the US Stock market plays a prominent role in defining the herding behavior in the non-US market. This study also finds that herding exists in both bull and bear phases of the market with the exception of the Latin American and US market. Calibrate the impact of the US market on herd behavior in the Chinese Stock Market.
They observe six years of daily return data from Shanghai and The Shenzhen Stock Exchanges. It also used the methodology of Christie WG and Huang RD [11] and concludes that there is no contagion effect between the Chinese and US stock markets, although the Chinese financial market is influenced by the US Stock Market. It also implicates the reason that the structure of these two markets is different. Govt can easily interfere in the Chinese Stock Market in a disrupted situation whereas the US Markets are independent of govt. also used the model of Cheng EC, et al. [12] after some extension and moderation and seek the 2herding behavior in Vietnamese, a frontier stock market and found the indication of herding in both industry and market perspectives. It also shows herding behavior in both up and down-market conditions. They also investigate the impact of the US market on the herd behavior in the Vietnamese stock market and found evidence of influences of the US stock market on the Vietnamese market.
All the studies described above are limited to a single market. There is no study attempt to check the herding behavior of the Indian Equity market across the national border. In the paper, the herding behavior of the Indian market is also checked with the collaboration of international markets and also detected the impact of one market on the herding of others.
Objectives of the study
The objective of the study is to investigate the influence of the US market on the herding behavior of the Indian Equity Market. On the other hand, this article also focuses on the cross-country effect in herding behavior in extreme market conditions including the S&P 500 index of US Market as the S&P 500 index represents approximately 80% of the total value of the US Equity Market.
Data description
The data used in this article contains the daily returns of the 100 most capitalized companies listed on the National Stock Exchange over the period October 2017 to April 2023, collected from and Prowess IQ database. The daily returns of the S&P 500 index are used to analyze the impact of the US Market on the herding behavior of the Indian Equity Market reason being the S&P 500 index represents approximately 80% of the total value of the US Equity Market. There are weekly 1360 return observations of the S&P 500 index and 1361 return observations of 100 most capitalized NSE listed shares.
Christie WG and Huang RD [11] applied the CSSD (Cross-Sectional Standard Deviation) method in order to depict the return dispersion. Chang EC, et al. [12] identify the problem in this method that this model finds out the presence of herding during extreme returns period only by ignoring the time of normal conditions of returns in the stock market and further developed an alternative method CSAD (Cross-Sectional Absolute Deviation) [13] CSAD is the mean of the aggregate difference between the expected return of individual securities and CSAD has been positive. propose that this relationship should be negative and non-linear when herding behavior occurs because the absolute market return value increase, whereas the CSAD decrease, or increase at a decreasing rate. We also used the CSAD method in this article.
For calculation of CSAD, the following formula was used:
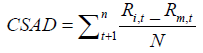
Where:
Ri,t = Individual Stock Return at time T
Rm,t = Market stock return at time T
N = Total no. of observation
For calculating the individual stock return Ri at time T, the following formula used:
R= ln(Pt / Pt-1)*100
Chang EC, et al. tested the CSAD by using the classical equation:
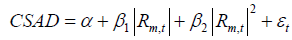
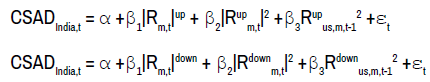
The testing equation includes the nonlinear market return |Rm,t|2 because, at times with investors tend to herd in response to higher variances breaking the linear relationship typically expected in equilibrium models, to a market consensus. That is Generally, herding behaviour occurs when one observes a negative coefficient of β2. In order to investigate the impact of the US Market on herding behaviour on the Indian Equity Market, we modified the previous equation as follows:

S&P 500 index is chosen for the US market. As a result of an expected
time lag between the US and Indian Equity Market, the lagged value of  is unified into the equation. The negative and significant value of β3 would
demonstrate the influence of the US market on herding behaviour in the
Indian financial market. We examine the impact of the US market on herding
behaviour in the Indian Equity market in extreme returns period also. For this
purpose we adopted the equation as follows:
is unified into the equation. The negative and significant value of β3 would
demonstrate the influence of the US market on herding behaviour in the
Indian financial market. We examine the impact of the US market on herding
behaviour in the Indian Equity market in extreme returns period also. For this
purpose we adopted the equation as follows:
The negative and significance coefficient of square market return is the indication of herding behavior. The Stock returns are compared to the market return using the CSAD value. It measures whether the stock returns of the Indian market move along with or against the market return of US market. When constituent stock returns of the Indian market differ from market returns of the US market, the value of the CSAD rises; when stock returns follow market returns, the value of the CSAD falls. Before applying the variables in these models, the Dickey-Fuller Test has been applied to check the stationary of data. The result of the Dickey-Fuller test is shown in Table 1.
| Variables | T- Statistics | Prob. | Critical value at 1% Level | Critical value at 5% Level | Critical value at 10% Level |
|---|---|---|---|---|---|
| CSAD | -5.206906 | 0.0000 | -3.455486 | -2.872499 | -2.572684 |
| |Rm| | -4.369368 | 0.0004 | -3.455685 | -2.872586 | -2.572730 |
| |Rm|2 | -4.278729 | 0.0006 | -3.455585 | -2.872542 | -2.572707 |
| (S&P 500)2 | -6.201832 | 0.0000 | -3.455887 | -2.872675 | -2.572778 |
| (S&P 500high)2 | -6.277768 | 0.0000 | -3.503049 | -2.893230 | -2.583740 |
| (S&P500low)2 | -5.188763 | 0.0000 | -3.493129 | -2.888932 | -2.581453 |
The unit root test of weekly data shows the CSAD & Rm series are stationary for both stock markets as shown in Table 1, the p-value of all series is less than 0.01 (Table 1).
Table 2 shows the descriptive statistics for weekly market returns of both markets and return dispersion during 2017-2023. The central value of CSAD is 2.930646 with a minimum of 0.005367 and a maximum of 9.108931. The mean of Indian and US market returns is 0.228864 and 0.235115 with a maximum of 11.91439 and 11.42367 and a minimum of -12.69485 and -16.22790. The high standard deviation of the returns of both markets (2.436522 & 2.610158) indicates that the Indian and US markets are very much unstable during the period from October 2017 to April 2023. This large Standard deviation can be due to unpredictability in the equity market caused by the waves of the Covid-19 pandemic. To comprehend the underlying statistical distribution of stock returns in the Indian and US stock markets, the skewness and kurtosis measure is used. Skewness is a measurement of the probability distribution's asymmetry on a large scale. The skewness for a normal distribution is zero. Kurtosis is a measure of the uniformity of the probability distribution. A standard normal distribution has a kurtosis of three and is renowned as mesokurtic. The skewness values of series Rm and RS&P are -0.494952 & -1.245610 and the kurtosis values of both series are 9.037882 & 12.40225. The presented kurtosis values are very high and skewness also differed from zero; hence the values indicate that the market returns of both markets are leptokurtic positions (Table 2, Figure 1).
| Observations | CSAD | RM | RS&P |
|---|---|---|---|
| Mean | 2.930646 | 0.228864 | 0.235115 |
| Median | 2.780138 | 0.379532 | 0.496613 |
| Maximum | 9.108931 | 11.91439 | 11.42367 |
| Minimum | 0.005367 | -12.69485 | -16.22790 |
| Std. deviation | 0.958886 | 2.436522 | 2.610158 |
| Skewness | 2.311505 | -0.494952 | -1.245610 |
| Kurtosis | 13.53724 | 9.037882 | 12.40225 |
| Observation | 1361 | 1361 | 1360 |

Figure 1. The movement of the indexes of the Indian and the US Stock markets from October, 2017 to April, 2023.
The result of CSAD model is reported in Tables 3-5. As we see in Table 3,
the coefficient of  is positive and significance at 5% level. It conveys that
there was no impact of US market on herding behavior in Indian equity market. Tables 4 and 5 reveals the impact of US market in Extreme returns condition.
As shown in Tables 4 and 5 the coefficient value of
is positive and significance at 5% level. It conveys that
there was no impact of US market on herding behavior in Indian equity market. Tables 4 and 5 reveals the impact of US market in Extreme returns condition.
As shown in Tables 4 and 5 the coefficient value of  is positive and the
coefficient value of
is positive and the
coefficient value of  is negative and both are significant at the 1%
level. It indicates that in extreme high returns conditions US market does not
influence the Indian stock market but in the situation of extremely low returns
conditions, The herding behavior in the Indian equity market exists because of
the US stock market (Tables 3-5).
is negative and both are significant at the 1%
level. It indicates that in extreme high returns conditions US market does not
influence the Indian stock market but in the situation of extremely low returns
conditions, The herding behavior in the Indian equity market exists because of
the US stock market (Tables 3-5).
| Variable | Coefficient | St. Error | T-statistics | Prob. |
|---|---|---|---|---|
| |Rm,t| | 0.217279 | 0.041175 | 5.277028 | 0.0000 |
| |Rm,t|2 | -0.016767 | 0.031748 | -0.528118 | 0.5979 |
| R2us,m,t-1 | 7.6E-06 | 9.35E-06 | 0.819518 | 0.4133 |
| C | 1.129793 | 0.139103 | 8.122004 | 0.0000 |
| Variable | Coefficient | St. Error | T-statistics | Prob. |
|---|---|---|---|---|
| |Rm,t|up | -0.043859 | 0.051795 | -0.846786 | 0.3994 |
| |Rupm,t|2 | 0.034304 | 0.058672 | 0.584672 | 0.5602 |
|
0.017774 | 0.001957 | 9.080826 | 0.0000 |
| C | 2.829645 | 0.158460 | 17.85714 | 0.0000 |
| Variable | coefficient | St. Error | T-statistics | Prob. |
|---|---|---|---|---|
| |Rm,t|down | -0.023020 | 0.056701 | -0.405982 | 0.6856 |
| |Rdownm,t|2 | -0.069098 | 0.068904 | -1.002826 | 0.3183 |
|
-0.018519 | 0.001924 | 9.625323 | 0.0000 |
| C | 2.946751 | 0.136289 | 21.62136 | 0.0000 |
The presented study analyzes the impact of the US stock market on herding behavior in the Indian equity market for the entire sample period additionally extreme high and low returns period. We considered the daily returns of the top 100 companies of the National Stock Exchange and S&P 500 index of the US stock market ranging from October 2017 to April 2023. By applying the methodology of Chang Cheng & Khorana, we conclude that the US stock market has not influenced the herding behavior in the Indian equity market during the entire sample period. This outcome may be due to the different market structures of both countries. The US markets are primarily selfgoverning while In the Indian Equity Market government can easily interrupt in the situation of destabilization. Further, we analyzed the impact of the US market on herding behavior in the Indian equity market in extreme high and low returns period. The result of the study validates the impact of US market in extreme low returns period only. The result is inconsistent with observe that the market participants in Vietnam stock market always observe the market movement of the US market and make investment decisions based on the US movement. The result is similar to exhibiting that there was no contagion impact of the US market on the Chinese equity market. This paper also refutes the correlation between the US market and herding behavior in the Indian stock market. The market participants in the Indian equity market make investment decision considering the movement of the US market and exhibits herding when the US market is in a bull phase period.
Google Scholar, Crossref, Indexed at
Google Scholar, Crossref, Indexed at
Google Scholar, Crossref, Indexed at
Google Scholar, Crossref, Indexed at
Google Scholar, Crossref, Indexed at
Google Scholar, Crossref, Indexed at
Google Scholar, Crossref, Indexed at
Google Scholar, Crossref, Indexed at
Business and Economics Journal received 6451 citations as per Google Scholar report


