Research Article - (2022) Volume 11, Issue 9
Received: 03-Sep-2022, Manuscript No. sndc-22-76938;
Editor assigned: 05-Sep-2022, Pre QC No. P-76938;
Reviewed: 17-Sep-2022, QC No. Q- 76938;
Revised: 21-Sep-2022, Manuscript No. R- 76938;
Published:
29-Sep-2022
, DOI: 10.37421/2090-4886.2022.11.179
Citation: Saini, Sujit Kumar and Suneet Kumar Awasthi. “Sensing and Detection Capabilities of One-Dimensional Defective Photonic Crystal Suitable for Malaria Infection Diagnosis from Preliminary to Advance Stage: Theoretical Study.” J Sens Netw Data Commun 11 (2022): 179.
Copyright: © 2022 Saini SK, et al. This is an open-access article distributed under the terms of the creative commons attribution license which permits unrestricted use, distribution and reproduction in any medium, provided the original author and source are credited.
Background: In the present research work we have examined the biosensing capabilities of one-dimensional photonic crystal with defect suitable for detection and sensing of malaria inflection by means of investigating samples containing red blood cells. This theoretical work is based on transfer matrix formulation in addition to MATLAB software under normal incidence condition due to several difficulties associated with oblique incidence. We have evaluated the performance by taking random cavity thicknesses of 1000 nm, 2200 nm, 3000 nm and 5000 nm to estimate the cavity thickness suitable for optimum performance of the proposed biosensing design. The optimization of cavity is one of the most necessary requirements because it decides the minimum volume requirement of the blood sample for getting results of high accuracy. Moreover sensing and detection capabilities of the proposed design has been evaluated by examining the sensitivity, figure of merit and quality factor values of the design corresponding to optimum cavity thickness.
Photonic crystals • Biosensors • Transfer matrix method
Photonic crystals (PCs) have revolutionized the research field of optical engineering and technology due their commendable control on the propagation of light passing through them since the discovery of pioneering work of Yablonovitch and John in 1987[1,2]. PCs are the periodic structures in which high and low refractive index of the constituent materials modulated periodically [3]. This periodic modulation of refractive index results the formation of photonic band gap (PBG) due to Bragg scattering of incident waves from the interfaces between the various layers of the structure [4]. PBG restricts the propagation of light of specific frequencies from the structure and allows the light of other frequencies to pass through. PCs can be classified in three categories depending upon the modulation of refractive index of the constituent materials in x, y and z directions as one-dimensional (1D), twodimensional (2D) and three dimensional (3D) PCs. The ease of fabrication techniques involved with 1D PCs motivated the photonic engineers to explore the biosensing capabilities of 1D PCs with defect. In recent years the rapid, advanced and accurate sensing capabilities of 1D defective photonic crystal (DPC) based sensors have attracted the photonic technocrats to design and develop photonic sensors to be used in various research fields of applied sciences like security, medical, defense, food detection, environment, and aerospace worldwide [5]. Actually synchronization between the frequency of incident light and defect mode leads to the existence of sharp tunneling peak inside the PBG which is strongly dependent upon refractive index of defect layer region as well as thickness. This property of defect mode is being used in 1D DPCs for designing of various biosensing devices. For example the plasma cell sensing device based on 1D DPC has been analyzed by Zakyetal. For detection and sensing of convalescent plasma whose refractive index variation is restricted between 1.3246 and 1.3634 another photonic design capable of detecting glucose concentration level has been proposed by Asmaaetal. This design is based on Fano resonance excited between the interface of PC and metal nitride. In contrast to the conventional sensors based on plasmonics and photonic crystal fiber sensing technologies, 1D DPC based sensors are highly sensitive sensing mechanism due to ultra high localization of light inside cavity region which lowers down volume requirement of the sample under investigation. Additionally 1D DPC based sensors have compact in size and also have suitable applications in complex environment. Moreover the compatibility of 1D photonic structures with integrated photonic circuits have also strengthen their role for extensive applications in the fields like force-strain, temperature, liquid, pressure, displacement, gas and biomedical engineering.
Blood examination is an essential tool for identifying hematological disorders which are responsible for series of non-communicable diseases like diabetes, Coronary artery, cancerous and respiratory. As per the report of World Economical Forum published in September 2011 these diseases were become the root cause of around 36 million casualties across the world. Therefore regular and periodic blood monitoring is necessary requirement for diagnosis and further prevention of these diseases through proper treatment. Human blood is made up large number of bio-constituents which are approximately more than 4000 in numbers. Actuallynowadays blood optics plays an important role in biophotonic sensing and clinical therapy applications. The absorption and scattering characteristics of light interaction with blood sample depends on the refractive index of the erythrocytes in blood sample which is strongly dependent upon the hemoglobin concentration in erythrocytes. Blood is highly functional body fluid whose refractive index of blood is complex in general. More than half of human blood is made up of blood plasma which contains various proteins like red and white blood cells, enzymes, albumin, hormones, glucose, minerals etc. The supply of oxygen from lungs to different body parts is being accomplished by hemoglobin which is the main protein in red blood cells (RBCs). On the other hand white blood cells (WBCs) which are also known as leukocytes strengthen our body to fight against various infections. The dielectric properties of human blood have great relevance in various medical applications like early stage detection of cancer cells in human body and several other diseases. For example the dielectric blood coagulometry helps us to analyze the whole spectra of human blood to understand the biological, physical and chemical properties comprehensively.
The present work is focused on the 1D photonic biosensing approach for detection of malaria infection in human body. Malaria is one of the fatal diseases caused by protozoan parasites of genus plasmodium. Untreated or undiagnosed malaria may become a root cause of death globally. According to world health organization (WHO) around 405,000 causalitiesout of 228 million malaria cases were reported in 2018 worldwide. If someone is bitten by female anopheles mosquitoprotozoan, parasites are entered into the red blood cells of human body through liver. The presence of protozoan parasites into the RBCs results the structural and biological change in RBCs. This modification degrades hemoglobin which is the main constituents of RBCs for providing nutrition to protozoan parasites. These parasites digest hemoglobin of human body as a free ferrous heme which is quickly transformed into ferric heme and are highly toxic. This transformation results the change in the homogeneous structure of RBCs. Malaria diagnosis must be speedy, reliable and very accurate for their eradication via timely treatment. At present various conventional approaches are being used in malaria diagnosis but all these conventional techniques have limitations depending on their structural details and\or the way of working. Some of these limitations are related to the sensitivity, result accuracy, timeconsumption and difficulties associated with early stage detection of malaria depending upon the stage of infection.
Structural design
The proposed blood sensor has the capability of detecting various stages of malaria infection by examining RBC samples containing cell A, cell B, cell C, cell D and cell E. The proposed structure (AB)NC(AB)N/GS can easily be fabricated by creating a defect layer C of air at the middle of 1D photonic crystal which is composed of alternating layers of A and B of period number N as shown in Figure 1. The alphabets A and B are used for representing layers made up of silicon (Si) and lanthanum flint (LAFN7) materials respectively. The ion-bean sputtering technique can be used for fabrication of proposed biosensing structure composed of Si and LANF7 on glass substrate for detection of malaria infection through red blood cell (RBC) samples containing Cell A, Cell B, Cell C, Cell D and Cell Eseparately.
Theoretical formulation
In order to obtain the simulation results through MATLAB software we have used transfer matrix method. This is one of the most suitable techniques of computationto get simulation results of proposed 1D photonic biosensing structure. According to this method the amplitudes of an electric and magnetic fields associated with incident and transmitted electromagnetic radiation at either ends of the structure i.e. incident and transmitted ends are connected via transfer matrix as
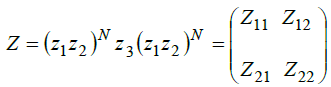 (1)
(1)
Here Z11, Z12, Z21 and Z22are representing the elements of resultant transfer matrix Z. The z1, z2 and z3 are being used for characteristic matrix of layers Si, LAFN7 and various RBC samples containing Cell A, Cell B, Cell C, Cell D and Cell E.
The coefficient of transmission of proposed bio sensing structure [air/(Si/ LAFN7)N/cavity/(Si/LAFN7)N/GS] is defined as
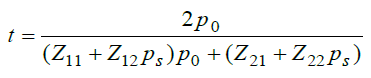 (2)
(2)
Here p0=n0 cos (α0) and ps=ns cos(αs) are corresponding to input and exit ends of the structure respectively for s-polarized wave. For p-polarized wave p0=cos (α0)/n0 and ps=cos(αs)/ns. Also α0 and αs are representing angle of incidence and emergence in incident and exit media respectively.
Finally the transmittance ℑ of the proposed bio sensing structure is
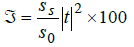 (3)
(3)
The transfer matrix method as discussed above has been applied over the proposed 1D defective photonic structure (AB)NC(AB)N/G as presented in Figure 1. We have used MATLAB software to obtain the transmittance plots of the proposed biosensor under normal incidence condition. The purpose of considering the normal incidence is to overlook the challenges associated with the oblique incidence along with the requirement of transverse electric and transverse magnetic combinations of incident light. The entire simulations have been carried out in visible region of electromagnetic spectrum between 600 nm to 700 nm. The materials silicon (Si) and lanthanum flint (LAFN7) have been used to fabricate the layers A and B of the proposed 1D multilayer stack of refractive indices nSi=3.5 and nLAFN7=1.7respectively on the glass substrate of refractive index ns=1.57. The purpose of selecting Si and LAFN7 materials in our design is to ensure large refractive index contrast between the high and low refractive index layers of the proposed structure which is one of essential requirements for getting wider as well as deeper photonic band gap (PBG). The depth of the PBG may also be increased by increasing the period number. But instead of increasing the period number of the design we have preferred to ensure large refractive index contrast to get wider PBG. The wider PBG also increases the possibility of having large number of resonant transmission peaks whose central wave lengths are restricted inside PBG of the structure. Moreover it also allows improves the number of blood samples to be investigated by our design depending upon their refractive index variation between 1.371 to 1.408 (Table 1). In this simulation work the thicknesses of layers A and B are taken as dA=70 nm and dB=400 nm. The period number N has been fixed to 10. The defect layer of thickness dd=300 nm has been created at middle of the proposed biosensor by disturbing the periodic arrangement of the design as shown in Figure 1.
| Stage of infection | RBC component | Refractive index | Hemoglobin Concentration (g/dl) |
|---|---|---|---|
| Healthy | Cell A | 1.408 | 30.9 |
| Ring | Cell B | 1.396 | 25.59 |
| Trophozoite | Cell C | 1.381 | 19.78 |
| Schizont | Cell D | 1.372 | 16.28 |
| Schizont | Cell E | 1.371 | 15.9 |
Description of malaria samples used
In this study we have investigated four samples of malaria infected red blood cells (RBCs)referred as B, C, D and E cells with respect to sample containing healthy RBCs referred as cell A. Here cells B, C, D and E correspond to different stages of malaria infections with respect to cell A which represents healthy stage. Table 1 gives the refractive index of values of samples containing healthy and malaria infected RBCs obtained. They suggested an optical method based on transport of intensity equation which differentiates between malaria infected and healthy RBCs by combining the topography, three dimensional reconstruction of refractive index and deconvolution of RBCs. Actually RBCs are mixture of 32% of hemoglobin surrounded by 3% membrane and 65% water. RBCs can be considered as an aqueous solution in which hemoglobin is dissolved. Suggested that the change in the hemoglobin concentration within RBCs results the significant change in the refractive index of cells as shown in Table 1. The refractive index and hemoglobin concentration within RBCs are the two essential parameters which are usually used to identify whether or not RBCs belong to healthy or malaria infected person.
In healthy RBCs hemoglobin is one of the major of components of cells. These healthy cells are physically identified by their biconcave shape whose edges are thicker than the middle. The main function of RBC is to maintain flow of oxygen and carbon dioxide inside the human body. Hence if RBCs are healthy it means the flow of O2 and CO2 inside body is perfect. For healthy RBCs the range of hemoglobin concentration of cell A should be between 28 g/dL to 36 g/dL which corresponds to refractive index values between 1.402 to 1.409 respectively. If someone is bitten by the female Anopheles mosquito parasites enter into the body and reached to RBCs through liver. The presence of parasites in RBC sinitiates the biochemical and structural changes of host cells due to which homogeneous structure of cell is lost. Moreover the presence of parasites into the cells also decreases the hemoglobin concentration and refractive index value both of that cell. Therefore the presence of parasites within the various cells is ensured by region having low refractive index. This is the first stage of malaria inflection and called as ring stage. In this stage shape of the RBC remains biconcave and infected cell is named as cell B. After ring stage the malaria inflection reaches to trophozoite stage. In this stage parasites are matures enough and have more intense metabolismbe cause host cells C lost their biconcavity. Finally infection reaches to its prominent stage called as schizont stage. In this stage growth of the parasites reaches to advanced level and the corresponding inflection is called as cell D. By knowing the refractive index and concentration of the cell in RBC one can easily identify the schizont stage of malaria inflection by means of optical route. Generally refractive index and hemoglobin concentration of quasi-identical cells D and E are different even though both are representing the same stage of infection as shown in Table 1.
We have also performed the linear curve fitting as shown in Figure 2 over the data given in Table 1 to extract an expression which gives the hemoglobin concentration (CHb) inside RBC corresponding to the refractive index (nRBC) of the samples depending upon the distribution of cell. It can be clearly seen from Figure 2 that the increase in the refractive index of the cell is due to the increase in the hemoglobin concentration within RBC samples. The red line in Figure 2 is representing liner curve fitting equation obtained from simulated data. The change in hemoglobin concentration within RBC can easily be obtained by putting the value of nRBC in the curve fitting equation given below
CHb = 402.35nRBC − 535.8,(R2=0.9992) (4)
Here R2 represents the square of correlation coefficient which determines the accuracy between the simulated and curve fitting data. The higher value of R2 is always accepted to validate the results.

Figure 2.The diagram showing refractive index of RBC components containing cells A, B, C, D and E dependent upon the hemoglobin concentration of blood.
Initialization of biosensing application of proposed design loaded with water sample
The empty space of defect layer is infiltrated by pure water sample of refractive index 1.333 to initiate the biosensing application of the design. The infiltration of water sample into the cavity of the proposed biosensor results the confinement of light into the cavity region. This confinement of light is appeared as a defect mode of unit transmission inside photonic band-gap of the proposed structure located at 620.9 nm as shown in Figure 3.

Figure 3.Transmission spectra of proposed biosensor loaded with water sample corresponding to thickness of defect layer as dd=300 nm at normal incidence.
For characterization of performance of proposed design one may used the approach suggested by us. For this purpose both the ends of biosensor are connected with single mode fiber through precision positioned. To avoid wave vector criterion associated with the design during measurements the best choice is the selection of single mode fiber (SMF). The white light source is connected to the one end of fiber which is joined with input end of the design. The other end of the fiber connected with output terminal of the proposed design is joined with optical spectrum analyzer (OSA) which projects the output results into monitor via computer. The essential requirements of qualitative setup for characterizing the performance of the proposed biosensing design are being presented in Figure 4 below as per our understanding, though the findings of the proposed work are based on theoretical simulation which has been carried out with the help of transfer matrix method in addition to MATLAB software.

Figure 4.Experimental setup required for the measurement of transmission response
of the biosensor.
Biosensor performance evaluation loaded with different blood samples
In this section preliminary we are highlighting the biosensing capabilities of proposed design loaded with hemoglobin blood samples containing Cell A, Cell B, Cell C, Cell D and Cell E one at a time for the diagnosis of malaria infection. Figure 5 below shows the transmittance spectra of proposed biosensor loaded with different five RBC samples. The defect mode peaks of unit transmission shown in colours blue, black, red, yellow and purple are corresponding to RBC samples containing Cell A, Cell B, Cell C, Cell D and Cell E respectively under investigation. After recording the central wavelength of each defect mode inside PBG with the help of setup described above, we have calculated the sensitivity of design with cavity thickness dd=1000 nm with the help of following equation as:
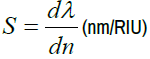 (5)
(5)
Here dλ is representing the change in the position of central wavelength of defect mode associated with the particular sample with respect to water sample and dn is the difference between the refractive index of that sample with water.
The proposed biosensor could only be achieved the maximum sensitivity value of 148.1 nm/RIU corresponding to defect layer thickness dd=1000nm. The high value of sensitivity is always desirable for designing of any high performance photonic biosensor so we have given our efforts to improve the sensitivity further. For this purpose we have randomly chosen some of higher values of cavity thicknesses as dd=2200 nm, 3000 nm and 5000 nm also keeping all other parameters of the design fixed as discussed above. The transmission spectra of proposed biosensing structure corresponding to defect layer thickness dd=2200 nm, 3000 nm and 5000 nm are being plotted in Figure 6- 8 respectively.
The comparison of Figure 5 -8 shows that as the defect layer thickness increases the defect modes corresponding to all five samples shows red shifting. This shifting is between wavelength range 626 nm to 633 nm corresponding to dd=300 nm and 658 nm to 675 nm corresponding to dd=5000 nm respectively. Further increase in the defect layer thickness results the movement of defect modes beyond the 665 nm i.e. outside the PBG extending from 620 nm to 665 nm Figure 3. There is one more common observation that corresponding to defect layer thickness 2200 nm, 3000 nm and 5000 nm the intensity of all defect modes associated with five samples is slightly reduced. However this reduction does not affect the performance of the design due the fact the reduced intensity of defect modes is significantly high in comparison to the threshold limit of the OSA which is used for the detection of defect modes under the influence of different RBC samples. The numeric values of sensitivity of the proposed designs corresponding to cavity thickness dd=1000 nm, 2200 nm, 3000 nm and 5000nm have been summarized in Table 2 below.
| Defect layer thickness (nm) | Sensitivity (nm/RIU) |
|---|---|
| dd=1000 | 141.6 |
| dd=2200 | 248.1 |
| dd=3000 | 303 |
| dd=5000 | 327.7 |
The data presented in Table 2 has been visualized by plotting Figure 9 which shows the dependence of sensitivity on the thickness of defect layer region. Figure 9 shows that as the thickness of defect layer increases from 1000 nm to 3000 nm the sensitivity increases linearly and reaches to 303 nm/ RIU. Further increase in the thickness of defect layer results relatively small change in the sensitivity as shown in Figure 9. The maximum sensitivity of 327.7 nm/RIU is reached corresponding to defect layer thickness of 5000 nm. Thus defect layer thickness of 5000 nm can be considered as optimum thickness under which our design becomes highly sensitive. Additionally corresponding to optimumvalue of defect layer thickness our design is capable of detecting very minute change in refractive index of RBC samples containing Cell B to Cell E with respect to Cell A.

Figure 9. Variation of sensitivity with respect to defect layer thickness.
Evaluation of performance of proposed biosensor corresponding to optimum cavity thickness under normal incidence
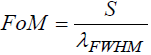
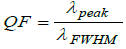 Apart from sensitivity we have also examined to figure of merit (FoM) and quality factor (QF) values of proposed malaria sensor
in true sense. These two parameters are also important while evaluating the
working efficiency of any photonic biosensor. Mathematically we can define
FoM and QF with the help of following expressions as:
Apart from sensitivity we have also examined to figure of merit (FoM) and quality factor (QF) values of proposed malaria sensor
in true sense. These two parameters are also important while evaluating the
working efficiency of any photonic biosensor. Mathematically we can define
FoM and QF with the help of following expressions as:
(6)
and
 (7)
(7)
To conclude our work we have evaluated the S, FoM and QF of the proposed design with optimum cavity thickness of 5000 nm. The numeric values of S, FoM and QF of the proposed design loaded with RBC samples containing Cell B, Cell C, Cell D and Cell E with respect to Cell Aare listed in Table 3 below.
| Blood component | Refractive index | λPeak(nm) | S (nm/RIU) | λFWHM(nm) | FoM | QF |
|---|---|---|---|---|---|---|
| Cell A | 1.408 | 671.4 | --- | 0.11 | --- | 6103.63 |
| Cell B | 1.396 | 667.8 | 300 | 0.036 | 8333.3 | 18550 |
| Cell C | 1.381 | 662.7 | 322.2 | 0.0135 | 23866.7 | 49088.8 |
| Cell D | 1.372 | 659.6 | 327.7 | 0.01 | 32770 | 65960 |
| Cell E | 1.371 | 659.2 | 310.5 | 0.0095 | 32684.2 | 69389.47 |
Table 3. Performance evaluation table showing the numeric values of sensitivity, full width half maximum, figure of merit and quality factor of the proposed biosensor corresponding to different RBC components under optimum condition.
It can easily be observed from the data of Table 3 that the sensitivity of proposed biosensor varies between maximum of 327.7 nm/RIU to minimum of 300 nm/RIU when the cavity is infiltrated with RBC samples containing cell D and cell B respectively. On the other hand FoM and QF varies between 2.3*104 to 8.33*103 and 6.93*104 to 1.85*104 respectively depending upon the nature of malaria samples with respect to water sample. Under the light of above facts we have come to the conclusion that our proposed design can be efficiently used for detection of malaria infection from preliminary stage (ring stage) to advanced stage (schizont stage).
Finally we have given our efforts to compare the findings of proposed blood sensor for malaria detection with the similar kind of work based on various blood sensing applications. This comparison has been presented in Table 4 which highlights the blood sensing applications of various biosensors based on principal of the refractive index sensing mechanism. The proposed biosensor is suitable for sensing and detection of malaria infection from preliminary to advanced stage. The dependence of our approach is based on photonic biosensing technology which makes it suitable for getting rapid, accurate and timely reports to ensure proper diagnosis, treatment and cure.
| Year | Structure details | Type of analyte | S | FoM | QF | Reference |
|---|---|---|---|---|---|---|
| 2019 | 1D PC with graphene coated cavity walls | Blood plasma | 51.49 nm/RIU | NR | NR | 43 |
| 2019 | 2D PC waveguide structure | 10 different blood components | 473.38 | 7324.2 | NR | 44 |
| 2019 | D shaped PC fiber | Blood glucose | 0.83 | NR | NR | 45 |
| 2020 | 1D PC without coated cavity walls | Blood hemoglobin | 141 | 0.48 | NR | 46 |
| This work | 1D PC without coated cavity walls | Red blood cells | 327.7 | 32770 | 69389.47 | --- |
In the present piece of theoretical research work we have explored the sensing and detection capabilities of 1D PC with defect for investigating malaria infection from preliminary to advanced stage by examining the different samples containing red blood cells A, B, C, D and E. We have used transfer matrix formulation under normal incidence condition and MATLAB simulation software to obtain the results pertaining to the work. This study has been carried out corresponding to cavity thicknesses 1000 nm, 2200 nm, 3000 nm and 5000 nm to achieve the optimum biosensing performance. Our study shows that the sensing performance of design becomes maximum corresponding to cavity thickness 5000 nm. The maximum sensitivity value obtained from the structure is 327.7 nm/RIU when the cavity is infiltrated with RBC sample containing Cell D which corresponding Schizont stage of malaria infection. Thus our design can be very useful for identifying the person who has advanced stage of malaria infection due to accuracy in the results. Additionally, the proposed work is based on minute sensing of refractive index of different RBC samples of variation 1.408 to 1.371 corresponding to hemoglobin concentration 30.9g/ dL to 15.9 g/dL respectively. The maximum values of figure of merit and quality factor of proposed biosensing design is 32770 RIU and 69389.7 respectively which is high as expected.
The software handling, results preparation, invistegation and initial manuscript draft preparation have been done by Mr. Sujit Kumar Saini. Conceptualization, methodology, reviewing, editing and supervision have been done under Dr Suneet K Awasthi.
Data Availability Statement
It is not applicable to the present manuscript. The results of the present theoretical work are based on MATLAB simulations. All the relations and other relevant information have been properly cited throughout the manuscript keeping the ease of readers of the journal. The readers can easily reproduce the results of the work with the help of theoretical details given in the manuscript and MATLAB computational software.
Authors do not have any conflict of interest.
This is no funding for the present work.
Google Scholar, Crossref, Indexed at
Google Scholar, Crossref, Indexed at
Google Scholar, Crossref, Indexed at
Google Scholar, Crossref, Indexed at