Review Article - (2021) Volume 12, Issue 5
Received: 06-Sep-2021
Published:
27-Sep-2021
, DOI: 10.37421/2151-6219.2021.12.370
Citation: Srivastava, Dinesh Kumar, Muralikrishna Bharadwaj, Tarrung Kapur and Ragini Trehan. "Revisiting Fiscal Responsibility Norms: A Cross Country Analysis of the Impact of Covid-19." Bus Econ J 12 (2021): 370.
Copyright: © 2021 Bharadwaj M, et al. This is an open-access article distributed under the terms of the Creative Commons Attribution License, which permits unrestricted use, distribution, and reproduction in any medium, provided the
original author and source are credited.
In this paper, we have reviewed the COVID induced shock to the debt and deficit profiles of 10 of the largest economies by size of GDP in 2019 referred to in this paper as the Big-10 economies. There is a sharp upsurge in their government debt-GDP ratios because their policy responses to the COVID induced recession have been large fiscal stimuli based on borrowing. With low and often negative growth rates and high fiscal deficit, the debt-GDP ratios are projected to rise sharply in these economies. As normalcy is restored, these countries may attempt to sharply reduce their borrowing levels relative to GDP. However, we argue that before this is done, individual countries may do well to reassess their sustainability norms whether cast in terms of agreements such as the Maastricht Treaty or country level Fiscal Responsibility Legislations (FRLs) or other similar norms. This revision is called for because of the longer-term trends in these economies of rising money supply, falling nominal interest rates and nominal growth rate. The contribution of this article lies in highlighting that the existing FRL norms have become dated in the European and other similar economies because of significant changes in macro parameters such as the interest rate, the long-term growth rate and the government debt-GDP profiles of these countries as compared to the time when these norms were originally determined. There is thus a need now to redetermine these norms which may be higher than their current levels. Even though, some recent literature suggests that the sustainability benchmarks may have shifted upwards, we argue that the post COVID debt-GDP ratios have exceeded these revised benchmarks by significant margins in the case of a number of the Big-10 economies.
COVID-19 • Government debt • Growth • Inflation • 2008 economic crisis
In order to keep their government Debt-GDP ratios at sustainable levels, many countries have undertaken Fiscal Responsibility Legislations (FRLs) specifying debt-GDP targets consistent with sustainability conditions. An overview of evolution of government debt-GDP ratio indicates that it experiences a one-time upsurge as a result of an economic crisis and tends to remain at the higher level. Policy efforts to bring it down have not been effective particularly because of asymmetry in managing countercyclical fiscal deficit. Fiscal deficit may be increased in crisis years as part of stimulus initiatives in economic downswings, but it is often difficult to bring it adequately down in economic upswings. The impact of Covid-19 on government debt-GDP ratio for most countries is likely to be quite large. It would take considerable reduction in fiscal deficits of future years if the government debt-GDP ratio is to be brought down back to sustainable levels. If governments chose to let their debt-GDP ratios remain at unsustainably high levels, their capacity to deal with future economic crises would be significantly impaired. In this paper, we project the increase in government debt-GDP ratios for selected countries and evaluate the resultant debt- GDP ratios in the context of their fiscal responsibility commitments. We then specify fiscal deficit adjustment paths that would be needed in order to bring the debt-GDP ratios back to sustainable levels. For this purpose, we have selected the following 10 countries: the US (USA), People’s Republic of China (PRC), Japan (JPN), Germany (DEU), India (IND), the UK (GBR), France (FRA), Italy (ITA), Brazil (BRA) and Canada (CAN). This group comprises 3 EU economies and 7 non-EU economies. Together, these constitute the largest economies of the world, accounting for a share of 67.5 per cent (2019) in global GDP (at market exchange rates). We refer to these as the Big-10 group of countries in the rest of the paper.
From the viewpoint of sustainability of government debt relative to GDP in the major global economies, there is a significant research gap pertaining to the following aspects: (a) in spite of major changes in the long term trends concerning growth and interest rates, the validity of existing FRL norms have not been reassessed in the literature; (b) many of the Big- 10 economies do not have suitable fiscal responsibility legislations; and (c) there is no assessment of the extent to which the post Covid government debt-GDP levels would exceed current or revised sustainability norms and the implications of the impact of Covid on global government indebtedness. In partially addressing this research gap, we have argued that the existing FRL norms have become dated in the European and other similar economies because of significant changes in macro parameters such as the interest rate, the long-term growth rate and the government debt-GDP profiles of these countries as compared to the time when these norms were originally determined. There is thus a need now to redetermine these norms which may be higher than their current levels. Even though, some recent literature suggests that the sustainability benchmarks may have shifted upwards, we argue that the post Covid debt-GDP ratios have exceeded these revised benchmarks by significant margins in the case of a number of the Big-10 economies.
Evolution of government debt: 1996 to 2019
In this section, we look at the comparative position of countries with respect to the evolution of their government debt to GDP ratio. This analysis is in terms of debt-GDP ratios where both debt and GDP are in Local Currency Units (LCU). Data for this analysis has been drawn from the International Monetary Fund (IMF). For the period 1996 to 2019, except Canada, the government debt-GDP ratio increased for all selected countries (Table 1). Notably sharp increases were observed for Japan (136.9 percentage points), followed by Brazil (46.3 percentage points), the UK (41.5 percentage points), and the US (40.4 percentage points). The increase in the government-debt GDP ratio was mild for Germany (1.7 percentage points) and India (6.4 percentage points).
| Countries | 1996 | 2005 | 2010 | 2013 | 2019 | 2019-1996 (percentage points) |
|---|---|---|---|---|---|---|
| BRA | 43.2 | 68.6 | 63 | 60.2 | 89.5 | 46.3 |
| CAN | 100.2 | 70.6 | 81.2 | 86.1 | 88.6 | -11.6 |
| PRC | 21.4 | 26.3 | 33.9 | 37 | 52.6 | 31.2 |
| DEU | 57.8 | 67.3 | 82.4 | 78.7 | 59.5 | 1.7 |
| FRA | 60 | 67.4 | 85.3 | 93.4 | 98.1 | 38.1 |
| GBR | 43.8 | 39.6 | 74.6 | 84.2 | 85.4 | 41.5 |
| IND | 66 | 80.9 | 66 | 67.4 | 72.3 | 6.4 |
| ITA | 119.1 | 106.6 | 119.2 | 132.5 | 134.8 | 15.7 |
| JPN | 101 | 176.6 | 207.7 | 232.2 | 238 | 136.9 |
| USA | 68.2 | 65.5 | 95.5 | 104.9 | 108.7 | 40.4 |
| Average | 68.1 | 76.9 | 90.9 | 97.7 | 102.7 | 34.7 |
Note: Brazil (BRA), Canada (CAN), People's Republic of China (PRC), Germany (DEU), France (FRA), United Kingdom (GBR), India
(IND), Italy (ITA), Japan (JPN), United States (USA)
In 1996, three countries, namely Italy, Japan and Canada already had a government debt to GDP ratio which was higher than 100 per cent. Other countries like the UK, Brazil, Germany, France, India and the US had a government debt-GDP ratio in the range of 43.2 per cent to 68.2 per cent. People’s Republic of China’s government debt-GDP ratio at 21.4 per cent was the lowest amongst the selected set of countries. As economies went through different phases of economic crisis and responded to these through fiscal stimulus based on an increase in their fiscal deficits, their government debt to GDP ratio kept increasing. The average government debt to GDP ratio for the Big-10 group of countries was 68.1 per cent in 1996.
By 2005, while the government debt-GDP ratio remained above 100 per cent for Japan and Italy, there was a sharp decline of 29.6 percentage points in this ratio for Canada. In India’s case, the government debt relative to GDP increased from 66 per cent in 1996 to 80.9 per cent in 2005. People’s Republic of China’s government debt-GDP ratio increased only marginally by 4.9 percentage points in 2005.
By 2010, the government debt-GDP ratio surged to 207.7 per cent for Japan and 119.2 per cent for Italy. For the US, there was a massive jump from 65.5 per cent in 2005 to 95.5 per cent in 2010, an increase of 30 percentage points. Some of the other western economies like France, Canada, the UK and Germany also experienced an increase in their government debt to GDP ratios. These countries had borne the brunt of the 2008 crisis. India, however experienced an improvement in its government debt-GDP ratio which fell from 80.9 per cent in 2005 to 66 per cent in 2010, a fall of nearly 15 percentage points. This showed the effect of adherence to the Fiscal Responsibility and Budget Management Act (FRBMA) which was adopted by both the central and state governments during 2003 to 2010.
By 2013, except for Brazil and Germany, there was an increase in the government debt-GDP ratio of all countries. There were sharp increases in the case of Japan, Italy, the UK and the US and relatively milder increases in the case of India, People’s Republic of China and Canada. The government debt-GDP ratio for the US crossed 100 per cent, reaching a level of 104.9 per cent.
By 2019, government debt to GDP ratio had continued to surge in the case of Japan and Italy, reaching a level of 238.0 per cent and 134.8 per cent respectively. There was a sharp increase of 29.3 percentage points and 15.6 percentage points in the government debt-GDP ratio of Brazil and People’s Republic of China. As discussed earlier, the period from 2014 to 2019 was characterized by crises in both these economies.
Composition of debt: Share of government debt in total debt
In this section, we undertake a review of the composition of total debt as divided between government debt and private debt for individual countries.
Table 2 shows that in the Big-10 group of countries, in 1996, the share of government debt in total debt was the highest for India at 71.6 per cent, followed by Italy at 63.8 per cent and Canada at 40.8 per cent. At the lower end, the lowest share of government debt in total debt was for People’s Republic of China at 20.5 per cent, followed by the UK at 27.5 per cent. The average share of government debt in total debt for the selected set of countries was 40.6 per cent in 1996.
| Countries | 1996 | 2005 | 2010 | 2013 | 2019 | 2019-1996 (percentage points) |
|---|---|---|---|---|---|---|
| BRA | 49.2 | 59.7 | 52 | 46.7 | 54.7 | 5.5 |
| CAN | 40.8 | 32.2 | 31.3 | 31.2 | 29.2 | -11.6 |
| PRC | 20.5 | 19.5 | 19.7 | 19.3 | 21.4 | 1 |
| DEU | 33.3 | 35 | 41.7 | 41.6 | 34.2 | 0.9 |
| FRA | 31.6 | 31.1 | 33.1 | 34 | 31.4 | -0.2 |
| GBR | 27.5 | 19.4 | 27.9 | 31.9 | 34.2 | 6.8 |
| IND | 71.6 | 65.3 | 54.2 | 53.1 | 56.7 | -14.9 |
| ITA | 63.8 | 52 | 48.8 | 51.6 | 55.1 | -8.6 |
| JPN | 32.2 | 51.7 | 55.9 | 59.1 | 59.3 | 27.1 |
| USA | 36.1 | 30.3 | 36.4 | 41.1 | 42 | 5.9 |
| Average | 40.6 | 39.6 | 40.1 | 41 | 41.8 | 1.2 |
| Memo:Total debt to GDP ratio | ||||||
| Average | 174.3 | 196.9 | 227.6 | 235.7 | 248.1 | 73.8 |
By 2005, seven out of ten selected countries experienced a decline in their share of government debt in total debt as compared to that in 1996. However, in the case of Japan, Brazil, and Germany, this share increased by 19.5 percentage points, 10.5 percentage points and 1.7 percentage points respectively in 2005. The average share of government debt in total debt for the selected countries fell to 39.6 per cent in 2005.
By 2010, the effect of the 2008 global economic and financial crisis had become visible. The share of government debt in total debt increased in the US, the UK, Japan, Germany, France and People’s Republic of China. However, in Brazil, Italy and Canada, this share fell indicating that the 2008 crisis had led to an even greater increase in private debt. In India also, the share of government debt in total debt fell because of a fall in government debt-GDP ratio and an increase in private debt-GDP ratio.
In 2013, the average share of government debt in total debt increased marginally by 0.9 percentage points to 41 per cent, with five countries showing a decline in this ratio and the remaining five showing an increase. Among selected countries, the sharpest increase of 4.7 percentage points was shown by the US and the sharpest decline of 5.3 percentage points was shown by Brazil.
The composition of debt in 2019 shows that the relative share of government debt increased for seven out of 10 countries as compared to their 2013 levels. Countries which experienced a decline in their share of government debt in 2019 include Germany, France and Canada.
Thus, over the period from 1996 to 2005, there was an increase in the overall debt-GDP ratio of countries in general, but this increase was relatively more for private sector debt whereas the share of government debt in total debt had shown some decline. Between 2005 and 2019, the overall debt-GDP ratio continued to surge, but in this period, the share of government debt in total debt increased on average.
Projecting Covid’s impact on government debt-GDP ratio: 2020 and 2021
In this section, we consider decomposing the change in the government debt-GDP ratio in a country into three factors namely, (1) increased borrowing (fiscal deficit), (2) real growth rate and (3) inflation rate. Change in government debt amounts to a country’s fiscal deficit which is one of the main instruments through which a stimulus is injected in order to overcome an economic crisis.
Change in the government debt-GDP ratio in any year t may be defined as:
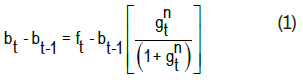
Here, bt and bt-1 denote the debt-GDP ratio in the year t and t-1 respectively. ft is the fiscal deficit to GDP ratio in year t which is defined as change in the level of debt relative to the level of nominal GDP, that is,
gnt Refers to the nominal growth rate which can be expanded as the sum of real growth rate and the inflation rate, that is,
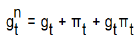
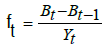
Equation (1) can be written as follows after ignoring the interaction term 
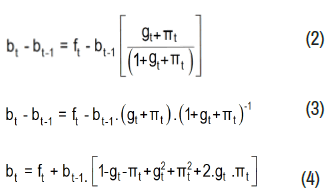
Utilizing equation (4), we project the government debt-GDP levels for 2020 and 2021, using independent projections of fiscal deficit to GDP ratio, real GDP growth and inflation rate in these years. Real GDP growth and inflation forecasts are taken from the October 2020 issue of IMF’s World Economic Outlook (WEO). The fiscal deficit to GDP ratio has been derived by using government debt to GDP ratio and the nominal GDP for these two years as projected by the IMF in its WEO (October 2020). The relevant values of these three determinants over the period from 1997 to 2021 are given in Table 3 and Annexure 1-3.
| Country | 2019 | 2020 | 2021 | 2020 minus 2019 | 2021 minus 2020 |
|---|---|---|---|---|---|
| BRA | 89.5 | 101.4 | 102.8 | 11.9 | 1.4 |
| CAN | 88.6 | 114.6 | 115 | 26 | 0.3 |
| PRC | 52.6 | 61.7 | 66.5 | 9.1 | 4.8 |
| DEU | 59.5 | 73.3 | 72.2 | 13.8 | -1.1 |
| FRA | 98.1 | 118.7 | 118.6 | 20.6 | -0.2 |
| GBR | 85.4 | 108 | 111.5 | 22.7 | 3.5 |
| IND | 72.3 | 89.3 | 89.9 | 17 | 0.5 |
| ITA | 134.8 | 161.8 | 158.3 | 27 | -3.5 |
| JPN | 238 | 266.2 | 264 | 28.2 | -2.2 |
| USA | 108.7 | 131.2 | 133.6 | 22.5 | 2.5 |
| Average | 102.7 | 122.6 | 123.2 | 19.9 | 0.6 |
Table 4 shows the sharp increase in the government debt-GDP ratio in the pandemic affected year of 2020 over 2019. The largest increase is for Japan at 28.2 percentage points, followed by Italy at 27.0 percentage points, Canada at 26.0 percentage points, the UK at 22.7 percentage points and the USA at 22.5 percentage points. The average increase in the government debt-GDP ratio for selected countries in 2020 is estimated at 19.9 percentage points, twice as compared to an increase of 9.7 percentage points following the 2008 global economic and financial crisis.
| Year | BRA | CAN | PRC | DEU | FRA | IND | ITA | JPN | GBR | USA |
|---|---|---|---|---|---|---|---|---|---|---|
| 1997 | 6.6 | 0.2 | 1.3 | 2.2 | 3.3 | 8.3 | 2.7 | 7.2 | 1.5 | 1.6 |
| 1998 | 14.2 | 1.4 | 1.4 | 2.2 | 2.6 | 9 | 2.1 | 10 | -0.4 | 0.3 |
| 1999 | 14.7 | 1.9 | 2.4 | 1.9 | 1.3 | 9.3 | 2.7 | 11.3 | 0.2 | 0.1 |
| 2000 | 4.4 | -0.6 | 3.2 | 0.3 | 1.6 | 8.6 | 1.8 | 8.5 | -0.7 | -2.3 |
| 2001 | 10.3 | 3.7 | 3.8 | 0.6 | 1.7 | 10.7 | 5.1 | 8 | -1.4 | 1.6 |
| 2002 | 16.9 | 1.5 | 3.6 | 2.4 | 3.7 | 9.7 | 1.2 | 8 | 1.6 | 4.1 |
| 2003 | 5.5 | 0.2 | 3.9 | 4 | 5.7 | 10.3 | 2.5 | 5.7 | 3.1 | 5.6 |
| 2004 | 5.3 | 0.6 | 3.6 | 3.1 | 4.3 | 9.5 | 3.8 | 10.6 | 4.6 | 11.1 |
| 2005 | 5.4 | 3.1 | 3.6 | 3.1 | 3.8 | 7.8 | 4.4 | 6.1 | 3.3 | 3.5 |
| 2006 | 4.1 | 2.8 | 3.1 | 2.1 | 0.2 | 7.5 | 4.2 | 0.6 | 3 | 2.4 |
| 2007 | 5.8 | 0.5 | 8.4 | 0.3 | 3 | 7.6 | 1.3 | 0.6 | 3 | 3.3 |
| 2008 | 6.2 | 4.3 | 2.4 | 2.7 | 5.9 | 7.2 | 3.7 | 4.3 | 8.9 | 10.2 |
| 2009 | 7.3 | 7.7 | 9.7 | 4.8 | 12.3 | 7.9 | 6.4 | 5.9 | 12.6 | 11.7 |
| 2010 | 6.9 | 6.5 | 4.5 | 12.8 | 4.7 | 6.9 | 5.1 | 11.2 | 13.4 | 11.9 |
| 2011 | 5.2 | 5.5 | 5.1 | 1.4 | 5.2 | 9.5 | 3.2 | 10.4 | 8.1 | 7.7 |
| 2012 | 6.6 | 6 | 4.1 | 2.8 | 4 | 7.7 | 5 | 8.4 | 5.6 | 7.5 |
| 2013 | 4 | 4.1 | 5.9 | -0.5 | 4 | 7.5 | 5.1 | 7.3 | 4.2 | 5.1 |
| 2014 | 6.8 | 3.5 | 5.8 | 0.1 | 2.9 | 6.1 | 4.1 | 8.4 | 5.6 | 4.1 |
| 2015 | 12.5 | 5.4 | 4.2 | -1 | 2.8 | 8.3 | 2.2 | 3.3 | 3.2 | 4.2 |
| 2016 | 8.9 | 2.1 | 5.8 | -0.5 | 3.9 | 7.2 | 2.7 | 6.9 | 3.3 | 4.8 |
| 2017 | 9.1 | 3.8 | 6.5 | -1.5 | 3.1 | 7.6 | 2.5 | 2.6 | 2.6 | 3.5 |
| 2018 | 7.1 | 2.6 | 6.8 | -1.5 | 2.4 | 7 | 2.9 | 2.5 | 2.4 | 6.6 |
| 2019 | 6.8 | 2 | 7.7 | -0.4 | 2.7 | 7.5 | 1.6 | 4.3 | 2.4 | 5.9 |
| Average (1997 to 2019) | 7.9 | 3 | 4.6 | 1.8 | 3.7 | 8.2 | 3.3 | 6.6 | 3.9 | 5 |
| 2020 | 9.5 | 20 | 10.6 | 11.2 | 12.1 | 12.1 | 12.8 | 15.8 | 16.1 | 19.2 |
| 2021 | 7.3 | 8.7 | 10.5 | 3.2 | 6.9 | 10.1 | 5.9 | 4.6 | 9.5 | 9.1 |
In a recent paper Ramos-Herrera, and Prats (2020) have estimated the sustainable debt-GDP ratio for the European economies at 93 per cent(Table 4). This is based on a Panel-ARDL estimation approach and a dynamic panel-threshold model. In the threshold model a common threshold of 93 per cent was estimated. Table 3 shows that in 2021 except for Germany the European economies as well as Brazil, Japan and USA are well above this threshold. India is very close to it while China is well below it.
Prospects of deficit and debt: Implications for Fiscal Responsibility Legislations (FRLs)
Departures from country-wise deficit and debt norms under FRLs/ benchmarks: Most countries under study have FRLs specifying debt or fiscal deficit limits. These may be under statutory arrangements or other kinds of agreements to ensure sustainability of deficit and debt. For some countries, where such numbers are not available, we have utilized a notional benchmark for debt-GDP ratio as equal to 60 per cent in line with those relevant for the EU countries under the Maastricht Treaty norms. Table 5 summarizes the salient features of FRLs for individual countries under study. It is clear that in the post-COVID situation, most countries would have departed significantly from the relevant debt-GDP norms.
| No. | Country | Statutory basis for FRL | Salient feature |
|---|---|---|---|
| 1 | Germany | Fiscal deficit and debt targets are determined by the Maastricht criteria |
|
| 2 | Italy | ||
| 3 | France | ||
| 4 | India | Fiscal Responsibility and Budget Management Act - 2003 (last amended in 2018) |
|
| 5 | UK | Charter of Budget Responsibility (CBR) – 2016 autumn update |
|
| Fiscal rules as per Budget 2020 |
|
||
| 6 | US | No FRL-Congress sets spending and revenue targets in the annual budget resolution |
|
| 7 | Japan | Fiscal Management Strategy of 2010 |
In and after FY2021, efforts for fiscal consolidation to be continued taking into account, the progress in achieving the debt target |
| Basic Policy on Economic and Fiscal Management and Reform (2018) |
|
||
| 8 | Brazil | Fiscal Responsibility Law (May 2000) |
expenditure limit set at 50 per cent of net current revenue For states and municipalities these are set at 60 per cent of net current revenue |
| 9 | Canada | No FRL – political commitment to reduce debt |
|
| 10 | People’s Republic of China |
No FRL | … |
Departures from benchmark norm of 60 per cent with respect to end-2021 government debt-GDP ratios
Table 6 captures the excess of the projected end 2021 government debt-GDP ratio over the benchmark norm of 60 per cent. The largest deviation is that for Japan at 204.0 percentage points followed by Italy at 98.3 percentage points and the US at 73.6 percentage points. The lowest departure is seen in the case of People’s Republic of China at 6.5 percentage points. followed by Germany at 12.2 percentage points and India at 29.9 percentage points.
| No. | Country | Projected debt-GDP ratio at end-2021 (per cent) | Excess of end-2021 debt-GDP |
|---|---|---|---|
| ratio over benchmark norm of 60 per cent (per cent point) | |||
| 1 | BRA | 102.8 | 42.8 |
| 2 | CAN | 115 | 55 |
| 3 | PRC | 66.5 | 6.5 |
| 4 | DEU | 72.2 | 12.2 |
| 5 | FRA | 118.6 | 58.6 |
| 6 | IND | 89.9 | 29.9 |
| 7 | ITA | 158.3 | 98.3 |
| 8 | JPN | 264 | 204 |
| 9 | GBR | 111.5 | 51.5 |
| 10 | USA | 133.6 | 73.6 |
Restoring sustainability: macro trends and simulations
In this section, we consider policy options available to different countries in order to reach sustainability levels from the projected debt-GDP ratios at the end of 2021. In this context, we consider two simulations. For this purpose, we have utilized alternative paths for the three determinants of the government debt-GDP ratio over the forecast period which extends from 2022 to 2050. These three determinants are (1) fiscal deficit-GDP ratio, (2) Real GDP growth rate, and (3) GDP deflator-based inflation rate.
Simulation 1: In this case, fiscal deficit to GDP ratio, real growth rate and inflation are all kept equal to the average level during the period 2012 to 2019 (Table 7). These conditions indicate the situation of individual countries prior to the Covid crisis but after the 2008 global economic and financial crisis had subsided. The simulation is carried forward up to 2050. The resultant debt-GDP ratio at the end of 2050 is given in Table 8. It is shown that no country other than Germany is able to reach a benchmark level of 60 per cent which is consistent with the Maastricht Treaty norms even after a period of 30 years. In some cases, the departures are quite massive such as Japan (240.4 percentage points), Italy (139.9 percentage points), France (76.7 percentage points), and the US (73.9 percentage points). This indicates that without significant policy changes, much lower fiscal deficits than what has been maintained during 2012 to 2019 would be called for in order to move towards sustainability. In the case of Germany, a less than 60 per cent debt-GDP ratio is reached because there were only two instances of a fiscal deficit during this period and on average, there was a fiscal surplus of 0.3 percentage points of GDP. In fact, if Germany were to incur fiscal deficit as per the Maastricht Treaty norms, its debt position will also become unsustainable. This is shown in Simulation 2.
| Country | 1997 to 2019 | 2012-2019 | ||||
|---|---|---|---|---|---|---|
| Fiscal deficit to GDP ratio | Real GDP growth | GDP deflator- based inflation |
Fiscal deficit to GDP ratio | Real GDP growth | GDP deflator- based inflation |
|
| BRA | 7.9 | 2.3 | 7.4 | 7.7 | 0.3 | 6.3 |
| CAN | 3.0 | 2.4 | 1.9 | 3.7 | 1.9 | 1.4 |
| PRC | 4.6 | 8.9 | 3.0 | 5.9 | 7.1 | 2.2 |
| DEU | 1.8 | 1.4 | 1.2 | -0.3 | 1.4 | 1.7 |
| FRA | 3.7 | 1.6 | 1.3 | 3.2 | 1.2 | 0.9 |
| IND | 8.2 | 6.9 | 5.1 | 7.3 | 6.6 | 4.3 |
| ITA | 3.3 | 0.6 | 1.8 | 3.3 | 0.0 | 1.0 |
| JPN | 6.6 | 0.8 | -0.5 | 5.5 | 1.1 | 0.4 |
| GBR | 3.9 | 2.1 | 1.9 | 3.7 | 1.9 | 1.8 |
| USA | 5.0 | 2.4 | 1.9 | 5.2 | 2.4 | 1.7 |
| Country | Debt level at end 2050 | Departure from Norm (60 per cent) | ||
|---|---|---|---|---|
| Simulation 1 | Simulation 2 | Simulation 1 | Simulation 2 | |
| BRA | 122.4 | 98.7 | 62.4 | 38.7 |
| CAN | 115.1 | 102.2 | 55.1 | 42.2 |
| PRC | 69.3 | 70.9 | 9.3 | 10.9 |
| DEU | 23.3 | 88.2 | -36.7 | 28.2 |
| FRA | 136.7 | 131.7 | 76.7 | 71.7 |
| GBR | 106.9 | 94.5 | 46.9 | 34.5 |
| IND | 76.4 | 63.3 | 16.4 | 3.3 |
| ITA | 199.9 | 193.2 | 139.9 | 133.2 |
| JPN | 300.4 | 242.2 | 240.4 | 182.2 |
| USA | 133.9 | 94.9 | 73.9 | 34.9 |
Simulation 2: This has been carried out with the average levels of growth and inflation rates over 2012 to 2019 but modifying the fiscal deficit to GDP ratio in line with FRL norms or comparable norms in the case where the relevant legislations are not available. Thus, for the European countries, in our study namely, France, Germany, and Italy, it has been kept at 3 per cent of GDP. For other developed countries also, where corresponding norms are not available, we have kept it at 3 per cent of GDP. These countries are Canada, Japan, the UK and the US. For the three emerging market economies namely, Brazil, People’s Republic of China and India, we have kept it at 6 per cent of GDP which is consistent with India’s FRBM. People’s Republic of China and Brazil do not have corresponding norms, but a fiscal deficit to GDP ratio of 6 per cent is close to their average levels over the period 2011 to 2019. The resultant debt-GDP ratio at the end of 2050 for Simulation 2 is summarized in Table 8. It is shown that in this case also, no country is able to reach the benchmark debt-GDP ratio of 60 per cent. In India’s case, it comes close to 60 per cent but still exceeds it.
These two simulations indicate that the FRLs in their present form would leave major global economies with much higher debt-GDP ratios than what can be considered consistent with sustainable levels. This is true of the Maastricht Treaty norms as well as India’s FRBM. In other countries where explicit FRLs do not exist, there is a clear need to consider a policy framework to bring the respective debt-GDP ratios to sustainable levels in the post-Covid world.
In fact, it can be shown that the Maastricht Treaty norms of combining 3 per cent of fiscal deficit-GDP ratio with 60 per cent of debt-GDP ratio had already become outdated even prior to the onset of Covid. With the disturbance caused by Covid, there is hardly any chance for any of these economies to remain consistent with the Maastricht Treaty norms. What will now be required is a modification of the Maastricht Treaty norm itself. The reason is that the real growth rate and the GDP deflator-based inflation rate in historical experience for many of the important European economies have become inconsistent with the implied nominal GDP growth rate of the Maastricht Treaty norms. For examining this, we consider the following framework:
A sustainable combination of debt-GDP ratio (b*) and fiscal deficit to GDP ratio (f*) implies a certain nominal growth rate (gn) which is given by the following relationship:
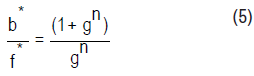
Using b*=60 percent and f*=3 percent, this equation can be solved for deriving the value of gn=5.26 percent.
With European countries having moved into low real GDP growth and low inflation regimes, most countries show a nominal growth rate which is less than the threshold of 5.26 per cent. This is shown in Table 9. In fact, based on the level of historically achieved growth rates, we can divide our sample group of countries into two groups: (a) developed countries, and (b) emerging market economies. The latter group includes Brazil, People’s Republic of China and India.
| Real GDP growth | GDP deflator-based inflation | Nominal growth rate (derived) | |
|---|---|---|---|
| Group 1 | |||
| CAN | 1.93 | 1.37 | 3.33 |
| DEU | 1.40 | 1.72 | 3.14 |
| FRA | 1.21 | 0.86 | 2.08 |
| ITA | 0.00 | 1.03 | 1.03 |
| JPN | 1.09 | 0.42 | 1.51 |
| GBR | 1.90 | 1.75 | 3.68 |
| USA | 2.36 | 1.70 | 4.10 |
| Average | 1.41 | 1.26 | 2.70 |
| Group 2 | |||
| BRA | 0.30 | 6.26 | 6.57 |
| PRC | 7.07 | 2.21 | 9.43 |
| IND | 6.61 | 4.28 | 11.17 |
| Average | 4.66 | 4.25 | 9.06 |
Clearly, the developed countries have moved into a growth and inflation regime which is much different from earlier years. The average nominal growth rate for the countries included in the sample here is only 2.7 per cent during 2012 to 2019. This calls for a reconsideration of the Maastricht Treaty norms and recalibration of country-wise sustainable fiscal deficit and debt combinations. With respect to the European countries, if the benchmark nominal growth rate is kept at 3 per cent, and the fiscal deficit to GDP ratio is also kept at 3 per cent, we can derive the sustainable level of debt-GDP ratio using equation (5) as below:
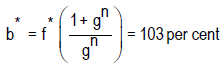
Thus, the European countries should consider debt sustainability as an issue if they are unable to reach even this higher threshold. Here sustainability implies that for a given nominal growth rate, if a fiscal deficit relative to GDP at a given level is repeated year after year, the debt-GDP ratio will remain stable at the level of b*.
Considering the more general case of developed countries in our sample, we may provide a higher threshold for fiscal deficit to GDP ratio at 4 per cent, noting that the average fiscal deficit to GDP ratio for the group of developed countries excluding Germany during 2012 to 2019 was 4.1 per cent. In this case, b*=137.3 percent. Thus, countries that are able to show somewhat higher nominal growth rate may fix their debt-GDP ratio at a higher level.
In the case of emerging market economies however, the fiscal deficit to GDP ratio is higher on average and their nominal growth rate is also higher. This leads to somewhat different results. For the group of three emerging market economies in our sample, the average fiscal deficit to GDP ratio during 2012 to 2019 is 7 per cent, and the average nominal growth is 9.1 per cent. Using 7 per cent for fiscal deficit to GDP ratio, and 9 per cent for nominal growth, b*=84.8 per cent. Thus, these countries should consider uplifting their target debt-GDP ratios from their present levels although keeping it below the target for the group of developed countries.
Figure 1 shows alternative paths of combinations of b* and f* for different values of gn. These are straight lines passing through the origin. If b* is represented on the Y-axis and f* is represented on the X-axis, the slope of the line would be given by:
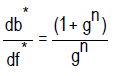

Figure 1. Alternative combinations of b* and f* for different values of gn.
For any given positive value of the nominal growth rate, the RHS will be a constant and higher than 1. As gn is increased, the straight line would shift closer towards the X-axis.
The current Maastricht Treaty benchmark is depicted by the points of intersection of the horizontal line at the debt-GDP ratio of 60 per cent and the vertical line drawn from a fiscal deficit to GDP ratio of 3 per cent. It is shown that if the nominal GDP growth rate in terms of its long-term value has become lower at 3 per cent (real growth of 1 per cent and inflation rate of 2 per cent) as compared to its level for sustainability at 5.2 per cent, then the sustainable combination of fiscal deficit and debt relative to GDP would be given by 3 per cent and 100 per cent respectively. In other words, if many of the developed economies have moved to lower growth and lower inflation trajectories, it would be appropriate to revise the relevant norms under the Maastricht Treaty, or comparable FRLs.
The higher debt-GDP ratio would also be justified by recognizing that the long-term nominal interest rates have also moved down in many of the developed countries including the European economies. This is shown by Figure 2. It shows the downward movement of long-term nominal annual interest rates for the Euro area and selected individual European economies. For the Euro area, in the early 1990s, the nominal interest rate was averaging close to 10 per cent. It has now fallen to close to 0.6 per cent.

Figure 2. Long-term interest rates: Annual.
Note: Euro area
This long-term trend may be affected by a number of factors, but a primary determinant is the steadily expanding money supply in the Euro area. In Figure 3, this is represented by a seasonally adjusted index of broad money, which has increased from a level of 30.6 in 1992 to 114 by 2018 (Index value was 100 in 2015).

Figure 3. Broad money: Euro area.
Debt sustainability
Recent literature on debt sustainability may be broadly divided into two parts. One group of papers focusses on econometric methodologies for assessing debt sustainability with or without some country applications. The second group consists of individual country/country group studies where debt sustainability legislations and empirical trends have been studied.
An important early study by Tapsoba highlighted the importance of fiscal rules in affecting the fiscal policy behaviour of the governments [1]. This paper analyses the effect of National Numerical Fiscal Rules (FRs) upon fiscal discipline in 74 developing countries over the period 1990-2007. The study assesses the impact of FRs on budgetary outcomes while controlling for the self-selection problem by using a variety of propensity scores matching methods. The authors find that the effect of FRs on structural fiscal balance is significantly positive, robust to a variety of alternative specifications, and varies with the type of FRs. They also find that the treatment effect differs according to countries' characteristics such as number of FRs, time length since FRs adoption, presence of supranational FRs, government fractionalisation and government stability. This paper suggests that the introduction of rule-based fiscal policy frameworks is a credible remedy for governments in developing countries against fiscal indiscipline. Further, simple adoption of FRs is not sufficient to guarantee fiscal credibility and fiscal discipline. Their adoption must be accompanied with a set of other measures such as fiscal transparency, fiscal responsibility, enforcement mechanisms, sanctions and independent fiscal institutions (fiscal councils).
Jacobs, et al. has estimated a causal relationship between public debt ratios and economic growth rates for 31 EU and OECD countries for the period from 1995 to 2013 [2]. The authors estimate a panel VAR model that incorporates the long-term real interest rate on government bonds as a vehicle to transmit shocks in both the public debt to GDP ratio and the economic growth rate. It is found that there is no causal link from public debt to growth, irrespective of the levels of the public debt ratio. Rather, there is a causal relationship from growth to public debt. In high-debt countries, the direct negative impact of growth on public debt is enhanced by an increase in the long-term real interest rate, which in turn decreases interest-sensitive demand and leads to a further increase in the public debt ratio.
There are only a few studies relating to debt sustainability in the case of Japan. One such study by Hansen, et al. emphasizes that Japan’s net debt to output ratio at nearly 150 per cent is a significant fiscal burden [3]. In addition, an aging Japanese society implies that public expenditures and transfers payments relative to output are projected to continue to rise until at least 2050. In this paper, the authors use a standard growth model to measure the size of this burden in the form of additional taxes required to finance these projected expenditures and to stabilize government debt. The fiscal adjustment needed is large in the range of 30-40 per cent of total consumption expenditures. It is established that using a distorting tax such as the consumption tax or the labour income tax requires either tax to rise to unprecedented highs. This highlights the importance of considering alternatives that attenuate the projected increases in public spending and/ or enlarge the tax base.
Continuing with the case of Japan, Sakuragawa, et al. have considered the issue of fiscal sustainability in Japan [4]. The authors investigated whether a simulation conducted under the political constraint imposed by a fiscal reaction function supports the official projection and debt sustainability. The methodology involves two steps. First, Japan’s fiscal reaction function is obtained by estimating the response of the primary surpluses to the past debt for a panel data set of 23 OECD countries. Second, political feasibility of the official projection is investigated using the estimated reaction function. The authors find that when the official criterion is used for the debt-to-GDP ratio, the government can attain the policy target of non-negative fiscal surpluses and realize fiscal sustainability. Notably, the negative growth-adjusted bond yield and the high growth rate contribute to this finding. The projected growth rate, growth-adjusted bond yield, and the possible fiscal fatigue in the reaction function influence the findings. It is established that the moderately high growth rate (the baseline scenario) is not enough to support the target of non-negative primary surpluses or to sustain debt. Debt sustainability requires the government to make further efforts to decrease the fiscal deficit at the level of debt over 220 per cent.
Aldama examined the long-term sustainability of public debt in the US under two broad specifications (a) Constant-parameter fiscal policy rules and (b) Markov-switching fiscal rule [5]. Estimates based on constant parameter fiscal rules for the period covering 1940 to 2016, indicated that the government debt was unsustainable in the US. The key reason for such an outcome was attributed to the instability of government's behaviour over time. Their sustainability estimates using Markov-switching fiscal rule identified the presence of two regimes. Under regime 1, the response of primary surplus to lagged public debt was found to be non-significant but positive while under regime 2, there was a strong positive response of primary surplus to lagged public debt indicating fiscal consolidation efforts by the government. However, the sustainable regime appeared less persistent with an expected duration of only 5.7 years as compared to 12.5 years under the unsustainable regime. Their results concluded that the government debt in the US is sustainable in the long run despite persistent unsustainable fiscal regimes.
Cossia analysed the evolution of public debt across European countries, before and after the monetary unification, that is, from 1995 to 2000 and from 2001 to 2014 [6]. Using simple linear regression estimation, the study compared the dynamics of public debt and of general government deficit of selected European countries individually as well as aggregated into two broad groups namely, (a) countries that are part of the European Monetary Union (EMU) and (b) countries outside the EMU. It found a high degree of asymmetry in the evolution of public debt across countries within as well as outside EMU. The study concluded that the asymmetric paths of public debt and of government deficits may have been an important contributor to the rising uncertainties surrounding the growth prospects of the European economies.
In a recent paper, Ramos-Herrera, et al. has estimated the sustainable debt-GDP ratio for the European economies at 93 per cent [7]. This is based on a Panel-ARDL estimation approach and a Dynamic Panel-Threshold model. In the threshold model, a common threshold of 93 per cent was estimated.
Dirk and Paetz argue that the Covid-19 pandemic has revealed the shortcomings of the Euro area, which were already evident after the global financial crisis of 2008-09 [8]. The suspension of the stability and growth pact (SGP) and recent measures of the European Central Bank (ECB) have given some flexibility to the national governments and the central bank to bring about reforms. The three major reform proposals recommended by the authors are: (1) increased investment by the national governments in the ecological reconstruction of their industrial base, (2) reform of the SGP and the Maastricht Treaty, and (3) making government bonds generally riskfree in the Euro area. In the context of reforming the SGP and the Maastricht Treaty, they recommend that the debt-to-GDP ratios could be increased if the ECB secures the solvency of the Euro Area member states. Further, it is observed that deficits are not controlled by national governments and the existing rules bear the risk of a pro-cyclical fiscal policy.
Reconsidering policy options
Four major theoretical positions have informed policy makers in regard to macro-stabilizing policy initiatives and issues of debt sustainability. These are
(i) Ricardian equivalence
(ii) Neo-Classical school,
(iii) Keynesian paradigm in its conventional or modern forms and
(iv) The ‘tax and spend’ school.
Robert, et al. provides an analytical review of the assumptions and the relative merits of these schools of thought [9-12]. Rangarajan and Srivastava have examined this issue in terms of the theories involved and also provided an application in India’s context [13]. Views of economists have remained divided so far. But in practical terms faced with major economic crises, most policy makers become Keynesian in their approach. As shown in our earlier analysis, this becomes quite clear by the noticeable one-time jumps in the fiscal deficit to GDP ratio in crises years. Empirically, policy makers look at the issue of sustainability of debt by reference to the likely long-term path of primary surpluses.
One method of looking at the primary surplus is to make reference to the stream of interest payments. The higher is the interest payment to GDP ratio, the higher is the primary surplus or the lower is the primary deficit relative to GDP given the same level of fiscal deficit. If the long-term trends indicate that the nominal interest rate has fallen over time, then for the same level of debt and fiscal deficit, interest payment to GDP ratio would have fallen and primary deficit relative to GDP would have increased [14-18]. Thus, the sustainability consideration can be linked to the likely contours of interest payment to GDP ratio. The sustainability conditions giving combination of fiscal deficit and debt relative to GDP can be defined in an equivalent manner by making reference to either primary deficit/surplus to GDP ratio or interest payment to GDP ratio [13].
One implication of combining a lower interest rate with a higher debt relative to GDP is that the interest burden on the government as measured by total interest payment on government debt (IPt) relative to GDP may be kept at a given level.
The ratio,  is determined by the product of the average nominal
interest rate (i) and the debt-GDP ratio (bt). Thus, ipt=i*bt can be defined
by a rectangular hyperbola where debt-GDP ratio is on the Y-axis and the
nominal interest rate is depicted on the X-axis (Figure 4). These curves as
shown in Figure 4 depict the same level of interest payment relative to GDP.
They shift upwards for higher values of ipt. When the debt-GDP targets are
moved up, for example, from 60 per cent to 100 per cent, the ipt burden
can remain the same by moving along the curve from A to B. At point B, the
interest rate would have fallen to 1 per cent but this can be combined with a
debt-GDP ratio of 100 per cent.
is determined by the product of the average nominal
interest rate (i) and the debt-GDP ratio (bt). Thus, ipt=i*bt can be defined
by a rectangular hyperbola where debt-GDP ratio is on the Y-axis and the
nominal interest rate is depicted on the X-axis (Figure 4). These curves as
shown in Figure 4 depict the same level of interest payment relative to GDP.
They shift upwards for higher values of ipt. When the debt-GDP targets are
moved up, for example, from 60 per cent to 100 per cent, the ipt burden
can remain the same by moving along the curve from A to B. At point B, the
interest rate would have fallen to 1 per cent but this can be combined with a
debt-GDP ratio of 100 per cent.

Figure 4. Alternative combinations of b* and i for different values of ipt.
In this paper, we have reviewed the Covid induced shock to the debt and deficit profiles of the Big-10 economies. There is a clear upsurge in their government debt-GDP ratios because policy responses of these countries to the Covid induced recession has been large fiscal stimulus based on borrowing. With low growth and high fiscal deficit, the debt-GDP ratios are projected to rise sharply in these economies in 2020 and 2021. As normalcy is restored, these countries may attempt to sharply reduce their borrowing levels relative to GDP. However, we argue that before this is done, individual countries may do well to reassess their sustainability norms whether cast in terms of agreements such as the Maastricht Treaty or country level FRLs or other similar guidelines. This revision is called for because of the longer-term trends in these economies of rising money supply, falling nominal interest rate and nominal growth rate.
Views expressed here are of the authors only
Business and Economics Journal received 6451 citations as per Google Scholar report


