Research Article - (2022) Volume 9, Issue 7
Received: 23-Jun-2022, Manuscript No. jreac-22-67461;
Editor assigned: 25-Jun-2022, Pre QC No. P-67461;
Reviewed: 08-Jul-2022, QC No. Q-67461;
Revised: 14-Jul-2022, Manuscript No. R-67461;
Published:
22-Jul-2022
, DOI: 10.37421/2380-2391.2022.9.381
Citation: Adelowotan, Olusola, Emmanuel Ayodele Oluyemi and Oladotun Wasiu Makinde. “Remediation Potential of Klebsiella Species Isolated from Different Polluted Sites in Ile-Ife, Nigeria.” J Environ Anal Chem 9 (2022): 381.
Copyright: © 2022 Adelowotan O, et al. This is an open-access article distributed under the terms of the creative commons attribution license which permits unrestricted use, distribution and reproduction in any medium, provided the original author and source are credited.
This study evaluated the bioremediation potential of klebsiella species. Different strains were isolated from selected polluted soil using pour plate method and were subjected to various morphological and biochemical tests. The bioaccumulation experiment was done using selected metal salt solution. Heavy metals polluted soil samples were subjected to acid extraction (HCl:HNO3, 3:1 v/v) before the addition and after the removal of each specie to evaluate the residual metal concentrations after remediation using atomic absorption spectrometer. Chemical functional groups present in each species were identified using Fourier Transform Infrared (FT -IR) analysis. The percentage removal efficiency by each strain of metal ion from their salt solution show Klebsiella pneumoniae with 67.19% of Cd, Klebsiella edwardsii with 27.56, 58.30% of Cr and Ni, Klebsiella ozoenae with 67.71, 62.09% of Pb and Cu ions removal. Remediation of polluted soil samples by each Klebsiella species shows effective percentage reduction of metal concentrations in each sample. The Fourier Transform Infrared (FT-IR) analysis of these species affirmed the occurrence of (-OH stretch), (Sp3 –CH stretch), (Sp2 –CH stretch), (C-O stretch), (N-O stretch), (C-Br/Cl/F stretch) which were responsible for both absorption and adsorption mechanisms. The study concluded that Klebsiella species were effective in reducing heavy metals concentration in polluted soil and would be a good alternative to conventional methods.
Accumulation • Bacteria • Heavy metals • Physico-chemical properties • Remediation
Heavy metals are naturally present in the soil at moderate concentrations; increases in their concentrations to toxic level are due to various anthropogenic sources. These high concentrations thus find their way into the plant system through the roots; wash off to surface water and leached into the groundwater. This may lead to poor plants growth, affect soil fertility negatively and its microbial population. Generally, the effects of heavy metals concentrations, whether short or long terms on any environmental media depend on their source, concentration and persistence.
Study area and sampling
Soil sampling was carried out at three different points within a site in Ile-Ife metropolis, South-western part of Nigeria as shown in Figure 1, at a depth of 15cm using soil auger. The samples were mixed thoroughly inside labeled polythene bag and were taken to the laboratory; soil samples for microbial analysis were stored in refrigerator at 4ºC and analyzed within 24 hours (Figure 1).

Figure 1.Map of the Study Area showing sampling points (Google map). (A): Map of Nigeria (B): Map of Osun state (C): Map of Ife Central Local Government.
A: Mechanic workshop opposite O.A.U gate (Road 1), Ife (Lat: 07˚ 29. 776̍, Lon: 004˚ 31. 431ʼ).
B: Ife Iron Smelting Company, Ife (Lat: 07˚ 29. 723', Lon: 004˚ 28. 634̍).
C: Mechanic workshop and scraps dumpsite, Modakeke (Lat: 07˚ 32. 038', Lon: 004˚ 31. 472').
D: O.A.U Dumpsite, Ife (Lon: 07˚ 28. 488', Lat: 004˚ 32. 399').
Sterilization of materials used
All plastics and glassware used in this study were washed with detergent, rinsed with distilled water and soaked in 10% (v/v) HNO3 for 24 hours to avoid metal contamination. Other materials such as slides and spatula were sterilized using 95% ethanol. The inoculating wire loop and needles were sterilized by flaming until red hot in Bunsen flame before and after use.
Physico-chemical parameters of soil samples
Determination of soil organic carbon and matter (Walkley-Black method): One gram of dried soil sample was weighed into a 500 mL Erlenmeyer flask, followed with the addition of 10 mL of 1M K2Cr2O7 by means of a pipette and 20 mL of concentrated H2SO4 by means of dispenser and was swirled gently to mix for a minute. The solution was allowed to stand for 30 minutes and diluted with 200 mL of distilled water, followed with 10 mL of 85 percent H3PO4, using a suitable dispenser and 0.2 g of NaF. After which, 1 mL of diphenylamine indicator was also added. The whole solution was titrated against 0.5 M ferrous ammonium sulphate. The colour of the solution shifted from the yellow-orange to dark green at the end-point.
Organic carbon and organic matter percentages were calculated using the formula below:
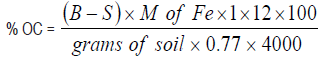
B = mL of Fe2+ solution used to titrate blank. S = mL of Fe2+ solution used to titrate sample.
12/4,000 = milliequivalent weight of C in grams. 1/0.77 = is the factor of converting oxidizable organic C to total C
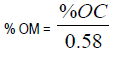
1/0.58 is the factor for converting carbon to organic matter.
Determination of pH: Twenty cm3 of distilled water was added to twenty grams of air-dried soil sample. The mixture was left for 30 minutes with occasional stirring using a glass rod. The pH was determined using model 3310 pH meter (Jenway Ltd, Dunmow, UK). The glass electrode pH meter was calibrated with buffer solutions of pH 4, 7 and 10 for the determinations. The electrode of the calibrated pH meter was inserted into the partly settled suspension and the pH was recorded, the reading was taken twice [1].
Determination of soil water content: Fifty gram of field-moist soil samples containing particles of a diameter <2 mm was weighed into a container and transfer into an oven for 16 hours at a constant temperature of 105ºC, the container was cooled in a desiccator for at least 45 min and the mass of the container with the dry sample was weighed until a constant weigh was achieved. The moisture content was calculated as follows:
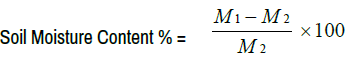
M1 = mass of field-moist soil (g), M2 = mass of oven-dried soil (g)
Determination of soil particle size analysis (Hydrometer Method): Fifty gram of air dried 2 mm sieved soil sample was weighed into a dispersing bottle and 100 mL of 0.2 M NaOH was added, covered tightly and was shake for about 5 minutes to equilibrate. The sample bottles were transferred to a reciprocating shaker and agitated for 16 hours and the mixture was transferred into 1000 mL glass cylinder and distilled water was added to made up to mark. Plunger was used to agitate and brought the soil particles into suspension and the hydrometer was slowly lower into the suspension until it is floating. The first reading on the hydrometer (H1) was taken at 40 seconds after the cylinder was set down, the hydrometer was removed and the temperature (T1) of the suspension was taken with a thermometer. The first reading measures the percentage of silt and clay in suspension. The second reading was taken after 3 hours which measured the percentage of clay in the suspension (H2 and T2). Note: Temperature correction to be added to hydrometer reading =0.36 (T-20), where T= degree centigrade.
Calculations:
A. %Sand = 100.0 – 2 (H1 – B1 + 0.36 (T1 – 20))
B. %Clay = 2 (H2 – B2) + 0.36(T2 – 20)
C. %Silt = 100.0 – (%sand +%clay)
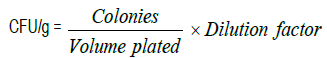
Estimation of total heterotrophic bacterial (THB) count: According to Pour plate method, one gram of each soil samples was suspended in 10 mL of sterile distilled water in test tubes and mixed thoroughly. Ten folds serial dilutions of soil solution were made in a set of test tubes, each containing 9 mL of sterile distilled water. One millilitre (1 mL) of each dilution was pipetted into sterile petri dish after which 20 mL of molten nutrient agar (NA) was poured. The plates was swirled gently and allowed to set. The cultured plates were incubated at 35ºC for 36 to 48 hours. The plate having colonies between 30 and 300 was selected for counting. The average viable count was multiplied by the dilution factor and expressed as number of colony forming unit per gram of sample (cfu/g).
Biochemical characterization and identification of isolated bacteria: Identification of isolates were based on conventional biochemical tests and compared to Bergey‟s Manual of Systematic Bacteriology [2]. These are: Triple sugar ion test, Sulphide-indole-motility test, Catalase test, Citrate utilization test, Methyl red test, Voges-proskauer test, Nitrate reduction, Oxidation fermentation test, Oxidase test, Sugar fermentation test.
Determination of minimum inhibitory concentration (MIC): Minimum Inhibitory Concentration (MIC) is the lowest concentration of an antimicrobial agent that restrains the visible growth of microorganisms. To evaluate the heavy metals resistance capability of each species, procedures according to Sujitha D, et al. [3] was adopted with some modifications. Heavy metals salts solution of the following compounds: CuSO4.5H2O, CrO3, 3CdSO48H2O, Pb(NO3)2 and NiCl2.6H2O were added separately to nutrient agar media and by gradually increasing their concentration by 20 ppm until each strains failed to grow on the media. A sterile wire loop was used to collect a loopful of 24 hours old of each pure isolate and directly streaked on the surface of the heavy metal incorporated nutrient agar starting with 20 ppm for each of the metal salts solution. The isolates were incubated individually on a plate at 37°C for 24 hours. After the incubation period, the plates were observed for growth, if any, the bacterial isolates were streaked on fresh nutrient agar with increasing concentration of each salt solution by 20 ppm, until each isolate fail to grow. Thus, the last concentration of heavy metal incorporated nutrient agar that restricted visible growth of each isolate was taken as the minimum inhibitory concentration values for each of the isolates. The experiment was done in duplicates.
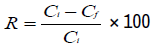
Heavy metal bioaccumulation experiment: This was done based on the procedure of Varghese R [4] with some modifications. Sterilize 8 mL each of 30 ppm of selected salts solution of NiCl2.6H2O, Pb(NO3)2, CuSO4.5H2O, CrO3, 3CdSO4.8H2O mixed with nutrient broth in a set of test tubes at 121ºC using autoclave were inoculated with 2 mL each of the standardized inoculum. The solutions in test tubes were incubated for 14 days; cells were separated from the solution by centrifuging at 4000 r.p.m for 30 minutes (using 800 D centrifuges), and filtered with 0.45 μm millipore filter paper. Each isolate in different test tubes was washed with sterile distilled water and added to their respective supernatants collected, which were made up 15 mL for Atomic Absorption Spectrometer. Bioaccumulation and Percentage removal efficiency for each isolate:
Ca= Concentration of metal ion accumulated by each isolate cell (mg/l)
Ci= Initial metal ion concentration before addition of isolate cell (mg/l)
Cf= Final metal ion concentration after removal of isolate cell (mg/l)
R= Percentage Removal Efficiency
Extraction of heavy metal concentration from polluted soil: Method proposed by Abbruzzini.TF et al [7] with modifications was used, one gram from each soil samples was weighed into a 50 mL beaker, to which 20 mL of aqua regia (HCl:HNO3, 3:1, v/v) was added and was left to sit overnight . The solution was gradually heated to a reduced volume; an additional 10 mL of aqua regia was added and heated to evaporate off to a reduced volume. The digested solution was cooled with distilled water, filtered with whatman filter paper and were made up to 30 mL in air tied bottles for heavy metals determination of Cd, Cr, Cu, Pb and Ni concentrations using Atomic Absorption spectrophotometer.
Remediation of heavy metal polluted soil: Eight mL solution of nutrient broth was added to 1g of each polluted soil samples in different test tubes and was sterilized by autoclaving at 121°C. Two milliliter (2 mL) each of the standardized inoculum was added to each test tube containing sample solution. All test tubes were incubated for 14 days at 37°C. To separate cells from soil particles, the suspended cells were filtered with 0.45 μm millipore filter paper. The supernatant was added back to the soil solution and subjected to gradient centrifugation at 500 r.p.m for 10 minutes to releasing the entrapped isolate cells within the soil aggregates on the basis of sedimentation rate [8], after which the re-suspended cells were filtered again. The supernatant was added back to the soil solution and was subjected to acid extraction ʽaqua regiaʼ (HCl and HNO3, 3:1) to determine the concentration of heavy metals after remediation. Each digested solution was cooled with sterile distilled water, filtered with whatman filter paper and made up to 30 mL in air tight bottles for determination of Cd, Cr, Cu, Pb and Ni concentration using atomic absorption spectrophotometer.
Fourier transform infrared analysis of klebsiella species grown in nutrient broth: Two mL of standardized 24 hours culture of klebsiella species were added separately to 8 mL sterile nutrient broth solution in different test tubes. These isolates were left to grow. Each mixture was centrifuged at 4000 r.p.m for 20 minutes, decanted and washed with sterile distilled water. The grown isolates in their respective test tubes were dried in oven at 100°C to obtained dry biomass which were analyzed for their chemical functional groups using Fourier Transform Infrared spectrometer.
Fourier transform infrared analysis of klebsiella species grown in nutrient broth containing mixture of heavy metal solution: Ten milliliters each of 20 ppm of the following metal salt solution: NiCl4.6H2O, 3CdSO4.8H2O, CuSO4.5H2O. CrO3, Pb(NO3)2 were mixed in a beaker and appropriate amount of nutrient broth was added. Eight milliliters was withdrawn from the solution into different test tubes and were sterilized at 121°C then 2 mL each of klebsiella species were added to each tube. The setup was left to grow. The isolates solutions were then centrifuged at 4000 r.p.m for 20 minutes, decanted and washed with sterile distilled water. The grown isolates in their respective test tubes were dried in oven at 100°C to obtained dry biomass which were analyzed for their chemical functional groups using Fourier Transform Infrared Spectrometer.
Organic carbon and matter of polluted soil samples
The results of soil organic carbon and matter shown in Figure 2 revealed that soil sample from mechanic workshop opposite OAU school gate (Road 1) has 3.14 and 5.40% of organic carbon and matter. Sample from mechanic/ metals scraps dumpsite at Modakeke has 2.96 and 5.09% of organic carbon and matter. These two sites have higher percentages of organic carbon and matter than other sites. Higher organic carbon and matter percentages in these two sites could be due to series of similar activities on these sites which include changing of automobile used engine oil, painting automobile parts, refilling of break oil, lubricating oil and power steering oil which could spill or even be disposed on the soil, thus increasing the soil organic carbon level. These contents are known to contain chemical compounds such as benzene, polycyclic aromatic hydrocarbons (PAHs), polychlorinated biphenyl (PCBs) and heavy metals (Cr, Cd and Pb) etc. [9]. This observation corroborated Olayinka OO, et al. [10] which reported higher organic carbon and matter in polluted sites compared to control site due to input and accumulation of pollutants on these sites (Figure 2).

Figure 2. Percentage organic carbon and organic matter of polluted soil samples.
Moisture content, pH and particle size analysis of polluted soil samples
Table 1 shows the assessment of moisture content, average soil pH and particle size of each soil samples. The pH of the soil samples in this study were observed to be less than 7.0, indicating slightly acidic in nature which can be attributed to the effect of waste received on daily basis. Samples from the two mechanic workshops sites have much lower pH compare to other sites which could be as a result of decomposition of high organic carbon and matter in these two sites resulting in the released of carbon (iv) oxide which reacts with water to for carbonic acid that ultimately lower the soil pH [10]. The mean pH values obtained from this study concurred with the study of Dauda MS, et al. [11] that polluted soil is mostly acidic.
| Polluted Soil Samples | Soil pH | % Moisture | Soil Particle | ||
|---|---|---|---|---|---|
| % Clay | % Sand | % Silt | |||
| Mechanic opp. O.A.U school gate (Road 1) | 6.07 ± 0.03 | 6.38 ± 1.04 | 8 | 70 | 22 |
| Ife Iron Smelting Company, Ife | 6.38 ± 0.04 | 19.05 ± 2.02 | 16 | 68 | 16 |
| Mechanic and metallic scraps dumpsite, Modakeke. | 6.04 ± 0.06 | 8.70 ± 1.30 | 12 | 62 | 26 |
| O.A.U Dumpsite, Ife | 6.20 ± 0.07 | 21.95 ± 1.65 | 18 | 52 | 30 |
Soil samples from O.A.U dumpsite and Ife iron smelting company had higher percentages of soil moisture content compare to other sites. Apart from these sites being closer to stream which may account for their high moisture content, the sites also have high clay particle sizes which could also be responsible for high moisture retention ability. The lower percentages of soil moisture content of samples from the two mechanic sites could probably due to the presence of engine oil, petrol and lubricant oil on soil during various mechanical activities. Used engine oil is known to increase soil bulk density, decreases its water holding capacity and causes aeration inclination, due to its high molecular compounds and additives [12].
The results obtained from the four soil samples reveal the dominance of sand fraction. Samples from OAU dumpsite and Ife iron smelting company have greater fractions of clay particles compared to other site which is responsible for their high moisture content. Clay possesses numerous pores which are responsible for holding water. Generally, the dominance of sand fraction in this study is in agreement with Amos-tautua BMW, et al. [13] which reported high percentage sand fraction in waste dumpsite and also Egharevba F, et al. [14] which reported lower percentage clay fraction in industrial waste soil sample. Due to high sand fraction in these sites, leaching of heavy metals and other pollutants into groundwater system is possible (Tables 1 and 2).
| Code | CS | GR | CT | TSI | SIM | CTU | MR | VP | GLU | MAL | MAN | SUC | LAC | OF/NL | NR | Organism |
|---|---|---|---|---|---|---|---|---|---|---|---|---|---|---|---|---|
| A | MLR | - | ++ | YG.NC.NC | -- - | - | - | + | YG | YG | YG | YG | YG | F | ++ | Klebsiella edwardsii |
| B | SR | - | + | NC.NC.NC | -- - | + | + | - | NC | NC | NC | NC | NC | F | + | Klebsiella pneumoniae |
| C | SR | - | + | YG.NC.NC | +- - | - | - | + | YG | YG | YG | YG | YG | F | + | Klebsiella oxytoco |
| D | LR | - | + | Y.NC.NC | - - | - | - | + | Y | NC | NC | NC | NC | F | ++ | Klebsiella ozoenae |
Minimum inhibitory concentration (MIC) of Klebsiella isolates to heavy metal salts solution
The isolates degrees of resistance to the five selected heavy metal salts solution; 3CdSO4.8H2O, CrO3, CuSO4.H2O, NiCl2.6H2O and Pb(NO3)2 are shown in Table 3 . These results were obtained due to no noticeable growth of each isolates on the nutrient agars incorporated separately with heavy metals salt solution. Klebsiella pneumoniae had the highest resistivity to cadmium and nickel metal ions while Klebsiella edwardsii had the highest resistivity to chromium ion. Klebsiella oxytoca had the highest resistivity to copper and lead ions. Their resistance capability decreased as the concentration of each metal was increased leading to limitation in growth and eventually death. Different resistivity levels shown by klebsiella strains could be as a result of different sites of isolation couple with the degree of pollution in which each strain was exposed to before isolation. Other reasons might be due to the ability of each strain to modify their morphologies in response to environmental cues and their biochemical compositions (Table 3).
| Code | Name of Organisms | Metal salts solution (ppm) | ||||
|---|---|---|---|---|---|---|
| Cd | Cr | Cu | Ni | Pb | ||
| A | Klebsiella edwardsii | 280 | 760 | 880 | 940 | 820 |
| B | Klebsiella pneumoniae | 540 | 460 | 780 | 980 | 640 |
| C | Klebsiella oxytoca | 420 | 620 | 900 | 940 | 840 |
| D | Klebsiella ozoenae | 140 | 520 | 680 | 920 | 660 |
Accumulation and percentage removal efficiency of heavy metals by Klebsiella species from respective metal salt solution
Table 4 shows the accumulated concentration of selected metal ions from their respective salt solution by each Klebsiella species. Klebsiella pneumonniae was most effective in the accumulation of cadmium ion with a percentage removal efficiency of 67.19%., while Klebsiella oxytoca had the highest accumulation of chromium ion with a percentage removal efficiency of 27.56%. Klebsiella edwwardsii was the most effective in the accumulation of copper and nickel ion from their corresponding solution with a percentage removal efficiency of 58.26 and 58.30%.
| Isolate | Cd(Ci – Cf )mg/l | Cr(Ci-Cf) mg/l | Cu(Ci-Cf) mg/l | Pb(Ci-CF) mg/l | Ni(Ci-Cf) mg/l |
|---|---|---|---|---|---|
| Klebsiella edwardsii | 19.448 ± 0.17 | 8.118 ± 0.22 | 15.558 ± 0.20 | 18.770 ± 0.20 | 16.633 ± 0.17 |
| Klebsiella pneumoniae | 19.965 ± 0.22 | 4.539 ± 0.24 | 14.046 ± 0.20 | 11.875 ± 0.17 | 8.200 ± 0.17 |
| Klebsiella oxytoca | 19.566 ± 0.24 | 7.809 ± 0.22 | 15.398 ± 0.20 | 18.290 ± 0.17 | 12.552 ± 0.14 |
| Klebsiella ozoenae | 16.637 ± 0.39 | 7.729 ± 0.24 | 16.581 ± 0.17 | 20.469 ± 0.14 | 12.309 ± 0.17 |
| Initial Concentration(Ci) | 29.714 ± 0.02 | 29.458 ± 0.03 | 26.704 ± 0.02 | 30.231 ± 0.01 | 28.530 ± 0.01 |
Klebsiella ozoenae was most impressive in the accumulation of lead ion with a percentage removal efficiency of 67.71%. This is in agreement with Scott and Palmer 1990, which observed the accumulation of cadmium ion in capsular material of Klebsiella specie. The effectiveness of Klebsiella species in this study is in accord with Aransiola EF, et al. [15] that shows the bioaccumulation and remediation potential of various Klebsiella species isolated from diesel polluted soil (Table 4).
Remediation of heavy metals polluted soil sample from mechanic site opp. O.A.U school gate (road 1)
Table 5 shows the percentage reduction of metals ions concentration by each klebsiella species in soil sample from mechanic workshop opposite O.A.U school gate (Road 1). The highest reduction of copper, lead and nickel ions in the soil sample was affected by Klebsiella pneumoniae with 55.64, 15.84 and 55.57% respectively. Utmost decrease of chromium ions was achieved by klebsiella ozoenae with 20.05% reduction. All the species reduced cadmium ion to a non-detected levels in the soil sample solution.
| Cu(µg/g) | Cr(µg/g) | Cd(µg/g) | Pb(µg/g) | Ni(µg/g) | |
|---|---|---|---|---|---|
| Klebsiella edwardsii Final concentration(Cf) Percentage reduction |
71.09 ± 0.04 34.97 |
125.84 ± 0.13 14.17 |
ND | 432.09 ± 0.18 1.44 |
14.01 ± 0.03 44.67 |
| Klebsiella pneumonia Final concentration(Cf) Percentage reduction |
48.49 ± 0.08 55.64 |
137.07 ± 0.06 6.51 |
ND | 368.96 ± 0.11 15.84 |
11.25 ± 0.02 55.57 |
| Klebsiella oxytoca Final concentration(Cf) Percentage reduction |
64.53 ± 0.08 40.97 |
119.52 ± 0.06 18.48 |
ND | 401.84 ± 0.15 8.34 |
23.97 ± 0.06 5.33 |
| Klebsiella ozoenae Final concentration(Cf) Percentage reduction |
73.01 ± 0.05 33.21 |
117.23 ± 0.12 20.05 |
ND | 420.93 ± 0.06 3.99 |
24.33 ± 0.04 3.91 |
| Initial concentration(Ci) | 109.32 ± 0.13 | 146.62 ± 0.06 | 0.93 | 434.41 ± 0.08 | 25.32 ± 0.02 |
Remediation of heavy metals polluted soil sample from Ife iron smelting industry, Ile-Ife
Table 6 shows the percentage reduction of metals ions concentration in soil sample from Ife iron smelting industry by each klebsiella species. The peak reduction of copper ion was effected by Klebsiella oxytoca with 35.18% while the highest percentage reduction of chromium, cadmium and lead ions was achieved by Klebsiella pneumoniae with 43.22, 40.77, and 19.13% respectively. The highest reduction of nickel ion was caused by Klebsiella edwardsii with 38.53% reduction.
| Cu(µg/g) | Cr(µg/g) | Cd(µg/g) | Pb(µg/g) | Ni(µg/g) | |
|---|---|---|---|---|---|
| Klebsiella edwardsii Final concentration(Cf) |
491.07 ± 0.14 | 150.32 ± 0.05 | 6.08 ± 0.02 | 700.01 ± 0.05 | 98.63 ± 0.03 |
| Percentage reduction | 13.19 | 36.35 | 29.38 | 9.13 | 38.53 |
| Klebsiella pneumonia Final concentration(Cf) |
388.01 ± 0.03 | 134.10 ± 0.06 | 5.10 ± 0.02 | 622.98 ± 0.02 | 111.09 ± 0.02 |
| Percentage reduction | 31.41 | 43.22 | 40.77 | 19.13 | 30.77 |
| Klebsiella oxytoca Final concentration(Cf) |
366.69 ± 0.05 | 215.78 ± 0.07 | 5.60 ± 0.01 | 690.32 ± 0.04 | 110.18 ± 0.01 |
| Percentage reduction | 35.18 | 8.64 | 34.96 | 10.39 | 31.33 |
| Klebsiella ozoenae Final concentration(Cf) |
455.66 ± 0.13 | 229.60 ± 0.09 | 6.02 ± 0.02 | 700.80 ± 0.02 | 117.18 ± 0.02 |
| Percentage reduction | 19.45 | 2.79 | 30.08 | 9.03 | 26.97 |
| Initial concentration(Ci) | 565.71 ± 5.81 | 236.18 ± 0.11 | 8.61 ± 0.02 | 770.34 ± 0.03 | 160.46 ± 0.02 |
Remediation of heavy metals polluted soil sample from mechanic and scraps dumpsite, modakeke- Ile-Ife
Table 7 shows the percentage reduction of metals concentrations in soil sample from mechanic and scraps dumpsite, Modakeke-Ife by each Klebsiella species. The highest reduction of copper, chromium and cadmium ions in the sample solution was effected by Klebsiella pneumoniae with 55.98, 48.41and 59.03% reduction respectively. The utmost percentage of lead and nickel ions reduction was affected by Klebsiella edwardsii with 18.70 and 50.52% reduction in the soil sample solution.
| Cu(µg/g) | Cr(µg/g) | Cd(µg/g) | Pb(µg/g) | Ni(µg/g) | |
|---|---|---|---|---|---|
| Klebsiella edwardsii Final concentration(Cf) |
6638.52 ± 0.09 | 55.37 ± 0.04 | 11.96 ± 0.02 | 3509.63 ± 0.02 | 90.56 ± 0.02 |
| Percentage reduction | 25.92 | 36.48 | 46.03 | 18.70 | 50.52 |
| Klebsiella pneumonia Final concentration(Cf) |
3945.03 ± 0.02 | 44.97 ± 0.02 | 9.08 ± 0.01 | 3653.86 ± 0.01 | 128.14 ± 0.01 |
| Percentage reduction | 55.98 | 48.41 | 59.03 | 15.36 | 29.99 |
| Klebsiella oxytoca Final concentration(Cf) |
7012.83 ± 0.06 | 66.00 ± 0.01 | 14.27 ± 0.01 | 3810.14 ± 0.03 | 112.83 ± 0.04 |
| Percentage reduction | 21.74 | 24.29 | 35.60 | 11.74 | 38.35 |
| Klebsiella ozoenae Final concentration(Cf) |
7807.80 ± 0.10 | 77.85 ± 0.02 | 16.86 ± 0.02 | 4232.43 ± 0.01 | 115.76 ± 0.05 |
| Percentage reduction | 12.87 | 10.69 | 23.92 | 1.96 | 36.75 |
| Initial concentration(CI) | 8961.47 ± 0.15 | 87.17 ± 0.08 | 22.16 ± 0.08 | 4316.94 ± 0.11 | 183.03 ± 0.13 |
Remediation of heavy metals polluted soil sample from O.A.U campus dumpsite, Ile-Ife
Table 8 shows the percentage reduction of metals concentrations in soil sample from OAU campus dumpsite by each Klebsiella species. The highest percentage reduction of copper and lead ions in the soil sample solution was by Klebsiella ozoenae with 43.27 and 39.36% decline respectively. The highest percentage reduction of chromium and cadmium ions reduction was by Klebsiella pneumoniae with 42.61, 30.17% decrease. The highest percentage reduction of nickel ion was effected by Klebsiella edwardsii with 59.95% decline.
| Cu(µg/g) | Cr(µg/g) | Cd(µg/g) | Pb(µg/g) | Ni(µg/g) | |
|---|---|---|---|---|---|
| Klebsiella edwardsii Final concentration(Cf) |
510.57 ± 0.02 | 44.29 ± 0.06 | 25.52 ± 0.04 | 354.19 ± 0.02 | 22.55 ± 0.01 |
| Percentage reduction | 1.57 | 12.59 | 10.27 | 5.34 | 59.95 |
| Klebsiella pneumonia Final concentration(Cf) |
3945.03 ± 0.02 | 44.97 ± 0.02 | 9.08 ± 0.01 | 3653.86 ± 0.01 | 128.14 ± 0.01 |
| Percentage reduction | 55.98 | 48.41 | 59.03 | 15.36 | 29.99 |
| Klebsiella oxytoca Final concentration(Cf) |
501.18 ± 0.04 | 43.08 ± 0.04 | 24.56 ± 0.01 | 368.57 ± 0.10 | 46.53 ± 0.02 |
| Percentage reduction | 3.38 | 14.98 | 13.64 | 1.50 | 17.35 |
| Klebsiella ozoenae Final concentration(Cf) |
294.31 ± 0.01 | 33.35 ± 0.01 | 22.62 ± 0.03 | 226.90 ± 0.07 | 24.74 ± 0.04 |
| Percentage reduction | 43.26 | 34.18 | 20.46 | 39.36 | 56.06 |
| Initial concentration(Ci) | 518.70 ± 0.17 | 50.67 ± 0.11 | 28.44 ± 0.10 | 374.18 ± 0.25 | 56.30 ± 0.04 |
Generally, adsorption and absorption processes of these isolate from soil solution were encouraged due to their increase in surface area during growth coupled with the availability of nutrient (nutrient broth) within the polluted soil solution. A primary action by bacterial isolate to refrain from been affected from metal ions is to first prevent ions from getting into the cell and keep them out of target sites within their cell through adsorption on the cell surface which enable interactions between the metal and the functional groups of the cell wall, secretion of viscous slime outside the cells which enable transformation of these ions (precipitation or complexation). Due to longer duration of bacterial isolate within polluted soil solution, it also involves in intracellular Sequestration with the help of cysteine-rich low molecular weight proteins and metal efflux mechanism [16] (Tables 5-8).
Infrared spectrum of Klebsiella edwardsii grown in nutrient broth
The spectrum of klebsiella edwardsii in Figure 3A shows a broad band at 3280 cm-1 indicating a OH stretching of alcohol. Bands at 2940 cm-1 and 2832 cm-1 represent Sp3 C-H stretching of alkane while peak at 1625 cm-1 indicates C=C stretching of alkene. Band at 1401 cm-1 and a sharp peak at 1021 cm-1 indicate OH bending of alcohol and C-N stretching of amine respectively. Band at 622 cm-1 indicates C-Br stretching of halo-compound [17].
Infrared spectrum of Klebsiella edwardsii grown in nutrient broth containing mixture of heavy metal solution
The spectrum of klebsiella edwardsii isolate from Figure 3B shows a shift broad absorption band at 3347 cm-1 signifying OH stretching of alcohol as a result of deprotonation. Absorption band at 2974 cm-1 indicate Sp3 C-H stretching of alkane. A weak band at 2117 cm-1 indicating C≡C stretching of alkyne and band at 1640 cm-1 represents a C=C stretching of alkene which could be as a result of metal alkyl complex formation. New bands at 1382 cm-1 and 1304 cm-1 indicate OH bending of phenol and band at 812 cm-1 indicate C=C bending of alkene which could also be as result of metal bonding formation. Band at 629 cm-1 signifies C-Br/Cr/F stretching of halo-compound [17] (Figures 3A and 3B).

Figure 3. A) Infrared spectrum of pure Klebsiella edwardsii grown in nutrient broth and B) infrared spectrum of Klebsiella edwardsii grown in nutrient broth containing mixture of heavy metals solution.
Infrared spectrum of Klebsiella pneumoniae grown in nutrient broth
The spectrum of Klebsiella pneumoniae isolate on Figure 4A shows a broad peak 3347 cm-1 indicating a OH stretch of alcohol with bands at 2959 cm-1 and 2922 cm-1 signifying Sp3 CH stretches of alkane, while 1636 cm-1 indicates C=C stretch of alkene. Band at 1558 cm-1 signifys N-O stretching of nitro compound while 1401 cm-1 stretching indicates S=O of sulfonyl chloride. Weak band at 1088 cm-1 signifies C-O stretching of alcohol while 980 cm-1 indicate C-Br/Cl/F of halo compound [17].
Infrared spectrum of Klebsiella pneumoniae grown in nutrient broth containing mixture of heavy metal solution
The spectrum of Klebsiella pneumoniae on Figure 4B shows a shift of broad peak at 3280 cm-1 indicating a OH stretching of alcohol as a result of deprotonation of hydroxyl group for metal bonding. A weak band at 2978 cm-1 signifying C-H stretching of alkane while peak at 1636 cm-1 indicates C=C stretching of alkene could be as a result of metal alkyl formation. Band of 1464 cm-1 indicate C-H bending of alkane while 1386 cm-1 signify C-H bending of aldehyde. Weak band at 1125 cm-1 signify C-O stretching of alcohol could be as a result of formation of metal carbonyl and a strong band at 618 cm-1 indicate C-Br/Cl/F of halo compound [17] (Figures 4A and 4B).

Figure 4. A) Infrared spectrum of pure Klebsiella pneumoniae grown in nutrient broth and B) infrared spectrum of Klebsiella pneumoniae grown in nutrient broth containing mixture of heavy solution.
Infrared spectrum of Klebsiella oxytoca grown in nutrient broth
The spectrum of klebsiella oxytoca from Figure 5A shows a broad band at 3343 cm-1 indicating OH stretching of alcohol and a peak at 2926 cm-1 signifies Sp3 CH stretching of alkane. Peaks at 1638 cm-1 and 1550 cm-1 indicate C=C stretching of alkene and N-O stretching of nitro-compound respectively. Bands at 1405 cm-1 and 1021 cm-1 signify S=O stretching of sulfate and C-N stretching of amine respectively. Band at 618 cm-1 indicates C-Br/Cl/F of halo-compound [17].
Infrared spectrum of Klebsiella oxytoca grown in nutrient broth containing mixture of heavy metal solution
The spectrum of klebsiella oxytoca isolate on Figure 5B reveal shift of bands and wavelenths which include broad band at 3309 cm-1 indicating OH stretching of alcohol which maybe as a result of deprotonation. Generation of a new weak band at 2117 cm-1 representing a C≡C stretch of alkyne and band at 1636 cm-1 indicates C=C stretch of alkene which could be as a result of metal alkyl complex formation. Peak at 1386 cm-1 representing C-H bending of alcohol. Strong band at 633 cm-1 indicates a C-Br/Cl/F stretching of halocompound [17] (Figures 5A and 5B).

Figure 5. A) Infrared Spectrum of pure Klebsiella oxytoca grown in nutrient broth and B) infrared spectrum of Klebsiella oxytoca grown in nutrient broth containing mixture of heavy metals solution.
Infrared spectrum of Klebsiella ozoenae grown in nutrient broth
The isolate spectrum of Klebsiella ozoenae on Figure 6A shows a broad spectrum at 3287 cm-1 indicating an OH stretching of alcohol while bands at 2940 cm-1 and 2832 cm-1 represent Sp3 CH stretching of alkane. Band at 1625 cm-1 indicates C=C stretching of alkene and 1401 cm-1 indicates OH bending of alcohol. Peak at 1021 cm-1 signifies C-N stretching of amine while 626 cm-1 indicates C-Br/Cl/F stretching of halo-compound [17].
Infrared spectrum of Klebsiella ozoenae grown in nutrient broth containing mixture of heavy metal solution
The spectrum of Klebsiella ozoenae in Figure 6B shows shifting of bands and wavelengths as a result of metal binding by various chemical molecules within cell. A shift of broad band at 3280 cm-1 indicating OH stretching of alcohol as a result of deprotonation and 2948 cm-1 and 2836 cm-1 bands signifying Sp3 CH stretching of alkane. Shift band at 1651 cm-1 signifies C=C stretching of alkene which could be as a result of formation of metal alkyl complex and band at 1405 cm-1 indicates OH bending of alcohol. Band at 618 cm-1 indicate C-Br/ Cl/F of halo-compound [17,18] (Figures 6A and 6B).

Figure 6. A) Infrared spectrum of Klebsiella ozoenae grown in nutrient broth and B) infrared spectrum of Klebsiella ozoenae grown in nutrient broth containing mixture of heavy metals solution.
Different methodologies have been used to remediate heavy metals in soil which include; the physical remediation and chemical treatment. These methods of reducing heavy metals from soil usually employ stringent physicochemical agents that can potentially alter soil fertility, leaves subsequent negative effects on the ecosystem and usually are ineffective in practical applications owing to high cost, operational difficulties and at times been selective. Therefore, there is the need for a more environmentally friendly method with little or no side effects which will involve the use of indigenous agents such as microorganism, i.e. bacteria, fungi etc.
Google Scholar, Crossref, Indexed at
Google Scholar, CrossRef, Indexed at
Google Scholar, Crossref, Indexed at
Google Scholar, Crossref, Indexed at
Google Scholar, Crossref, Indexed at
Google Scholar, Crossref, Indexed at
Google Scholar, Crossref, Indexed at
Google Scholar, Crossref, Indexed at
Google Scholar, Crossref, Indexed at
Journal of Environmental Analytical Chemistry received 1781 citations as per Google Scholar report


 [
[