Research Article - (2025) Volume 16, Issue 2
Received: 31-Jul-2024, Manuscript No. JVST-24-143852;
Editor assigned: 02-Aug-2024, Pre QC No. JVST-24-143852 (PQ);
Reviewed: 16-Aug-2024, QC No. JVST-24-143852;
Revised: 07-Apr-2025, Manuscript No. JVST-24-143852 (R);
Published:
14-Apr-2025
, DOI: 10.37421/2157-7579.2025.16.287
Citation: Admasur, Addis Asegid and Ashenafi Mengistu. "Pre and Post Market Quality Assessment of Comercila Layers’ Ration in Bishoftu and Addis Ababa, Ethiopia." J Vet Sci Technol 16 (2025): 287.
Copyright: © 2025 Admasu AA, et al. This is an open-access article distributed under the terms of the creative commons attribution license which permits unrestricted use, distribution and reproduction in any medium, provided the original author and source are credited.
This study was undertaken to determine the proximate composition and variations of nutrient in commercial layer’s feeds produced and sold in Addis Ababa and Bishoftu. A total of 438 feed samples classified into two sampling categories were collected in 2022. The first category referred as premarket feed and comprises 240 samples collected from 12 licensed commercial feed producers, while the second referred as post market feed sample consist of 198 samples collected from 198 commercial layer farms who use feed produced by commercial feed producers. The samples were subjected to proximate analysis using non distractive method.
This research suggests that the nutrient composition of layers feed is highly variable among manufacturers to the extent that contain nutrients below or above the national feed quality standard. The noncompliance frequencies in crude protein and metabolizable energy varied between 39.3% to 43.8%, 33.8% to 48.3%, of the total sample population, with average total deficiency of 1.3% and 1.7%, 62.5 and 112.4 kcal/kg respectively.
The moisture and crude fiber contents in 5% to 10% and 2% to 7% of the total feed samples surpass the maximum limit respectively, while all crude fat all values were higher than the maximum recommended requirement. This may expose birds fed with feeds to under or over-feeding of essential nutrients and hence reduced bird performance, added input costs and increased environmental pollution. Statically significant (P<0.05) association between out of compliance frequencies and feed sample categories or study locations were apparent, which in part attributed to differences in ingredient source, quality and feed compounding practices across the study locations. To ensure quality and standardization of feeds, frequent monitoring and enforcement of standards in the preparation of feed is cardinal, this will ensure that nutritional feeds are formulated to meet production needs of poultry birds.
Premarket • Post market • Proximate analysis • Feed quality • Feed evaluation • Feed standard
In Ethiopia poultry is increasingly identified by the government, development partners and commercial stakeholders as a value chain with potential to deliver high growth, employment, social inclusiveness and nutritional benefits [1]. Layers have emerged today as the fastest growing segment for poultry industry in Ethiopia with the increased acceptance of chicken eggs and meat in city, town and villages and as easiest means of bridging the supply demand gap of animal protein, due to their rapid growth rate and superior feed conversion ratio. The typical production cycle lasts about 17 months (72 weeks) and involves three distinct phases, namely brooders, growers and layers which lasts about 0 to 2, 2 to 3 and 3 to 17 months respectively.
However, despite the important role played in reducing the scourge of poverty, unemployment and malnutrition in the country the subsector is faced with numerous challenges of which feed quality is most notable, however, it is has contributed remarkably to shrinking the scourge of unemployment, malnutrition and poverty. The health, growth and reproduction of layers is determined by the availability of sufficient nutrients, both in quantity and quality regardless of the culture system in which they are raised. Quality feed products enable farms to reduce production costs, maintain or increase food quality and consistency and enhance animal health and welfare by providing balanced diet. It also can reduce the potential for pollution from animal wastes by providing only necessary amounts of highly bioavailable dietary nutrients.
Layers feed is any single and multiple materials whether processed, semi-processed or raw, which is intended to be fed directly to chickens. Feed ration is the amount of feed that is provided to poultry over a period. Leeson and Summers opined that poultry feeds are required to contain certain nutrients such as protein, fat, vitamins, minerals and carbohydrate in their right percentages in starter, grower, layer and finisher rations for various stages of growth. Feed for poultry consists mainly of grains. It is made up of mixtures of different feedstuffs such as cereal grains, soybean meal, animal byproduct meals, plant protein sources, fats and vitamin, mineral premixes and feed additives. Feed is estimated to account for more than 70%-80% of the total cost of production in poultry farming; it represents the major cost of intensive poultry production.
Thus, for high productivity and efficiency to be achieved, poultry must be fed nutritionally balanced feed that are formulated to meet the bird’s nutritional requirements, hence the need for qualitative food cannot be over emphasized. Most commercial poultry farmers in Ethiopia, depend on commercial feeds for their poultry farms. Addis Ababa-Bishoftu routes account about 69% of the total poultry commercial farms and 50% compound feed processors in the country are concentrated [2-5].
There is growing perception among development practitioners and farmers that commercial feed manufacturers fail to meet up with the required standards for poultry feeds due to high cost of feed production, though research evidence is very scanty. In his recent study Negash reported that from 64 feed samples formulated for dairy, poultry and beef animals all have a crude protein contain below the national feed quality standard. Of total feed cost, about 95 percent is used to meet energy and protein requirements in a ration). Ethiopia has a concrete and very well elaborated, mandatory poultry feed quality standard since 2002. However, formal feed quality control is uncommon both at the production site and at the selling point has further provoked the situation.
Therefore, this study is aimed at determining the proximate composition of premarket and post market commercial layer’s feed in Addis Ababa and Bishoftu, to differentiate feed quality attributes before and after dispatched to the marketing channels and have reached the end users respectively. The results were compared with Ethiopian Standard Institute recommended requirement in commercial layers’ feed.
Description of the study areas
The study was conducted in and around Addis Ababa city administration and Bishoftu town located in East Shewa Zone, Oromia regional states. Addis Ababa, the political capital and the most important commercial and cultural center of Ethiopia, is geographically located at the heart of the nation, 9°2’N latitude and 38°45’E longitude. It is one of the fastest growing cities in Africa and a primate city in Ethiopia with an estimated population of around four million, which is roughly 25% of the total urban population. Bishoftu is located (9°N latitude and 40°E longitudes) 47.9 kms Southeast of Addis Ababa. About 69% of the total commercial farms in the country and more than 50% of the total compound feed processors are concentrated close to the consumption centers along Addis Ababa and Bishoftu rout.
Study population
Poultry farmers and feed plants represented the study population. Sample size from Addis abeba and Bishoftu towns was determined as indicated in the formula below.
Sample size determination
The premarket feed sample population was down from 12 feed producers (8 from Addis and 4 from Bishoftu) at production line and before dispatched to the marketing channels while the post market feed samples were drawn from 198 commercial layer farms that use commercial feed from above feed producers in their farm. Sampled feed producers and commercial farms represent 80% the total population of feed producers and about 60% chicken famers in the study regions operational at the time of the sampling. The total sample size was determined using the sample size determination formula. In this formula the sample size is determined as:
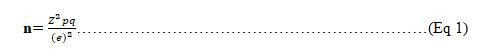
Where n=is the sample size
Z2=is 1-α equals the desired confidence level e
=is the desired level of precision
p=is the estimated proportion of an attribute that is present in the population and
q=is 1-p
To capture the maximum possible variability within the population size that comply with Ethiopian standard with the desire a 95% confidence interval and ± 5% precision the p value in Equation 1 was set at 0.05 (p=0.5) and rewritten as Equation 2.

A minimum number of samples required to capture the maximum possible variability within feed sample population was proportionally divided among the four sampling subgroups to accommodate a comparative analysis of subgroups as suggested by Sudman. With this assumption, two hundred forty premarket feeds sample, 20 per each feed producers (160 from Addis and 80 from Bishoftu) were collected to quantify the variations between and within the premarket sample population. Likewise, the post market feed samples were collected from one hundred ninety-eight commercial farms (104 from Addis Ababa Region and 94 from Bishoftu). The small, medium and large commercial farms make up 81.7%, 12.5%, 5.7% and 57.4%, 26.6% and 16.0% of total post market feed sample population in Addis Ababa and Bishoftu respectively.
Sampling procedure
Stepwise purposive sampling process was followed by proportional random sampling procedure to collect the feed sample from the commercial feed producers and commercial layers farms. Addis Ababa and Bishoftu are purposively selected as study locations since the two regions represent most significant population of commercial layers chicken keeping centers in the country [6]. Further, most of the feed mills and standard regulatory authorities are reside in and around the two regions. From the eleven sub-cities of Addis Ababa city administration, again seven sub-cities were selected purposively based on the commercial layers farm and feed millers’ populations as suggested by the authorities of the bureau of urban agriculture.
Pre and post market feed samples in and around Addis Ababa were collected from 8 compound feed millers and 104 commercial farms using proportional random sampling technique, respectively. While from Bishoftu town, which has fifteen kebeles, seven kebeles were selected purposively based on the above-mentioned criteria. Four commercial layer feed millers and 94 commercial layer farms were selected using methods described above. The selected commercial farms have flock size between 50 and 1000, 1001-2500 birds and above 2500 birds.
The sampling was done carefully using a method described and Ethiopian standard feed sampling procedure similarly, one hundred ninety-eight compound commercial layer feed samples were collected proportionately from 198 commercial layer farms operational at the time of sample collection.
Determination of nutriment concentration
Each sample was scanned in a closed 3.5 cm diameter ring cup, using a Foss model DA 7250 NIR scanning monochromator device, equipped with a spinning module. The instrument works in reflectance mode in the spectral range 1100-2500 nm, taking readings every 2 nm (spectral band pass 10 nm to 61 nm). Spectral absorbance values were obtained as log (1/R), where R represents the percent of energy reflected, which must then be related to the amount of the component as determined by reference or standard method [7].
Data analysis
Descriptive statistics were performed to describe the basic features of the data using the R software package, version 4.5. Frequency analysis was used to estimate the frequency of out of compliance of, crude fiber, crude fat, crude protein, metabolizable energy, moisture content, calcium, available P and sodium content. Cumulative Frequency Distribution Functions (CFDF) were used with quantitative continuous variables, such as the nutrient content of pre and post market compound feed samples.
The CFDF is used to establish the frequency of occurrences relative to a reference point; the reference point used in the analysis of nutrient content compliance is Ethiopian base mark commercial layers feed quality standard requirement (ES 1027: 2019) established for a nutrient by the regulators.
The CFDF is depicted by a continuous ascending or descending line whichever appropriate in a coordinate system in which the nutrient contents resulting from chemical analysis are in the abscissa and the cumulative frequencies of occurrence (percent) are in the ordinate. The solid line on the CFDF indicate the minimum or maximum limit and the projection of the dotted lines toward the Y axis indicate the frequency or percentage of samples associated with the values for, nutrient content that are below the standard.
The out-of-compliance frequency for a particular feed category and nutrient is established determining the frequency associated with crude protein, metabolizable energy, available P, Ca and Na determined by the lab values lower than the standard specification Minimum Limit (MINL) value while the frequency associated with moisture content, total ash, crude fiber, crude fat determined by the lab values greater than the standard specification Maximum Limit Value (MAXL) using CFDF equation Equation 3 and Equation 4 respectively.
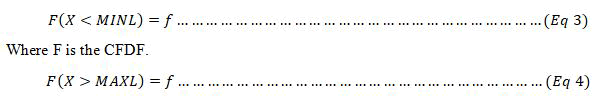
X is moisture content, crude protein, sodium, crude fiber, crude fat, metabolizable energy, calcium, available phosphorus content of the feeds determined by the lab.
The Shortage Severity (SS) is calculated as follows:
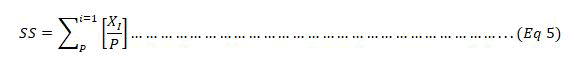
Where Xi are the nutrient shortages lower than standard requirement and P is the number of values lower than the standard requirement specified by ESI commercial layers feed standard recommendation.
In addition, the Chi-square independence test was employed to evaluate the relationship between observed frequencies of compliance and the two feed sample categories and study regions. Specifically, to test whether the frequencies of one categorical variable differ across levels of another categorical variable [8-10]. In other words, whether a statistically significant (P<0.05) relationship exists between the two variables. Since the number of categories is two, the expectations are calculated using the Ei,j formula for frequency of counts for (i,j) pair of factors) .The value of X2 statistic iscomputed as shown below

Where X2=Chi-square test of independence
Oij=Observed value of two nominal variables
Eij=Expected value of two nominal variables
Degree of freedom is calculated by using the following formula:

Where
Df=Degree of freedom
r=number of rows
c=number of columns
Compliance of nutrient concentration in pre and post market feeds
Crude protein contents: The results of proximate analysis results showed that out of the total premarket feed samples, collected in Addis and Bishoftu 39.37% and 43.75% were out of compliance with respect to CP content, the average total CP deficiency was 1.7% and 1.3%, respectively (Figure 1). In contrasts the out of compliance frequency of post market feed sample was 50% and 57.5% respectively with average total CP deficiency of 1.2% and 0.68% in the same order as above.

Figure 1. Cumulative frequency distributions of CP concentration (%) in pre and post market commercial layers feed sample. Vertical solid line represents the out-of-compliance boundary and horizontal dotted line represents the frequency for the boundary.
The independent test further showed that the difference in out of compliance frequency between premarket and post market feed sample only at Addis Abeba were statistically significant at P<0.05 (Table 1). This suggests the presence of strong association between out of compliance frequency and the two feed sample categories. However, there is no statically significant association between out of compliance frequency and sampling locations.
| Location | Feed sample | Compliance frequency | Total | Test statistic | χ2 | ||
| Out | In | <0.05 | <0.01 | ||||
| Addis | Pre market | 63 | 97 | 160 | 6.62 | - | 6.64 |
| Post market | 53 | 51 | 104 | - | - | - | |
| Bishoftu | Pre market | 32 | 48 | 80 | 3.01 | 3.84 | - |
| Post market | 50 | 44 | 94 | - | - | - | |
Table 1. Pre and post market feed compliance frequencies with respect to crude protein content.
Thus the numerical differences in out compliance frequencies between study locations with respect to CP content were attributed to random variations in raw materials and feed compounding process commonly occur during feed formulations.
Metabolizable energy content: Proximate analysis results of metabolizable energy contents of the feed samples from the two study locations are depicted in Figure 2. The result revealed that the premarket feed samples exhibited out of compliance frequencies of 33.8% and 36.6% at Addis and Bishoftu the average total ME deficiency of -104.1 and -62.5 kcal/kg respectively. While the corresponding figure for the post market feed samples in the same order as above was 48.33% and 43.61% with average total ME deficiency of -112.4 and -65.5 kcal/kg respectively (Figure 2).

Figure 2. Cumulative frequency distributions of ME (kcal/kg) content in pre and post market commercial layer feed. Vertical solid line represents the out-of-compliance boundary and horizontal dotted line represents the frequency for the boundary.
Post market feed samples exhibited higher out of compliance frequency than premarket feed samples at only in Addis Abeba. However, the association between out of compliance frequency and pre and post market feed samples was significant only at Addis Ababa (Table 2).
| Location | Feed sample | Compliance frequency | Total | Test statistic | χ2 | ||
| Out | In | ≤ 0.01 | ≤ 0.05 | ||||
| Addis | Pre market | 63 | 97 | 160 | 7.49 | 3.84 | 6.64 |
| Post market | 51 | 53 | 104 | - | - | - | |
| Bishoftu | Pre market | 32 | 51 | 80 | 2.39 | 3.84 | 6.64 |
| Post market | 45 | 49 | 94 | - | - | - | |
Table 2. Metabolizable energy content compliance frequency differences among pre and post market feed samples at the study locations.
Crude fiber content: Unlike CP and ME content, the noncompliance frequencies of crude protein content in commercial layers feed sample was modest regardless of the study variables. In Addis about 5.6% of premarket sample and 9.6% post markets sample exceeded the minimum value of CF content sited by ESI (2019) standard for commercial layers feed. The corresponding figures for Bishoftu in the same order as above were 6.5% and 10%.
The result of independent test suggests that post market feed samples exhibited higher out of compliance frequency than premarket feed samples at both. Addis Abeba and Bishoftu (Table 3). Moreover, the associations between out of compliance frequency of CF content and feed sample categories in one hand and CF content and sampling locations on the other hand were statically significant at (P<0.05).
| Location | Feed sample | Compliance frequency | Total | Test statistic | χ2 | ||
| Out | In | ≤ 0.01 | ≤ 0.05 | ||||
| Addis | Pre market | 8 | 152 | 160 | 4.84 | 3.84 | 6.64 |
| Post market | 13 | 91 | 104 | - | - | - | |
| Bishoftu | Pre market | 10 | 70 | 80 | 3.97 | 3.84 | 6.64 |
| Post market | 4 | 90 | 94 | - | - | - | |
Table 3. Compliance frequency of crude fiber content in pre and post market feed sample in the study locations.
This suggests that higher out of compliance frequency in CF content was expected in post market feed samples compared to premarket feed samples. The results of independent test further revealed that higher out compliance frequencies in CF was expected in feed samples from Bishoftu compared to feed samples collected from Addis Ababa (Table 4).
| Location | In and out compliance frequency | Total | Test statistic | χ2 | ||
| Out | In | ≤ 0.01 | ≤ 0.05 | |||
| Addis | 8 | 152 | 160 | 4.32 | 3.84 | 6.64 |
| Bishoftu | 10 | 70 | 80 | - | - | - |
Table 4. Compliance frequency of crude fibber content in pre-market feed samples across the study locations.
Moisture content: The proximate moisture content analysis results presented in Figure 3 revealed that all most all feed sample comply with ESI commercial layers feed standard. From the 240 premarket feed sample analyzed 236 (98%) comply with the standard. Similarly, out of 198 post market feed sample analyzed only 7 samples (about 4%) exceeds the in-compliance limit (Table 5).

Figure 3. Cumulative frequency distributions of moisture content in pre and post market commercial layer feed sample. Vertical solid line represents the out-of-compliance boundary and horizontal dotted line represents the frequency for the boundary.
| Location | Feed sample | Compliance frequency | Total | Test statistic | χ2 | ||
| Out | In | ≤ 0.01 | ≤ 0.05 | ||||
| Addis | Pre market | 2 | 158 | 160 | 3.09 | 3.84 | - |
| Post market | 5 | 99 | 104 | - | - | - | |
| Bishoftu | Pre market | 1 | 79 | 80 | 0.52 | 3.84 | - |
| Post market | 2 | 92 | 94 | - | - | - | |
Table 5. Compliance frequency of moisture content in pre and post market feed sample in the study locations.
Moreover, the variations in moisture content observed across the study variables has no statistically detectable pattern suggesting that variations are attributed to random variations. The independent test further attested that no association between out of compliance frequency and feed sampling category or sample locations.
Crude fat content: The proximate analysis results are presented in Figure 4 showed that regardless of the study variables the crude fat content of commercial feed sample complies with ESI. The crude fat content of the feed samples ranges from 2.1% to 8.6% while ESI recommends a minimum of 2% crude fats inclusion rate in commercial layers feed formulation. The maximum amount is defined more by technical reasons than by nutritional ones, as diets of up to 7.5% of crude fat are excellent for layers.

Figure 4. Cumulative frequency distributions of crude fat content in pre and post market commercial layer feed sample. Vertical solid line represents the out-of-compliance boundary.
Available P content: The proximate analysis of available P content in pre and post market sample are depicted in Figure 5. The results showed that the deference between pre past market commercial feed sample in out of compliance frequency with respect to Av. P content was modest (6.3 vs. 7.6%) at Bishoftu and 11.3% vs. 7.7%. The independent test further attested that no association between out of compliance frequency and feed sampling category or sample locations (Table 6).
| Location | Feed sample | In and out compliance frequency | Total | Test statistic | χ2 | ||
| Out | In | ≤ 0.01 | ≤ 0.05 | ||||
| Addis | Pre market | 18 | 142 | 160 | 0.89 | 3.84 | - |
| Post market | 8 | 96 | 104 | - | - | - | |
| Bishoftu | Pre market | 10 | 70 | 80 | 2.82 | 3.84 | - |
| Post market | 5 | 90 | 94 | - | - | - | |
Table 6. Compliance frequency of available phosphorus content in pre and post market feed samples within the study location.

Figure 5. Cumulative frequency distributions of available phosphorus content in pre and post market commercial layer feed sample. Vertical solid line represents the out-of-compliance boundary and horizontal dotted line represents the frequency for the boundary.
Calcium content: Out of the total premarket feed samples analyzed 18.1% and 25.1% were out of compliance with respect to calcium content at Addis and Bishoftu, the average total calcium deficiency of -1.4% and -1.15%, respectively (Figure 6).

Figure 6. Cumulative frequency distributions of calcium content in pre and post market commercial layer feed sample. Vertical solid line represents the out-of-compliance boundary and horizontal dotted line represents the frequency for the boundary.
In the same order as above the corresponding values for post market samples were 43.62% and 28.8% with average total calcium deficiency of -1.59% and -2.09% (Figure 6). Test of independent revealed that the association between out of compliance frequency and premarket and post market feeds at both locations were statistically significant at P<0.01 and P<0.05 respectively, indicating the presence of strong association between out of compliance frequency and the two feed sample categories (Table 7).
| Location | Feed sample | Compliance frequency | Total | Test statistic | χ2 | ||
| Out | In | ≤ 0.01 | ≤ 0.05 | ||||
| Addis | Pre market | 20 | 140 | 160 | 25.7 | 3.84 | 6.64 |
| Post market | 41 | 63 | 104 | - | - | - | |
| Bishoftu | Pre market | 20 | 60 | 80 | 6.57 | 3.84 | 6.64 |
| Post market | 41 | 53 | 94 | - | -- | - | |
Table 7. Pre and post market feed compliance frequencies with respect to calcium content.
Sodium chloride content: Out of the total premarket feed samples analyzed 11.2% and 33.75% were out of compliance with respect to sodium chloride content at Addis and Bishoftu, with the average total positive deviations of +0.54% and +0.05%, respectively (Figure 7). The corresponding values for post market samples were 8.0% and 19.14% with average total positive deviations of 0.02 and 0.07% ESI recommend dietary NaCl requirements for layers are 0.5% which primarily based on growth performance study literature elsewhere.

Figure 7. Cumulative frequency distributions of sodium chloride content in pre and post market commercial layer feed sample. Vertical solid line represents the out-of-compliance upper boundary and horizontal dotted line represents the frequency for the boundary.
The independent test revealed that the association between out of compliance frequency and feed sample categories at both locations were statistically significant at P<0.05. This may suggest that the observed difference in compliance frequency between pre and post market with respect to sodium chloride concentrations were attributed not only to random variations but variations in feed formulation processes, transport and storage.
In general, the out of compliance frequencies of commercial layer feeds with respect to sodium chloride concentration was higher at Bishoftu compared to that of Addis Ababa. The independent test further showed that these differences were statistically significant at P<0.05 (Table 8).
| Location | Feed sample | Compliance frequency | Total | Test statistic | χ2 | ||
| Out | In | <0.01 | <0.05 | ||||
| Addis | Pre market | 18 | 142 | 160 | 9.37 | - | 6.64 |
| Post market | 9 | 94 | 104 | - | - | - | |
| Bishoftu | Pre market | 27 | 53 | 80 | 4.81 | 3.84 | 6.64 |
| Post market | 18 | 76 | 94 | - | - | - | |
Table 8. Pre and post market feed compliance frequencies with respect to sodium chloride content.
Compliance of nutrient concentration in commercial layers feed
The quality of feed can strongly influence the production time and the quantity of eggs produced. A longer production time means more costs for housing and labour for the farmer. The quality of feed also has a strong impact on the Feed Conversion Ratio (FCR). Feed with a high FCR means that the farmer needs more feed to produce 1 kg of meat or eggs than feed with a lower FCR. The Ethiopian Standard Council approved new standards for poultry feeds in 2019. The renewed standards pay more attention to nutrient balances in the feed, quality assurance, the right methods of testing and ingredient selection. In Ethiopia, feed quality is regulated/monitored by veterinary drug and animal Feed Administration and Control Authority. The new standards include a list of which testing methods should be used. All these methods in accordance with the international organisation for standardisation guidelines. Further guidelines for nutrient requirements for both layers and broilers are given in different life stages. These guidelines can help feed manufacturers produce better quality feeds with better digestibility. These feeds can increase yield while lowering production costs.
Crude protein contents: CP in the feed provides essential amino acids. Increased crude protein in the diet of birds leads to improvement in egg size and weight. The results of proximate analysis showed that out of the total premarket feed samples, collected in Addis and Bishoftu 39.37% and 43.75%were out of compliance with respect to CP content, the average total CP deficiency was 1.7% and 1.3%, respectively. In contrasts the out of compliance frequency of post market feed sample was 50%, and 57.5% respectively with average total CP deficiency of 1.2% and 0.68% in the same order as above. The minimum requirement of ESI, for layer was cited as 16.5%.
Several researchers have reported on crude protein in poultry feeds observed in their studies comparable crude proteins as this study in the range of 16.44 ± 1.29-24.26 ± 04.16%; 16.15%-20.97%, 10.66 ± 0.76-20.16 ± 1.75 g/100 g, 13.89 ± 0.46-14.04 ± 0.03%, 16.15%-20.97%, 19.46%-24.31%, 20%-22% and 19.46%-24.31%, 20%-22%respectively. Recorded higher crude protein of 36.50 ± 0.92%-70.92 ± 0.51%.
Negash reported out of complain frequency of 29% in CP content in 17 premarket commercial layer feed samples collected across four regions in Ethiopia. However, the same author in same study has reported none compliance frequencies as high as 50% for compound of feeds other livestock species. The high out of compliance frequencies reported in this study compared to the previous studies in part attributed to differences in sample size and sampling methodology and possibly random variability associated with feed analysis.
In this study the main sources of variability associated with the CP content may be attributed to feed formulation process and the random variability associated with proximate analysis in the laboratories. In this study, the feed samples were analyzed using NIRS, the random variability connected to the analysis in the labs is known to be near negligible. The Near-Infrared Spectrophotometry (NIRS) analysis is used world-wide as a rapid tool, providing stable and repeatable predictions. In practice, the NIRS appears as a quick and efficient tool to help the reformulating process at a feed mill level. However, feeds formulated based on the expected nutrient averages, ignoring the inherent nutrient variability in feedstuffs may only meet the nutrient requirements of the birds 50 percent of the time, with high variation in meeting the minimum requirements.
CP is the main ingredient and cost component of the feed. Reported that due to the high cost of protein materials for formulating feeds, some feed manufacturers resort to cheaper protein materials for formulation, which may be due to the low protein content of some feeds. However, the most likely explanation for the nutrient shortages in our study is feed formulation techniques which overlooked the inherent nutrient variability of feed ingredients. Inadequate feed analytical services as well as lack of statutory control over feed quality have further provoked the situation.
On the other hand, in this study about 60% commercial feeds produced or distributed to the end users had higher CP concentrations than CP requirement of laying hens declared by ESI. Theoretically a small or moderate CP over estimation would increase the production cost without necessarily affecting the performance, in the contrary underestimate CP will also reduce performance. Because protein is not stored in the body to any significant extent, any protein consumed in excess of the bird's requirements will be oxidized for energy. However, since protein sources are expensive and uneconomical for providing energy, protein levels are usually specified accurately and closer to minimum requirements than other nutrients.
Metabolizable energy content: The results revealed that the premarket feed samples exhibited out of compliance frequencies of 33.8% and 36.6% at Addis and Bishoftu with the average total ME deficiency of 104.1 and 62.5 kcal/kg respectively. While the corresponding figure for the post market feed samples in the same order as above was 48.33% and 43.61% with average total ME deficiency of -112.4 and -65.5 kcal/kg respectively. This variation more likely comes from the variations ingredients since the ME value was obtained from a factor of the fat, protein and carbohydrate content in the feed. The implication is that birds fed with ration containing less fat, protein and carbohydrate will not have much energy for growth and this feed sample may contribute to stunted growth and low production in birds.
Out of compliance frequency reported in this study is still high but compared to previous studies conducted in Ethiopia for other livestock species including commercial layers seems low. Analyzed 64 compound feed samples for metabolizable energy content of which 52 samples (81%) were failed to meet ESI standards while 12 of them are over the standard. His values ranged between 1364-2746 Kcal/kg, 1092-2890 kcal/kg and 1703-2880 kcal/kg while the standard is 2500, 2650 and 2600 kcal/kg for layer, beef and lactating dairy cow, respectively.
This study result corresponds to about 1984.40-3339.60 Kcal/kg and 2801.14-3026.9 Kcal/kg of metabolizable energy values published, respectively. In contrast, Bukar and Saeed observed a slightly higher metabolizable energy value of 1737.30-4622.70 kcal/ kg.
The difference in out of compliance frequencies reported in this study compared to the above study is in part are attributed to differences in sample size, sampling methodology and possibly feed ingredients quality variations associated within a season. Nevertheless, both studies show that a great attention is needed to fulfill the energy requirement of the animal because most of the feed manufacturing industries do not meet the energy content of commercial layer feed demanded by Ethiopian standard authorities.
Post market feed samples exhibited higher out of compliance frequency than premarket feed samples at only in Addis Abeba. However, the association between out of compliance frequency and pre and post market feed samples was significant only at Addis Ababa. Thus the difference in ME between the pre and post market feed sample at Bishoftu is merely attributed to random variations. In addition to random variations, the difference between two samples in Addis Abeba may be attributed to the variations induced due to segregation at loading, unloading and transport the feed from point production to point of use.
Crude fiber content: Unlike CP and ME content, the noncompliance frequencies of crude fiber content in commercial layers feed sample was modest regardless of the study variables. In Addis about 5.6 of premarket sample and 9.6% post market sample exceeded the minimum value of CF content sited by ESI standard for commercial layers feed. The corresponding figures for Bishoftu in the same order as above was 6.5% and 10%.
The CF content in present study agrees with crude fiber contents published 4.3%-9.0% and 2.89%-6.60% and 3.53 ± 0.04-8.45 ± 0.16%, 5.27-10.39%, while 3.41 ± 0.17-15.90 ± 6.46% and 1.70%-38.75% observed in Bukar and Saeed and Bukar and Saeed respectively were lower crude fiber contents.
Dietary CF provides substrates for the gut micro biota to maintain gastrointestinal tract function and health. However, The CF is used to define a variety of indigestible polysaccharides including cellulose, hemicelluloses, pectin’s, oligosaccharides, gums and various lignified compounds. With little gradation, the fiber fraction of poultry diets was long considered of diluting or even anti-nutritive nature, as reviewed. Thus, it has commonly been used as a negative coefficient in prediction equations of the nutritive value of feeds.
Moisture content: Controlling the moisture content of any feed is very important, because it is the mainly cause for aflatoxin. Moreover, high DM contents control the growth of mold in feeds, thereby reducing deterioration which is particularly important in tropical countries. As stated by Islam et al., with some exceptions our result suggests that commercial layer feed sample analyzed are appropriate for use and storage. The moisture content in this study agrees with 8.52%-10.44 % obtained who reported moisture content variations of 8.58 to 12.16% among 17 commercial layer feed samples collected from Ethiopia.
Published studies, higher moisture levels were observed in poultry feed in the range of 4.98 higher moisture contents were observed in the poultry feeds in the ranges of 4.98 ± 01.58-11.33 ± 4.48%, 3.81-15.97%, 0.17 ± 0.13-36.31 ± 0.38%, 7.84-11.8% and 6.13 ± 0.28-11.02 ± 1.52% respectively. They reported lower moisture content in poultry feeds.
Crude fat content: The crude fat content of the feed samples ranges from 2.1% to 8.6% while ESI recommends a minimum of 2% crude fats inclusion rate in commercial layers feed formulation. The maximum amount is defined more by technical reasons than by nutritional ones, as diets of up to 7.5% of crude fat are excellent for layers.
Our results were in agreement with previous research conducted by them who came across similar magnitude in fat content variations among 17 commercial layers feed examined and also agree with where as in their various studies, they reported lower levels of crude lipids in poultry feed than in the present study.
Supplemental fat affects the productivity and egg size of layers, but the effects depend on the amount and type of fat used and the Linoleic Acid (LIN) content of the diet. In addition, additional fat may improve digestibility of other dietary components as well as egg mass production and feed efficiency.
Sodium chloride content: Sodium (Na) and Chlorine (Cl) are essential minerals for poultry and play a critical role in regulating water-electrolyte metabolism, acid-base balance and maintaining Osmotic Pressure (OSM). Sodium and Cl are low-cost nutrients with great influence on Feed Conversion Ratio (FCR), egg shell quality and excreta moisture. To provide the requirements of these minerals in poultry diets, NaCl is commonly used, which contains approximately 40% Na and 60% Cl. In most of the laying hen requirement tables, only Na is listed. Levels of NaCl used in commercial diets for laying hens vary from 0.15% to 0.50%. ESI recommends 0.50%dietary NaCl for laying hens.
Nutrients or additives supplied in excess of requirements will be wasted, add unnecessary cost to the diet and in extreme cases, can even be toxic to the animal. It was apparent in our study that, at least in a significant portion of feed produced, nutrient uniformity criteria with respect to NaCl concentration is not being met. Subsequently about 44% of premarket and 27% post feed samples contain excess amount of NaCl than that allowed by ESI for laying hens.
Available P content: Nevertheless, our results showed that the deference between pre and post market commercial feed sample in out of compliance frequency with respect to Av. P content was modest (6.3 vs. 7.6%) at Bishoftu and 11.3% vs. 7.7%. Ethiopian Standard Institute recommended dietary phosphorus level for laying hens at 0.4% available phosphorus per kilogram of diet. Low dietary phosphorus levels during lay can result in increased fatigue of the cage layer, decreased bone ash, increased severity of osteoporosis and decreased bone strength. Phosphorus plays a key role in carbohydrate metabolism, fat metabolism and the regulation of acid-base balance in the body.
Calcium content: This study revealed that on the average the outcompliance frequency of commercial feed with respect to Ca content was as high as 27%. Ca is an essential nutrient for poultry that is generally provided to laying hens at approximately 4.6% of the total feed volume. It is important for bone development command mineralization, eggshell formation, muscle and neural functions. Diets containing calcium below the nutritional requirements of layers impair performance and egg quality. However, calcium metabolism is related to and influenced by the availability of phosphorus (P) and vitamin D so that any inadequacy or excess of one may significantly affect the metabolism of the other.
Calcium is one of the essential minerals in poultry nutrition. In addition to its vital functions as the main component of bone structure and participation in acid-base balance and enzymatic system, On the other hand, out of the total feed sample examined in this study nearly 73% had higher concentration of Ca compared to ESI requirements.
Excessive dietary calcium can reduce feed intake, cause soft feces and increase chalky deposits in the eggshell. Research by has shown that the use of feeds with 2.5% to 3.0% calcium in the diet of young laying hens, regardless of the form of calcium present in the feed, not only has negative effects on the productivity of the shifts can have, but also the quality of the eggshell, which means that defective eggs are more common. In addition, high dietary calcium concentrations are known to decrease the energy value of food through chelation of lipids.
The demand for quality feed to meet the nutritional requirements of poultry for efficiency and high productivity is of great importance. This study revealed differences in the proximate composition and metabolizable energy of premarket and post commercial layers feed available in Bishoftu and Addis Ababa. The feeds have optimum moisture nutrients that meet the recommended requirements while crude fat recorded higher values suggesting excessive fat incorporation into the poultry diets to boost energy. In the contrary, commercial feeds have poor protein, metabolizable energy and mineral contents and exhibited low to high noncompliance frequencies. For successful poultry farming, quality of the feed is a determinant factor for growth and production (meat and egg) and every attempt must be put in place to ensure that feed prepared and sold by commercial feed manufacturers contain all the essential nutrients at the right amount for the sustenance of the poultry industry. The selection of feed ingredients for formulation of layers feed should not be compromised; the development of birds largely depends on the nutritive value obtained in the feed ingredients used. To ensure quality and standardization of feeds, frequent monitoring and enforcement of standards in the preparation of feed is cardinal, this will ensure that nutritional feeds are formulated to meet production needs of poultry birds.
Based on the findings, the following recommendations could be drawn.
• There were significant variations among the various means of the feed samples. Some of the feed samples deviates from mean recommended values by the ESI, 2019.
• This situation has serious implications on small scale poultry farmers, who have little capacity to produce their own feeds but rely on relatively expensive commercial feeds, may be incurring higher feed costs than necessary.
• Ensuring that feed prepared and sold by commercial feed manufacturers contain all the essential nutrients at the right amount for the sustenance of the poultry industry.
• The selection of feed ingredients for formulation of poultry feed should not be compromised.
• Encouraging the feed manufacturing industries to give regular training for their technical staffs such as proper feed formulation, feed quality testing and Ethiopian feed standard and their application in feed manufacturing.
• Designing and implementing customer complaint handling mechanisms by feed producers will help them respond to consumer complaints.
The authors declare that there has no conflict of interest.
[Google Scholar] [Crossref] [PubMed]
[Google Scholar] [Crossref] [PubMed]
[Google Scholar] [Crossref] [PubMed]
Veterinary Science & Technology received 4472 citations as per Google Scholar report