Research Article - (2021) Volume 5, Issue 5
Received: 27-Jul-2021
Published:
17-Aug-2021
, DOI: 10.37421/2795-6172.2021.5.137
Citation: Milovanov, Svyatoslav. “Managing Selection of Sites
to Centralized Trials on Stage of Feasibility Based on Calculated Proposed
Recruitment.” J Clin Res 5 (2021): 137.
Copyright: © 2021 Milovanov S. This is an open-access article distributed
under the terms of the Creative Commons Attribution License, which permits
unrestricted use, distribution, and reproduction in any medium, provided the
original author and source are credited.
Introduction: Sites where clinical trial will be conducted is the main place in centralized trials in generation data by the patients. Sites without patients lead to absence of clinical trial data and failed of clinical trial. Feasibility stage in selection of sites for conducting of particular clinical trial is emphasis to presence of needed pool of patients. Recruitment of patients in centralized trials is announcing by PI of clinical sites during the feasibility stage. This is subjective decision of investigator based on integral approach like experience, incidence of disease and many other parameters. The objective approach like calculation is apparently needed for calculation of proposed recruitment on the stage of feasibility.
Materials and methods: Retrospective analysis data of four clinical trials II-III phases, conducted since 2007 to 2017 years.
Aim: To find out the approach for selecting the trial sites on predictive basis using objective methods on the on the stage of feasibility.
Statistical analysis: Data had been collected from feasibility questionnaires, open statistical sources.
Results: It was proposed the formula for evaluation of clinical trial site in perspective of recruitment.
Discussion: Selection of sites might be calculated which will decrease the number of failed clinical trials. We called the calculation “Calculated Proposed Patient’s Recruitment”-CPPR».
Clinical trial • Patients • Investigator • Clinical trials II-III phases • Statistical sources
ORCID ID: Svyatoslav Milovanov-orcid.org/0000-0001-9843-6096
The number of incomplete clinical trials due to the absence and incomplete recruitment of patients is up to 40% [1-3]. In absolute terms, this is 48,000 patients included in 20% of clinical trials that did not recruit the required number of patients [4] out of 2%-4% of patients included in oncological studies in general from the entire population of cancer patients [5]. Since 2008 up to date the cost spending to clinical trials is increased dramatically and in some trials around 100-fold times [6-8]. Content of the cost is different and the major ones are:
• Increased costs of clinical supplies and equipment
• Extended timelines of clinical trials
• Increased regulations, particularly at the clinical and CMC levels
• Monitoring complexities
• Patient recruitment intricacies
• Workforce competence
• Data collection and synergy complexities
The recruitment costs consists up to 60% out of this the above items. Recruitment for the purpose of this article is the integrated value which is means both the process as well as the final figure of patients enrolled to any studies under all of the influenced factors met during the process. Many sources have shown that very many sites that participated in any of the studies did not eventually recruit the proposed number of patients or did not include any patient at all [8-11].
We observed 70 clinical centers participating in phase 2-3 trials in three countries-Russia, Ukraine and Belarus for the period from July 01, 2008 to December 31, 2017 in order to search for the possibility of calculating the estimated set of patients on a specific site at the stage of searching for clinical centers for research. The collection of data was carried out from questionnaires at the stage of searching for centers, from the results obtained at the end of the research, from open statistical sources.
The number of recruited patients, recruitment efficiency and research nosology are presented in Table 1.
| No | Nosology | The number of cities in which centers were opened | Number of clinical centers | Study power-required number of patients |
|---|---|---|---|---|
| 1 | 2 | 3 | 4 | 5 |
| 1 | Lung cancer | 25 | 27 | 450 |
| 2 | Colorectal cancer | 19 | 19 | 340 |
| 3 | Idiopathic purpura | 15 | 15 | 69 |
| 4 | Head and neck cancer neck | 9 | 9 | 982 |
| Total | 68 | 70 | 1841 |
Many authors point out that most centers do not recruit patients. For research purposes, we typed sites based on the rate of recruitment of patients to the study and the actual recruited patients. We took the methodology for determining the rate of gain by Lynam and co [12]. and modified it by dividing the number of patients included in the study and the number of actual months spent by the site on involving the patient in the study.
The sites were divided into four categories depending on the rate of recruitment of patients per month (30 days):
• With a recruitment rate-0 patients per month-silent sites (type 1)
• With a recruitment rate of 0.01 to 0.19 patients per month (that is, 1 patient in five months)-low recruiting (type 2)
• With a recruitment rate from 0.20 to 0.89 patients per month (that is, 1 patient in 5 months -1.4 months)-average recruiting (type 3)
• With a recruitment rate of 0.90 to 3 patients per month, that is, 1 patient in 1.1-0.3 months)-highly recruiting (type 4).
Figure 1 shows that the amount of clinical centers with were no patients within the study was 37%. It is comparable to the NCBI data for 2010 year, where the percentage of sites who did not recruit patients was about 50%. This high percentage affects, at least, the duration of the study.

Figure 1. Breakdown of sites on rate of recruitment.
The distribution of typed centers by recruitment rate in different countries is shown in (Figure 2).

Figure 2. Breakdown of sites on rate of recruitment in countries.
The absence of silent sites in some countries, showed in Figure 2, is highly likely associated with the total number of international multicenter studies for these countries. According to clinicaltrial.gov, 2,744 studies were conducted in Russia from 2008 to 2017, in Ukraine-1143 and in Belarus-135 studies.
The distribution of sites by nosology is shown in Figure 3

Figure 3. Sites types and nosology.
Figure 3 shows that researchers are faced with the absence of patients for research in all pathologies and the percentage of such centers ranges from 15% to 40%. Obviously, this percentage of silent sites directly affects the recruitment duration. It can also be seen that in the case of rectal cancer, a high percentage of silent sites (33%) is compensated by a higher percentage of highly recruited sites (44%), but this is an exception and the general trend is a large percentage of silent sites and a small percentage of highly recruited sites.
After conducting the study, we introduced another parameter-sleeping sites-that is, centers that were activated, but did not recruit patients. Of the 70 selected centers, 15 were inactive and constituted a subset of silent sites that did not recruit a single patient. In the future, we selected parameters that, in our opinion, have an impact on recruitment and which can be used to predict the recruitment of patients during the search for centers. We divided them into parameters before research and after research.
Pre-examination parameters such as Table 2 and Table 3, parameters after clinical study conducted
| S. No | Title of parameters |
|---|---|
| 1 | City |
| 2 | Study title |
| 3 | Country |
| 4 | Nosology |
| 5 | Time from first contact to response in days. |
| 6 | Time from center activation to first screened patient |
| 7 | Proposed patient enrollment |
| 8 | Standard of living |
| 9 | Key opinion leader, yes or no |
| 10 | Incidence per 1000 capita |
| 11 | Number of newly diagnosed cases in the country |
| 12 | Investigator experience in years |
| 13 | Number of clinical centers in one region |
| s.no | Title of parameters |
|---|---|
| 1 | Site type |
| 2 | Time to recruit patients in days |
| 3 | Estimated number of patients per protocol (study power) |
| 4 | Number of inclusion/ exclusion criteria |
| 5 | The final recruited number of patients on the site |
| 6 | Whether the site is activated or not |
| 7 | Duration of patient recruitment from center activation to the last recruited patient in the clinical center (by weeks) |
A partial description of the parameters within the scope of the article is presented below
Pre-study parameter no 1: Is the city where the clinical center is located. This parameter is obviously related to demographics and distances. According to the literature Wei [13], it was noted that most adult patients in Washington spend 30 minutes and 22 miles from their place of residence to receive medical care. Over this time and distance, patients experience difficulties and may miss visits to the clinical center. Also, these authors noted the difference in living in the city and outside the city, which was also reflected in the visits of patients to the center and is associated with the transport infrastructure. We studied studies that were conducted in cities with different populations. We have divided them into 3 categories-1) less than 1 million residents, 2) from 1 million to 2 million and 3) more than 2 million residents. The distribution is shown in Table 4.
| Number of city residents | Enrollment effectivity of sites involved in the study (in %) | ||||
|---|---|---|---|---|---|
| Silent sites | Low - recruiting sites | Middle -recruiting sites | High- recruiting sites | Total | |
| 1 | 2 | 3 | 4 | 5 | 6 |
| < 1 мlн | 52 | 42 | 6 | 0 | 100 |
| 1-2 мlн | 11 | 44 | 33 | 12 | 100 |
| >2 мlн | 40 | 22 | 14 | 24 | 100 |
It can be seen that in cities with a population of more than 1 million, the number of centers with a high enrollment of patients is twice as high, which is most likely due to the developed infrastructure and confirms the literature data.
Pre-study parameter no 2: Study title indicating the complexity of the protocol. Protocol design in the literature is often the cause of poor patient recruitment [14-16]. We found that in phase III the percentage of silent sites was 21%, in the second phase it was 33%.
Parameter before study no 3: Country of localization of the clinical center (number of residents, size of patient population, number of clinical trials simultaneously conducted in the country). This parameter has a significant role as a regulatory factor. We studied three countries-Russia, Belarus and Ukraine. The number of studies in 2007-2018 was less than 1000 per year, although the number of residents was more than 200 million compared to Israel in the same period, where more than 40,000 studies were conducted per year with an 8 million population.
The parameter before the study no 4: Is nosology (the disease due to which the clinical study is carried out). We have researched clinical trials in oncology and hematology.
The parameter of the site's response time from the first contact (in days) to study no 5: Is a parameter to which we paid special attention, since it is this parameter, in our opinion, that carries an integral assessment of predicting the recruitment of patients and the overall operation of the site. According to the literature, patient enrollment is influenced by the time from ethical approval of the study to enrollment of the first patient [17].
We also took the parameter before study no 6: The time from site activation to the first included patient. No literature data for this parameter was found.
Pre-study parameter no 7: Proposed Patient Enrollment is the patient enrollment plan predicted by the Principal Investigator during the search phase for clinical sites to conduct a clinical trial. The estimated patient enrollment is also an integral parameter based on many factors the experience of the researcher, the number of patients, etc. According to the literature, failure to achieve this parameter led to more than 2000 unsuccessful studies [18], at the same time, the implementation of this parameter led to the success of the study [19]. This parameter is most likely to be met with a large population. The quantitative approach associated with the fulfillment of this parameter in the literature includes the patient recruitment rate obtained by the protocolplanned study power, patient recruitment time, and number of centers [20]. Our data is shown in Figure 4. We also found that in regions with a large population, this parameter is more likely to be used.

Figure 4. Percentage of performance of the proposed enrollment of patients.
Parameter before research no 8: standard of living-average salary for site location. The relationship between the financial parameter and the enrollment of patients has been traced by many authors [21,17,6] Also, the authors note this parameter as a negative effect on the enrollment of patients [22-23] and positive [24].
Pre-study parameter no 9: Whether the Principal Investigator is also an opinion-forming industry leader, in our view plays a role in patient recruitment. Literature data was not found for this parameter.
Parameter before study no 10: “Prevalence of the disease per 1000 population” and
Parameter before study no 11: The number of newly diagnosed cases in the country are related and were taken as they obviously have a connection with the enrollment of patients. However, we did not find literature data. According to Our data (Figure 5) in cities with high morbidity, the percentage of sites that have fulfilled and overfull filled the expected set of patients is close to 100%.

Figure 5. Performance of enrollment and morbidity.
Pre-research parameter no 12: Experience of the principal investigator in years. We did not find literature data for this parameter. According to our data=we analyzed
1. Experience of the investigator.
2. Potentially stated patient recruitment plan at the beginning of the study.
According to the researcher's experience, the site was divided into three categories
• With work experience up to 4 years-beginners.
• With work experience from 4.1 to 6.9 years-experienced.
• With more than 7 years of work experience-with extensive work experience.
The analysis reveals a picture of double the percentage of silent sites (43%) in centers with more than 7 years of Principal Investigator experience. This fact can be interpreted as a great activity in the search for patients of young researchers earning a reputation for themselves, but this percentage of activity goes into low recruiting. The number of highly recruited sites is approximately the same in all groups (Figure 6).

Figure 6. Experience of investigators.
Sites that potentially had patients and planned to recruit a certain number of patients are divided into four groups
• Up to 1 patient-low patient recruitment potential;
• 1 patient to 10-moderate patient recruitment potential;
• From 11 patients to 23-average patient recruitment potential;
• More than 23 patients-high potential for patient recruitment
Analysis of the data in Figure 7 shows that centers that planned average patient enrollments generally met their plans. Centers that initially underestimated recruitment plans did not strive to fulfill them and, as a consequence, had a high percentage of complete absence of recruitment and lack of high recruitment. Centers that initially overestimated their recruitment plans had the highest percentage of complete absenteeism, but this percentage was partially offset by the presence of high recruitment (8%).

Figure 7. Breakdown of sites depending on patients to be planned involved to study.
Experiences of Principal Investigators in relation to recruitment plans are presented in Table 5.
| Silence % | |||
|---|---|---|---|
| Experience up to 4 years | Experience 4.1-6.9 years | Experience over 7 years | |
| Up to 1 patients | 33,3 | 33,3 | 33,3 |
| 2 up 10 | 0 | 100 | 0 |
| 11 to 23 | 50 | 0 | 50 |
| over 23 | 0 | 72 | 28 |
| Low recruiting % | |||
| Experience up to 4 years | Experience 4.1-6.9 years | Experience over 7 years | |
| Up to 1 patients | 43 | 57 | 0 |
| 2 up 10 | 0 | 33 | 67 |
| 11 to 23 | 100 | 0 | 0 |
| over 23 | 0 | 100 | 0 |
| Middle recruiting % | |||
| Experience up to 4 years | Experience 4.1-6.9 years | Experience over 7 years | |
| Up to 1 patients | 50 | 50 | 0 |
| 2 up 10 | 0 | 100 | 0 |
| 11 to 23 | 50 | 17 | 33 |
| over 23 | 0 | 100 | 0 |
| High recruiting % | |||
| Experience up to 4 years | Experience 4.1-6.9 years | Experience over 7 years | |
| Up to 1 patients | 0 | 0 | 0 |
| 2 up 10 | 25 | 25 | 50 |
| 11 to 23 | 25 | 50 | 25 |
| over 23 | 0 | 100 | 0 |
Analysis of the data in Table 5 is primarily necessary for silent sites that have not recruited a single patient. Among the silent sites that initially assess their potential for recruiting patients as high, there are no researchers with up to 4 years of experience. Among the silent sites, all groups of researchers who rated the potential as low participated in the study on thrombocytopenic purpura, a rare disease. Silent sites with experienced investigators and extensive experience overestimated potential patient recruitment, requiring further analysis. Among the highly recruited sites, researchers with different experience of participation in research do not have sites that initially assess the potential for recruiting patients as low.
Parameter before the clinical study no 13: The number of centers opened in one city. We did not find literature data on this parameter.
Parameters after completion of the study
Post-study parameter no 1: Site Type, indicating the success rate of patient recruitment-this parameter was empirically obtained based on the final recruitment of patients by each site. 4 types of site were identified. Type 1-silent sites with zero patient recruitment, type 2-low recruiting, type 3-medium recruiting, and type 4-high recruiting.
Parameter after clinical study no 2: Recruitment period (in days)-time period from site activation to the last recruited patient.
Parameter after study no 3: The number of patients prescribed in the study protocol.
Parameter after study no 4: The number of inclusion and exclusion criteria is a very often cited parameter by many authors [25-26].
Parameter after study no 5: Actual number of patients finally recruited on the site
Parameter after study no 6: Site activation (1=activated, 2=deactivated)” whether the site was initiated for recruiting patients or was not. Uninitiated sites are called dormant sites by us, in contrast to silent sites, that is, which were activated (initiated), but did not recruit patients.
Parameter after clinical study no 7: “Recruitment duration-the period from activation of the study to the last recruited patient.” Literature data for the given parameter is not found.
Statistical analysis
As a result, we have got 70 different values for each selected parameter.
Next, we used one-way analysis of variance, correlation analysis from excel 2016. After that, 7 parameters were selected
• Proposed recruitment in the stage of feasibility.
• The number of residents in the region where the center is located.
• Investigator experience.
• Number of clinical centers in one region.
• The number of people living in the country.
• Is the investigator a key opinion leader and
• Time until the first response from the clinical center at the stage of feasibility.
Further, regression analysis was applied to the selected parameters.
It can be seen that the selected types of sites differ statistically significantly not only in the dialing speed and in the finally dialed numbers of patients. Correlation analysis for parameters with normal and atypical distribution did not reveal persistent relationships between the selected parameters. Based on the studied parameters, we carried out a regression analysis from the statistical package excel 2016 (Tables 6 and 7). The resulting dependence is as follows
| No | Parameters | Statistical values | |||
|---|---|---|---|---|---|
| Мin-mаx | s | X ± D | CV, % (variation) | ||
| 1 | 2 | 3 | 4 | 5 | 6 |
| Parameters before the study | |||||
| Time from first contact to response in days | 1-120 | 1,9 | 24,16 ± 0,97 | 90,3 | |
| Time from center activation to first screened patient | 0-480 | 9,5 | 76,3 ± 4,74 | 140,3 | |
| Intended patient enrolment | 2-25 | 0,4 | 10,6 ± 0,21 | 44,4 | |
| Standard of living (USD per year) | 2024,21-12770,88 | 454,0 | 8884,28 ± 227 | 57,7 | |
| Principal Investigator Experience in Years | 0-12 | 0,2 | 5,7 ± 0,1 | 36,6 | |
| Parameters after the study | |||||
| Site type | 1 - 4 | 0,1 | 2,1 ± 0,05 | 50,9 | |
| Time to recruit patients in days | 728-1092 | 13,3 | 806,3 ± 6,7 | 18,6 | |
| Estimated number of patients per protocol (study power) | 69-982 | 23,4 | 394,3 ± 11,7 | 67,1 | |
| Number of criteria to include exclusion | 21-28 | 0,3 | 25,7 ± 0,13 | 11,6 | |
| The final recruitment of patients on the site | 0-75 | 1,4 | 8,9 ± 0,7 | 182,6 | |
| Duration of patient recruitment from center activation to the last recruited patient in the center (in weeks) | 0-104 | 2,0 | 70,2 ± 0,98 | 31,7 | |
| No | Parameters | Statisitical values | |||
|---|---|---|---|---|---|
| Мin-маx | s, confidence interval | Мin-маx | CV, % (the coefficient of variation) | ||
| 1 | 2 | 3 | 4 | 5 | 6 |
| Low recruiting, patient recruitment | 1-6 | 0,13 | 2,65 ± 0,06 p1,2<0,01 | 55 | |
| Medium recruiting | 7-22 | 0,36 | 10,8 ± 0,18 p2,3<0,01 | 38 | |
| Highly recruited | 32-75 | 3,8 | 44,2 ± 3,8 | 37 | |
Type of site=(-1388.04)+(-0.00439 × (Parameter A))+(0.000972 × (Parameter B))+(-54.996 × (Parameter C)) +(0.034 × (Parameter D))+(0,00000145 × (Parameter E))+(0.699 × (Parameter F))+(0.207 × (Parameter G)) +(2,21 × (Parameter H)) +(-3,316 × (Parameter I)) +(-0,0904 × (Parameter J))®*
Note:*Protected by private right. Any refer or using prohibited without the permission by Dr. Svyatoslav Milovanov
1. Parameter A: First feedback by site in days.
2. Parameter B: Site number
3. Parameter C: Number of planned recruitment rate per month perprotocol
4. Parameter D: Number of proposed patients
5. Parameter E: New cases of protocol nosology of diseases per year
6. Parameter F: Year of data record
7. Parameter G: Is investigator KOL or not
8. Parameter H: value 1/time to feedback in days
9. Parameter I: value 1/proposed patients by site
10. Parameter J: Number of planned protocol patients
To check the predictive value of the obtained formula, we performed an ROC analysis with the determination of sensitivity and specificity. The resulting ROC curve is shown in Figure 8. Based on the formula, it can be seen that using the formula it is possible to cut off centers that will definitely not recruit patients, provided the formula value is less than 1.5, and precisely the centers will be considered highly recruiting if the formula value is more than 3.4 for values greater than 1.5 to 2.4, we can say with a high probability that we have a low-recruiting site, and with values from 2.4 to 3.4, an average recruiting site.

Figure 8. ROC-curve of dependence.
ROC AUC was calculated using the formula
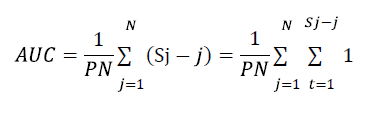
ROC AUC=0,647
Substituting the actually obtained values, we get that: At values of 0-1.5, the formula clearly defines the sites that will not recruit patients that is, silent sites
1. For values greater than 1.5-2.4, the formula clearly defines the sites that will recruit patients at the rate of a low-recruiting site type, that is, the recruitment rate is from 0.01 to 0.19 patients per month (that is, 1 patient in five months)
2. For values greater than 2.4-3.4, the formula determines the sites that will recruit patients at the rate of the average recruiting site type, that is, the recruitment rate is from 0.20 to 0.89 patients per month (that is, 1 patient in 5-1.4 months)
3. For values greater than 3.4, the formula clearly defines the sites that will recruit patients at the rate of a highly recruiting site type, that is, with a recruitment rate of 0.90 to 3 patients per month, that is, 1 patient in 1.1-0.3 months.
The use of quantitative measures to improve the outcome of events (for example, clinical trials) is obvious and well studied by Lopez et al. [7,27,20] Recruitment is like the beginning of any research and as an important part of it, it attracts attention very much [28]. The distribution of parameters is also different and can be divided depending on the research results, research phase,
costs and many others [28-29]. Fogel mentions, in particular, that studies of patient recruitment dependences on distance to site have been missed, and this author also notes that the study of other addictions often becomes critical for the recruitment and retention of patients in a clinical trial [29].
A review of the literature on this subject over the past 30 years was conducted, and it was emphasized that the cost of phase III is not only the cost of the phase III itself, but also of all previous trials [29]. According to this study, the reasons for trial failure can be grouped into two large groups-efficacy and safety, but emphasizes that patient recruitment is one of the common reasons. It was emphasized that the failure to recruit the required and calculated number of patients to prove the efficacy and safety of the study drug is a long-standing problem [30]. The number of incomplete clinical trials due to lack of recruitment of patients is up to 40% [1-3]. The absolute number of this failure is 48,000 patients, included in 20% of trials, failing to recruit 19 out of 2%-4% of patients enrolled in cancer studies in the general population of cancer patients [5]. It was lung cancer and colon cancer with an equal distribution between men and women on six different insurance policies in the United States. The authors noticed a correlation between medical specialty and patient enrollment: an oncologist typically recruits patients with advanced cancer (69%), and surgeons recruit patients with an early stage. The authors also found that it took 4000 hours to recruit 20 patients. So, we see the importance of the time parameter and the correlation of this parameter with the patient population. It can also be seen that patient enrollment is an important part of research progress in any phase of a clinical trial. The clinical site, as a place where patients should come, greatly influences the recruitment of patients, and at the same time the site itself depends on this influence, the recruitment may or may not satisfy the stated research objectives. Failure to recruit patients at the research center level is poor recruitment, high dropout rates, and sometimes insufficient trial capacity.
From the very beginning of the study on the site, there is a large gap between the expected enrollment of patients and the actual eligible patients [16,14]eventually collected the declared number of patients or did not include any patient at all (silent sites) [8-11]. Reasons These outcomes are very different: implementation of a well-defined “system” of patient recruitment, involvement of other staff, time from ethics approval to first hiring, provision of a dedicated trial coordinator [31]. S Milovanov [11] proposes to name clinical centers in which patients are absent throughout the entire study period-silent sites
Thus, there remains a need to find a way to select a sites which will recruit the patients and do not select the sites without the patients.
We have developed a formula to managing a site’s selection on the stage of feasibility by the calculating the particular specific site based on the selected parameters that characterize the site. We call it Calculated Proposed Patient Recruitment (CPPR).
This estimate allowed us to predict the sites with patients at the stage of search of clinical centers based on the following
• If the CPPR is in the range ≤ 1.4, then these sites will not give us the patients
• If the CPPR is more than 1.4 but less than 3.4 so these sites will recruit the patients with low or middle speed of recruiting
• If the CPPR is in the range>3.4, then this is probably a high recruiting sites.
Journal of Clinical Research received 11 citations as per Google Scholar report