Review Article - (2023) Volume 14, Issue 4
Received: 13-Jan-2023, Manuscript No. BEJ-23-87116;
Editor assigned: 16-Jan-2023, Pre QC No. BEJ-23-87116 (PQ);
Reviewed: 31-Jan-2023, QC No. BEJ-23-87116;
Revised: 13-Apr-2023, Manuscript No. BEJ-23-87116 (R);
Published:
20-Apr-2023
, DOI: 10.37421/2151-6219.2023.14.442
Citation: Arewa, Ajibola, Emmanuel Chukwuemeka, Ejianya, Olufemi A Ajose and James Ayodele Owoputi, et al. "Long Memory Dependence over Cycles in Nigerian and South-African Stock Markets." Bus Econ J 14 (2023): 442.
Copyright: © 2023 Arewa A, et al. This is an open-access article distributed under the terms of the creative commons attribution license which permits unrestricted use, distribution and reproduction in any medium, provided the original author and source are credited.
The study adopts a time series data to investigate long memory dependence over stock market phases of some selected sub-Saharan African countries. The data for this study were collected from from 2012 to 2022. Data on stock index of Nigeria and South Africa were sourced from that site. The estimation techniques for this study are R/S (Rescale regression analysis) and ARFIMA (Autoregression Fractionally Integrated Moving Average) models. It is concluded that Nigeria stock market return has long memory in return that is current returns are correlating with future return. Similarly, in South Africa stock market current return correlate with future return in a short range. Thus, the results from this study can be used by investors to create risk and portfolio management methods because the fundamental element of anticipating return is present. Instead of using behavior patterns like herding, investors can make buy and sell choices using fully built trading algorithms.
Investigate • fractionally integrated • Algorithms • Climatic situation • Rescale regression
The investigation of long memory has made several researchers to adopt different techniques of estimating the long memory properties of the stock market, oil market and so on. According to Graves, et al. a lot of researchers had employed various methods to analyze the existence of long memory in the stock market. They stated that some researchers examined areas like climatic situation, irrigating, statistics, trading and econometrics to evaluate the processes of forecasting in relation to different estimation techniques to test long range dependence. Using fractionally integrated approaches, Anoruo and Gil-Alana previously looked at the behavior of stock prices in numerous African nations [1]. The writers were unable to uncover any proof of extended memory in returns. According to Crato, Sowell, Cheung and Lai and Lobato and Savin long memory is not presence in daily returns levels [2].
In contrast, Ding, et al. get substantial evidence of long memory in the squared and absolute returns by examining the long-memory features of various transformations of the absolute value of daily returns on the Standard and Poor's (S and P) 500. To come on the empirical conclusion that the historical volatility of the Saudi Stock Exchange and the long-memory nature of TASI returns contravene the efficient market hypothesis, Lamouchi employed the ARFIMA technique to TASI returns. Her results have a policy implication in that it encourages investors to take use of this edge to generate abnormal profits. The Indian stock market, which is an emerging market, was studied by Hiremath and Kumari. The Andrews and Guggenberger test for long-term memory was employed in the study. They looked at 29 daily return indices from the nine years of trading. The study's findings demonstrate the high long-range dependence of the investigated mean returns. The results also suggest that modifications in India's microstructure have not produced the intended informational efficiency and that capitalization and liquidity contribute to long memory qualities in prices [3].
Using the FIEGARCH model, Ogega examined the NSE for volatility, persistence, and asymmetry in returns volatility and discovered evidence of persistence in bullish phases, where unexpected positive returns caused more volatility than unexpected negative returns of the same intensity, as well as unexpected negative returns in bearish 20 phases, which were more volatile than unexpected positive returns of the same intensity. This makes reference to market inefficiency and information asymmetry.
In the study of Sowell, Crato, Cheung and Lai, Lobato and Savin, there is evidence of long memory in the absolute return and squared returns [4].
Several studies have been conducted on the long memory characteristic of the stock market prices, especially in the developed economy. However, little study has been carried out in developing or under developed economies. Also, there exist gap in the literature as different authors found out different results on the subject matter. Thus, this present study is conducted in order to bridge the gap in the literature and add to existing studies by analyzing one how COVID-19 influences the long run dependence of return, two the fractal nature of return and lastly if there is long term linear dependence in stock returns over stock market phases of some selected sub-Saharan Africa countries.
Research on long memory processes may have been influenced by Hurst, who measured long memory using Rescaled Range analysis, which takes the scaling behavior of the range of partial sums of the variable under study [5]. Since the introduction of the theoretical analysis in 1976, a number of literatures have used a variety of factors to examine stock market behavior. The theoretical underpinning for the multifactor framework, which is used to calculate stock market prices and long memory mechanisms, is laid out in the Arbitrage Pricing Theory (APT), which was developed in 1976. The behavior of stock prices will theoretically be impacted by any anticipated or unanticipated entry of new information on macroeconomic basis through expected dividends, discount channels, or both.
Long memory or long-range reliance is a critical aspect of stock market returns that deviate from the random walk hypothesis as a result, and it has drawn a lot of attention over the past years. Strong temporal dependency can be seen in the realizations of the underlying time series at extremely distant observations when the stationary process has a long memory [6]. If stock returns demonstrate long-term reliance, data that are widely separated in time exhibit strong autocorrelation. The continuous temporal dependency between distant observations, which denotes potential predictability, provides the opportunity for speculators to predict future returns using historical data and profit from anomalous returns.
The existence of long memory in stock returns undermines the Efficient Market Hypothesis (EMH), which claims that "current prices represent all the available and relevant information," as it is hard to predict future stock prices when past information is used. Additionally, in the case the market has long memory; this would cause the asset-pricing model to be erroneous. Yajima asserted that statistical inference about asset-pricing models based on conventional testing methodologies, as well as martingale model pricing of derivatives, may not be appropriate if the underlying continuous stochastic processes of asset return exhibit long memory. When there is long memory in the market, it is certain that linear modeling may also result in incorrect findings [7].
Market participants, academics, and decision-makers are consequently growing more interested in comprehending these marketplaces. The existence of long memory characteristics in stock market returns remains despite the weak factual support provide empirical investigations, and this fact has important implications for capital market theories. Because long memory dynamics exist, average asset returns show nonlinear dependence. The fundamental implication of this situation is that return prediction is possible as stock market prices do not behave arbitrarily, which is a categorical denial of the efficient market theory. Theoretical and econometric asset pricing models, statistical testing of price models based on established statistical methodologies, and forecasting would also be questioned.
The topic of long memory hasn't drawn much attention in the developing markets, although having important theoretical implications and practical relevance. Because of insufficient liquidity, immature financial tools, and lax regulatory frameworks, stock returns in developing markets are said to have a long memory. Aidoo, et al. looked at the existence of long memory dynamics in the Ghana Cedi to US Dollar exchange rate. The study used monthly time series data from January 1990 to January 2012 for the analysis. Additionally, the rescaled range and modified rescaled-range tests were used as a method of data analysis, and it was concluded from the results that the exchange rate possessed significant evidence of long memory features. In light of the findings, the authors argued that the higher exchange rate will be followed by another higher exchange rate and that the reverse situation is also valid, i.e., that the exchange rate is predictable and the potential for constant speculative profit exists [8].
To analyze the return and volatility behavior of three markets (Botswana, South Africa and Zimbabwe), Jefferis and Thupayagale used the Auto Regressive Fractionally Integrated Moving Average (ARIMA-FIGARCH) model. The study's findings showed that each of the three stock markets is characterized by a different long-memory behavior of returns: statistically significant in Botswana, statistically insignificant in South Africa, and anti-persistent in Zimbabwe. Time series data of share prices and return were used in the study. The study discovered persistent volatility with long memory in the share markets of Zimbabwe and South Africa, but not in Botswana [9].
Method
The study aims to add to the body of knowledge already available on the test of long memory dependence over stock market phases of some selected sub-Saharan African countries. To fill the void that was found in this study, the researcher gave a solid methodology. The study aims to investigate the the long memory dependence over stock market phases of particular sub-Saharan African countries. The population, sample size/method, model specification, and model estimation technique are all covered in this chapter [10].
Data
The study adopts a time series data. The data for this study were collected from year 2012 to 2022. Data on stock index of each of the two countries (Nigeria and South Africa) chosen were sourced from that site.
Model specification
In this study the researcher proposes to use a parametric method to evaluate long memory dependence of the selected markets in sub-Saharan African countries. The parametric method employ for the study are R/S (Rescale regression analysis) and ARFIMA (Autoregression Fractionally Integrated Moving Average). These models have been used in several study for example Guglielmo Maria Caporale, Luis Gil-Alana, and Alex Plastun (2019) employed the method of R/S (Rescale regression analysis) [11].
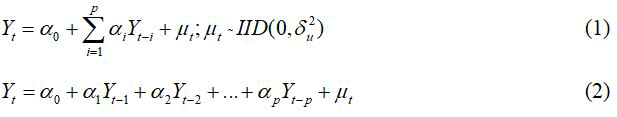
To introduce the ARFIMA (pdq) specification, let’s start from the autoregression of order p.
By definition autoregression shows a relationship between the current value of a variable Yt and its lag values plus a random disturbance term.
Where,
Yt is defined as the returns of stock market index.
Σ is the summation operator; p is the lag length that is the maximum number of length that will be in the model.
μt~IID (0,δu2) means that the disturbance/error term follows a normal distribution with zero mean and constant variance.
α0 is the constant term.
αi=α1,…,αp are the equations slopes or coefficients.
Introduce backward shift operator (L).
αL=1-Σpi=1 αiLi>1, for AR (p) process to be stationary.
Note: if any of the coefficient is significant it means there is a significant correlation between present return and previous returns that means that the market is inefficient [12].
α1L-α2L2 -…- αpLp this is the autoregressive polynomial.
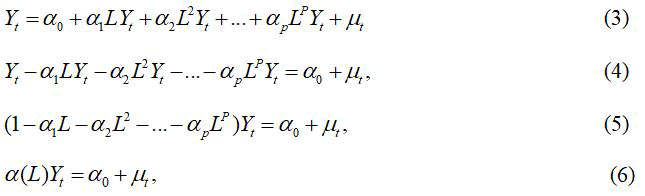
Let move to moving average of under q. the moving average of under q is defined as a regression that relates the current value of a variable to its previous values or lag values of a random disturbance term.
MA (q)
If the root of the polynomial lies outside the unit circle it means the process is stationary but if it lies within the unit circle it means that the process is not stationary. If the absolute value of the AR or MA root lies outside the unit circle it shows that the process is stationary but if it lies within the unit circle it means that the process is not stationary.
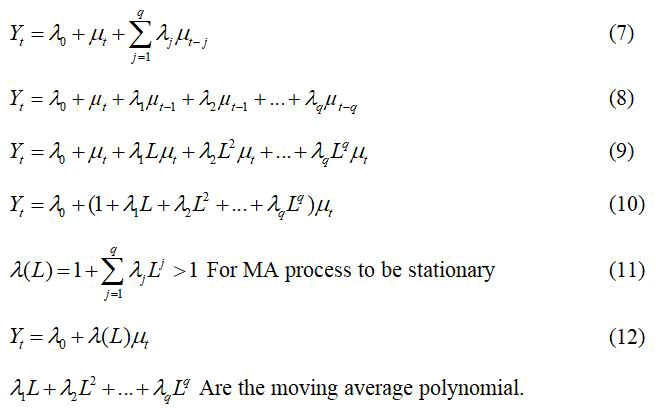
ARMA (pq) are as follows

However, if the polynomials of the autoregression of AR(p) or and the polynomials of the MA (q) lies within the unit circle this process is not stationary. Therefore, it needs to be integrated to obtain autoregressive integrated moving average. It is defined as follows [13].
ARIMA (pdq)
Where,
R is range of a given sample.
S is the standard deviation of a given sample.
n is time.
H is the Hurst exponent or coefficient.
t=0,1,…n
n is the number of the sample.
Where E(R/S)t is the average value of the standard range of the given contagious samples. It can be obtained as follows:
E(R/S)0 is computed by dividing the range (max-min) of the entire sample by the entire sample standard deviation to give observation 1 or (t1).
E(R/S)1 is computed by dividing the entire sample by 2 to have two equal sample size, and then calculate the range and the standard deviation of each of the sample, then divide the range by the standard deviation of each of the sample and find the average value of the R/S of the two samples to give observation 2 (t2) E(R/S)2. The next step is to divide the entire sample by 4 and repeat the process again to give observation 3. Note it is been increased by a multiple of two then the preceding process are repeated to have the other observations until the two sample is left [14].
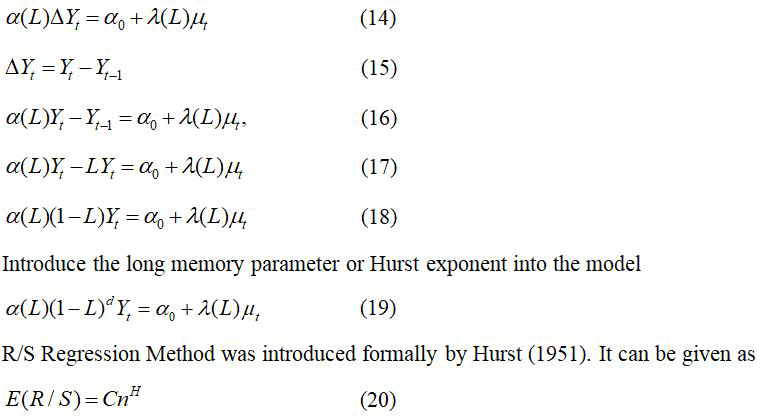
The relationship between d and H.
H is the hurst exponent and d is the ARFIMA memory parameter.
H=2(d)+½
H=d+½
If d=0
Then H=0.5 in this case there is stochastic random process, no memory, making the market to be efficient or white noised.
If d<0
H<0.5, there is presence of reversibility, that is there is presence of local trend, which permit prediction in short range. Here increase follow decrease and decrease follow increase. The market is pink noised.
If d>0
H>0.5, there is presence of long-range dependency, increase follows increase and decrease follow decrease. The market is black noised.
Estimation technique
The estimation techniques for this study are R/S (Rescale regression analysis) and ARFIMA (Autoregression Fractionally Integrated Moving Average) models.
Descriptive statistics
The data employed in examining the impact of long memory dependence in returns of selected stock markets were described using mean and standard deviation. This is presented in Table 1 and Table 2 below for the overall sample of Nigeria and South Africa.
| Variable | Mean | Obs | Std. dev. | Min | Max |
|---|---|---|---|---|---|
| Price | 2,620 | 33230.49 | 7372.727 | 20123.51 | 54085.3 |
| Return | 2,620 | 0.000451 | 0.009693 | -0.0426 | 0.083123 |
| Source: Stata output | |||||
Table 1. Descriptive statistics for Nigeria overall sample.
Table 1 shows the mean values of stock market price and return for Nigeria overall sample. The total observation here is about 2620. The mean value of return and the standard deviation are very low.
The maximum value of stock market return is very low also its minimum value is negative.
| Variable | Obs | Mean | Std. dev. | Min | Max |
|---|---|---|---|---|---|
| Price | 2,646 | 47511.33 | 8870.66 | 28971.82 | 71057.56 |
| Return | 2,646 | 0.000315 | 0.011357 | -0.09923 | 0.082281 |
| Source: Stata output | |||||
Table 2. Descriptive statistics for South Africa overall sample.
Table 2 displays the descriptive statistics for South Africa overall sample set. In this table the mean value standard deviation minimum, maximum and the total number of observations were recorded [15]. The total observation is 2646 and the minimum value of stock market return is approximately -0.099.
Inferential statistic result
The result of the inferential statistic reported in this section is based on the hypotheses stated in the first chapter of this work. Which is one to test whether current returns are correlated with future returns? Two to test whether the selected stock markets are efficient or inefficient before, during and after the COVID-19 pandemic. And lastly, to test the cycles of the market in which returns are irreversible or predictable. These hypotheses are tested based on the estimation ARFIMA (Autoregression Fractionally Integrated Moving Average) long run memory parameter (d) and Hurst exponent (H).
The test of whether current returns are correlated with future returns
The test of whether current returns are correlated with future returns is conducted for the overall sample both for Nigeria and South Africa and the results are reported in the Table 3 and Table 4 below [16].
| Return | Coef. | Std. err. | z | P>|z| | 95% conf. interval | |
|---|---|---|---|---|---|---|
| ARFIMA | ||||||
| Cons | 0.000467 | 0.000357 | 1.31 | 0.191 | -0.0002331 | 0.0011663 |
| Ar (-1) | 0.170923 | 0.105802 | 1.62 | 0.106 | -0.0364448 | 0.3782904 |
| Ma (-1) | 0.06685 | 0.0872864 | 0.77 | 0.444 | -0.1042279 | 0.2379285 |
| d | 0.056852 | 0.0317101 | 1.79 | 0.073 | -0.0052983 | 0.1190032 |
| Hurst exponent | ||||||
| H | 0.556852 | |||||
Table 3. The results on the test of whether current returns are correlated with future returns for Nigeria overall sample.
The Table 3 above presents the results on the test of whether current stock return is significantly related to future return using ARFIMA long memory parameter (d) and the Hurst exponent (H). We can see from the table above the coefficient d is approximately 0.057 and it is significant at 10% given the probability value.
The associated Hurst exponent H is approximately 0.6 or 60%. This means that Nigerian stock market return exhibit a significant correlation between current and future stock returns. Thus, there is presence of long memory in the market for the period 2012 to August 2022.
| Return | Coef. | Std. err. | z | P>|z| | 95% conf. interval | |
|---|---|---|---|---|---|---|
| ARFIMA | ||||||
| cons | 0.000318 | 0.000145 | 2.19 | 0.028 | 0.0000335 | 0.000601 |
| Ar (-1) | -0.86522 | 0.041025 | -21.09 | 0 | -0.945622 | -0.78481 |
| Ma (-1) | 0.901427 | 0.03437 | 26.23 | 0 | 0.8340642 | 0.968791 |
| d | -0.05916 | 0.016403 | -3.61 | 0 | -0.091306 | -0.02701 |
| Hurst Exponent | ||||||
| H | 0.440842 | |||||
| Source: Stata output | ||||||
Table 4. The results on the test of whether current returns are correlated with future returns for South Africa overall sample.
In the Table 4 above the results of the test on whether current stock return is significantly related to future returns for the period between Jan 2012 to August 2022 are presented. The memory parameter (d) is computed from ARFIMA and it has a coefficient value of approximately -0.059. And the Hurst exponent (H) has a coefficient value of approximately 0.441. The Hurst exponent (H) is less than 0.5, this is an indication that the South Africa stock market for this period is predictable in short range. That is the market has short memory. Also, this test is significant at 1% alpha value [17].
The test of whether the selected stock markets are efficient or inefficient before, during and after the COVID-19 pandemic
The test of whether the selected stock markets for the study are efficient or inefficient before, during and after the COVID-19 pandemic is conducted for both Nigeria and South Africa and the results are reported in the Tables 5-7 below.
| Return | Coef. | Std. err. | z | P>|z| | 95% conf. interval | |
|---|---|---|---|---|---|---|
| Nigeria | ||||||
| ARFIMA | ||||||
| Cons | 0.00053 | 0.000382 | 1.39 | 0.166 | -0.00022 | 0.0012796 |
| Ar (-1) | 0.220212 | 0.096934 | 2.27 | 0.023 | 0.030224 | 0.4101998 |
| Ma (-1) | 0.129973 | 0.073177 | 1.78 | 0.076 | -0.01345 | 0.2733969 |
| d | 0.005902 | 0.041003 | 0.14 | 0.886 | -0.07446 | 0.0862667 |
| Hurst exponent | ||||||
| H | 0.505902 | |||||
| South Africa | ||||||
| ARFIMA | ||||||
| Cons | 0.000335 | 0.000136 | 2.47 | 0.014 | 0.000069 | 0.0006006 |
| Ar (-1) | -0.75304 | 0.164925 | -4.57 | 0 | -1.07629 | -0.42979 |
| Ma (-1) | 0.789218 | 0.151727 | 5.2 | 0 | 0.491839 | 1.086598 |
| d | -0.08464 | 0.021833 | -3.88 | 0 | -0.12743 | -0.04185 |
| Hurst exponent | ||||||
| H | 0.41536 | 0.41536 | ||||
| Source: Stata output | ||||||
Table 5. The results on the test of market efficiency before COVID-19 in Nigeria and South Africa.
As shown in Table 5 above the outputs on the test of whether the selected stock market returns are efficiency or not before the COVID-19 pandemic. The period for this sample size is from 2012 to 2018. In the case of Nigeria, the memory parameter has a coefficient value of approximately 0.0059 with probability value of 0.886. The hurst coefficient of approximately 0.506. This result implies that the Nigerian stock market return is inefficient [18].
It has long memory dependence in returns before COVID-19 pandemic. That is the market is black noised. The coefficient of d for South Africa is approximately -0.085 with associated probability value of zero. The coefficient of H is roughly 0.415. This is also a situation of inefficient. That is the market has short memory dependence in return before COVID-19. The next table gives the output on the test market efficiency during COVID-19.
| Return | Coef. | Std. err. | z | P>|z| | 95% conf.interval | |
|---|---|---|---|---|---|---|
| Nigeria | ||||||
| ARFIMA | ||||||
| Cons | 0.000533 | 0.0007187 | 0.74 | 0.458 | -0.0008758 | 0.0019417 |
| Ar (-1) | 0.434541 | 0.2765651 | 1.57 | 0.116 | -0.1075168 | 0.9765984 |
| Ma (-1) | 0.334476 | 0.246977 | -1.35 | 0.176 | -0.8185415 | 0.1495904 |
| d | 0.120581 | 0.0747471 | 1.61 | 0.107 | -0.0259206 | 0.2670825 |
| Hurst exponent | ||||||
| H | 0.620581 | |||||
| South Africa | ||||||
| ARFIMA | ||||||
| Cons | 0.00029 | 0.0004455 | 0.65 | 0.515 | -0.000583 | 0.0011634 |
| Ar (-1) | -0.23034 | 0.3818445 | -0.60 | 0.546 | -0.9787417 | 0.5180613 |
| Ma (-1) | 0.187797 | 0.396103 | 0.47 | 0.635 | -0.5885505 | 0.9641448 |
| d | 0.004445 | 0.0429087 | 0.10 | 0.917 | -0.0796541 | 0.088545 |
| Hurst Exponent | ||||||
| H | 0.504445 | |||||
| Source: Stata output | ||||||
Table 6. The results on the test of market efficiency during COVID-19 in Nigeria and South Africa.
The results on the above Table 6 show the outcome on the test of market efficiency for Nigeria and South Africa during COVID-19 from 2019 to August 2020. The coefficient of the memory parameter (d) is approximately 0.121 and 0.004 for Nigeria and South Africa respectively. While the Hurst exponent (H) is approximately 0.621 for Nigeria and 0.504 for South Africa [19]. In these two markets H is approximately above 0.5 which means that the two selected stock market return are inefficient during COVID-19 pandemic. This analysis is also conducted after the COVID-19 pandemic and the results are reported in Table 6.
| Return | Coef. | Std. Err. | z | P>|z| | 95% conf. interval | |
|---|---|---|---|---|---|---|
| Nigeria | ||||||
| Arfima | ||||||
| cons | 0.000618 | 0.000562 | 1.1 | 0.272 | -0.00048 | 0.00172 |
| ar (-1) | -0.96058 | 0.06072 | -15.82 | 0.000 | -1.07959 | -0.84157 |
| ma (-1) | 0.924714 | 0.084325 | 10.97 | 0.000 | 0.75944 | 1.089989 |
| d | 0.098582 | 0.042448 | 2.32 | 0.02 | 0.015386 | 0.181777 |
| Hurst exponent | ||||||
| H | 0.598582 | |||||
| South Africa | ||||||
| Arfima | ||||||
| cons | 0.000242 | 0.000253 | 0.95 | 0.34 | -0.00026 | 0.000738 |
| ar (-1) | -0.04025 | 0.352351 | -0.11 | 0.909 | -0.73085 | 0.650342 |
| ma (-1) | 0.300168 | 0.286629 | 1.05 | 0.295 | -0.26161 | 0.86195 |
| d | -0.19915 | 0.084342 | -2.36 | 0.018 | -0.36445 | -0.03384 |
| Hurst exponent | ||||||
| H | 0.300852 | |||||
| Source: Stata output | ||||||
Table 7. The results on the test of market efficiency after COVID-19 in Nigeria and South Africa.
In Table 7 the results on the analysis of market efficiency after COVID-19 is presented for both Nigerian stock market return and South Africa stock market return. The period of this test is between January 2021 to August 2022. The long memory parameter d for Nigerian stock market return is approximately 0.099 significant at 5 percent considering the probability value. And the Hurst value of 0.599 or 59 percent. This reveals that the Nigerian stock market return is inefficient after the heat of the COVID-19 pandemic. In the case of South Africa stock market return, the d memory parameter is -0.199 approximately and H is approximately 0.301.
This result shows that the South Africa stock market return is inefficient in the short range immediately after the heart of COVID-19.
Testing returns irreversible or predictable over market cycles
This is the last hypothesis of the study and it is conducted for stock market return of Nigeria and South Africa. For Nigeria four cycles were recognized and for South Africa the line graph shows that three distinct shapes were seen. Thus, the test is conducted in each of the cycles to see in which of the cycles that the market is predictable or irreversible. The next tables give the outcome of this test.
Table 8 below shows the result of the test of return irreversible or predictable over the cycle 30th of January 2012 to December 2014 in Nigeria. The d memory parameter is approximately 0.107, H is 0.61 or 61%. This is an indication that the market is reversible at this cycle and it can be predicted over a long range.
| Return | Coef. | Std. err. | z | P>|z| | 95% conf. interval | |
|---|---|---|---|---|---|---|
| ARFIMA | ||||||
| Cons | 0.001345 | 0.00062 | 2.17 | 0.03 | 0.000129 | 0.0025604 |
| Ar (-1) | -0.84349 | 0.116173 | -7.26 | 0 | -1.07118 | -0.615795 |
| Ma (-1) | 0.880947 | 0.100312 | 8.78 | 0 | 0.68434 | 1.077555 |
| d | 0.106862 | 0.035217 | 3.03 | 0.002 | 0.037839 | 0.1758848 |
| Hurst Exponent | ||||||
| H | 0.6068617 | |||||
| Source: Stata output | ||||||
Table 8. Test of return irreversible or predictable over the Cycle 30th of January 2012 to November 2014 in Nigeria.
The Table 9 below shows the outcome of the test of the third hypothesis which is based on return predictability. The results are for the second cycle identified which is from December 2014 to March 2018.
The memory parameter is approximately -0.029 and H is approximately 0.47. This shows that this phase or cycle of the market is predictable or reversible over a short range. The next table shows the results for the third cycle.
| Return | Coef. | Std. err. | z | P>|z| | 95% conf. interval | |
|---|---|---|---|---|---|---|
| ARFIMA | ||||||
| Cons | 0.0000612 | 0.000475 | 0.13 | 0.897 | -0.00087 | 0.000993 |
| Aar (-1) | 0.282696 | 0.100348 | 2.82 | 0.005 | 0.0860173 | 0.479375 |
| Ma (-1) | 0.168708 | 0.069707 | 2.42 | 0.016 | 0.0320859 | 0.305331 |
| d | -0.02905 | 0.052719 | -0.55 | 0.582 | -0.132376 | 0.074278 |
| Hurst exponent | ||||||
| H | 0.4709511 | |||||
| Source: Stata output | ||||||
Table 9. Test of return irreversible or predictable over the cycle December 2014 to March 2018 in Nigeria.
The test output of return irreversible or predictable over the cycle April 2018 to May 2020 in Nigeria is reported in Table 10 below. The d memory parameter has a coefficient value of 0.219 with probability value of approximately 0.002. And Hurst exponent of 0.719 approximately.
This test reveals that the market at this point is reversible and can be predicted over a long range. Thus, the probability value shows that this test is significant at 1%. The fourth phase of the market return identified is tested and the outcome presented in the subsequent table.
| Return | Coef. | Std. err. | z | P>|z| | 95% conf. interval | |
|---|---|---|---|---|---|---|
| ARFIMA | ||||||
| Cons | 0.000194 | 0.000953 | 0.2 | 0.839 | -0.001674 | 0.002062 |
| Ar (-1) | 0.810457 | 0.164528 | 4.93 | 0 | 0.4879884 | 1.132926 |
| Ma (-1) | -0.84666 | 0.130303 | -6.5 | 0 | -1.102047 | -0.59127 |
| d | 0.218603 | 0.070732 | 3.09 | 0.002 | 0.079971 | 0.357236 |
| Hurst exponent | ||||||
| H | 0.7186032 | |||||
| Source: Stata output | ||||||
Table 10. Test of return irreversible or predictable over the cycle April 2018 to May 2020 in Nigeria.
As shown in the below Table 11 the test result of return irreversible or predictable over the cycle June 2020 to August 2022 in Nigeria. In this market cycle the d memory parameter is insignificant giving the probability value of 0.19. The value of d is 0.123 and H value is 0.623. This suggests that the market for this cycle can be predicted over a long-time range. That is there is persistence in the market.
| Return | Coef. | Std. err. | z | P>|z| | 95% conf. interval | |
|---|---|---|---|---|---|---|
| ARFIMA | ||||||
| Cons | 0.00147 | 0.000743 | 1.98 | 0.048 | 0.0000146 | 0.0029261 |
| Ar (-1) | 0.416715 | 0.746658 | 0.56 | 0.577 | -1.046708 | 1.880137 |
| Ma (-1) | -0.37662 | 0.711781 | -0.53 | 0.597 | -1.771682 | 1.018447 |
| d | 0.123433 | 0.094737 | 1.3 | 0.193 | -0.0622492 | 0.3091143 |
| Hurst exponent | ||||||
| H | 0.6234326 | |||||
| Source: Stata output | ||||||
Table 11. Test of return irreversible or predictable over the cycle June 2020 to August 2022 in Nigeria.
Table 12 displays the result of the test of return irreversible or predictable over the cycle 30th of January 2012 to August 2014 in South Africa.
The value of d is approximately -0.164 and significant at 1% and H is approximately 0.336. This implies that this market cycle is reversible on a short range.
| Return | Coef. | Std. err. | z | P>|z| | 95% conf. interval | |
|---|---|---|---|---|---|---|
| ARFIMA | ||||||
| cons | 0.000737 | 0.000144 | 5.13 | 0 | 0.000456 | 0.001019 |
| ar(-1) | 0.107919 | 0.071505 | 1.51 | 0.131 | -0.03223 | 0.248066 |
| d | -0.16368 | 0.057603 | -2.84 | 0.004 | -0.27658 | -0.05078 |
| Hurst exponent | ||||||
| H | 0.3363219 | |||||
| Source: Stata output | ||||||
Table 12. Test of return irreversible or predictable over the cycle 30th of January 2012 to August 2014 in South Africa.
The test of return irreversible or predictable over the cycle September 2014 to March 2020 in South Africa is conducted and the result is reported in Table 13 below. It is seen that the coefficient value of d which is the memory parameter is roughly 0.027, the coefficient of His approximated to be 0.527. This result depict that the market is reversible that is this particular phase of the market is predictable over a long range.
| Return | Coef. | Std. err. | z | P>|z| | 95% conf. interval | |
|---|---|---|---|---|---|---|
| ARFIMA | ||||||
| Cons | -0.0000359 | 0.000347 | -0.1 | 0.918 | -0.00072 | 0.0006447 |
| Ar (-1) | -0.20294 | 0.189447 | -1.07 | 0.284 | -0.57425 | 0.1683712 |
| Ma (-1) | 0.097534 | 0.207856 | 0.47 | 0.639 | -0.30986 | 0.5049242 |
| d | 0.026572 | 0.038348 | 0.69 | 0.488 | -0.04859 | 0.1017323 |
| Hurst exponent | ||||||
| H | 0.526572 | |||||
| Source: Stata output | ||||||
Table 13. Test of return irreversible or predictable over the cycle September 2014 to March 2020 in South Africa.
Table 14 below shows the output of the test of return irreversible or predictable over the cycle April 2020 to August 2022 in South Africa. The coefficient of d is approximately -0.122 with associated probability value of 0.020. The coefficient of the Hurst exponent is 0.378. This connote that the market at this time is predictable over a short range.
| Return | Coef. | Std. err. | z | P>|z| | 95% conf. interval | |
|---|---|---|---|---|---|---|
| ARFIMA | ||||||
| Cons | 0.000655 | 0.000282 | 2.32 | 0.02 | 0.000102 | 0.0012069 |
| Ar (-1) | -0.31893 | 0.320843 | -0.99 | 0.32 | -0.94777 | 0.3099148 |
| Ma (-1) | 0.475275 | 0.277317 | 1.71 | 0.087 | -0.06826 | 1.018807 |
| d | -0.12163 | 0.052363 | -2.32 | 0.02 | -0.22426 | -0.019006 |
| Hurst exponent | ||||||
| H | 0.3783653 | |||||
| Source: Stata output | ||||||
Table 14. Test of return irreversible or predictable over the cycle April 2020 to August 2022 in South Africa.
This section of the study originates from the specific issues, which have been addressed empirically. It is rooted in the link between the major findings and the objectives proposed for the study. The scope of the section therefore covers the discussion of findings and the implication of findings.
This study provides fresh findings on the impact of long memory dependence in returns of selected stock market. (Nigeria and South Africa). The study is an extension of existing studies, in that it examines the impact of long memory dependence in return over different market phases, before, during and after the outbreak of COVID-19 pandemic for the two selected market. Three hypotheses were tested, the result of the first hypothesis shows that the Nigerian stock market return has long memory in return meaning that current return correlate with future return. This implies that investors can make abnormal return in this market. This finding is in line with the findings of Turkyilmaz and Balibey who investigated the long memory behaviour in the returns of Pakistan stock market and found that there is long memeory in stock market return. From the outcome of this study, it is seen that South Africa stock market return has short memory in return. This is against the findings of Jefferis and Thupayagale who adopted Auto Regressive Fractionally Integrated Moving Average (ARIMA-FIGARCH) model to investigate the return and volatility behavior of three southern African markets, which South Africa is part. Jefferis and Thupayagale found out that there is long memory in return in South Africa stock market.
In this study it was discovered that in all the market cycles there is evidence of predictability. The returns in each market cycles are reversible as such the markets have memory. This is in tandem with the study of Morris, Vuurent and Styger who used Wavelet and Markovb Switching Regime to examine the evidence of long memory in the South African stock market. They discovered that the market has memory making the market to be inefficient.
Based on the findings of this study the following conclusions are given which are listed in the order below.
• The study concluded that Nigeria stock market return has long
memory in return that is current returns are correlating with future
return. Similarly, in South Africa stock market current return
correlate with future return in a short range.
• Based on the test of market efficiency, it is concluded that
the Nigeria stock market return is inefficient in the long range
before, during and after COVID-19 pandemic. For South
Africa stock market, the market is inefficient in the short
range before and after the pandemic but the market exhibits
long range inefficiency during heat of COVID-19.
• From the test on return irreversible or predictable over the cycle
in all the market cycles identified in Nigeria stock market
and South Africa stock market, it is concluded that in all the
cycles the market can be predicted. That is there is herding
behavior of investors.
The following policy recommendations for investors, government and regulatory bodies of the Nigerian stock market and South Africa stock market to implement are made. Below is a list of them.
• The results from this study can be used by investors to create risk
and portfolio management methods because the fundamental
element of anticipating return is present. Instead of using
behavior patterns like herding, investors can make buy and sell
choices using fully built trading algorithms. By collaborating
with stock brokerage firms, the capital market authority should
take into account investor education and understanding of
the investment options available in order to increase
market participation and generate liquidity. Cross-listing
ought to be promoted since it promotes growth and increases
liquidity among linked or integrated markets.
• Lastly, the government should implement appropriate policies
to support the expansion of the financial market.
Suggestion for further studies
This study provides fresh findings on the impact of long memory dependence in returns of selected stock market. (Nigeria and South Africa). The study has contributed to existing studies, in that it examines the impact of long memory dependence in return over different market phases, before, during and after the outbreak of COVID-19 pandemic for the two selected market. However, only two stock market returns were used. Further studies can use more than two stock markets return and extend the duration of this study.
Business and Economics Journal received 6451 citations as per Google Scholar report


