Research - (2022) Volume 13, Issue 1
Received: 09-Jan-2022, Manuscript No. bej-22-51429;
Editor assigned: 11-Jan-2022, Pre QC No. P-51429;
Reviewed: 20-Jan-2022, QC No. Q-51429;
Revised: 23-Jan-2022, Manuscript No. R-22-51429;
Published:
30-Jan-2022
, DOI: 10.37421/2151-6219.2022.13.365
Citation: Negin Salehi, Farzaneh Bikzadeh Abbasi, Soheila Sardar. Impact Of Social CRM Capabilities on Firm Performance with Customer Engagement as Mediator (Case Study: Ofogh Kourosh Chain Stores). Bus Econ J 13(2022): 365.
Copyright: © 2022 Salehi N, et al. This is an open-access article distributed under the terms of the Creative Commons Attribution License, which permits unrestricted use, distribution, and reproduction in any medium, provided the original author and source are credited.
Social media usage has become pervasive and firms need to use it in their business to meet their goals and objectives. The purpose of this study is to examine how social media usage can help firms build new CRM capabilities and thus improve marketing strategies and business performance. In this study we investigate the impact of customer relationship management capabilities through interaction with customers in social networks on the performance of Ofogh Kourosh chain stores (a business firm group in Iran). The present study is descriptive in terms of method and applied in terms of purpose. The statistical community is Ofogh Kourosh stores and its customers who have interacted in social networks related to this company such as Instagram. Statistical data has been collected as based on the level of activity of the company and customers’ participation in the social network during 4 years from 2016 to 2020. We analyzed data from Ofogh Kourosh chain stores using Instagram as social media data and Tehran Stock Exchange and Securities Organization codal database for financial data during that period. we used Stochastic Frontier Analysis 4.1 and Stata14 for our descriptive and inferential statistics and analyzed our hypothesizes Highlights as the result of this analysis, it was confirmed that the social capabilities of customer relationship management have a positive effect on customer engagement and participation, as well as the performance of Ofogh Kourosh stores. We also concluded that customer engagement and participation has had a positive impact on the performance of Ofogh Kourosh stores in our research period.
Social media • Customer relationship management • Social CRM • Customer engagement • Performance
Customer relationship management is a strategy that is used to gain more awareness about the needs and behavior of customers to communicate more with them. Good customer relations are the key to success in organizational processes. Customer relationship management in an organization is a strategy to identify customers, keep them satisfied and turn them into regular customers. Customer relationship management also helps the organization to maximize the value of each customer. The task is to facilitate the customer's communication with the organization, without time, space and nationality restrictions, in a way that the customer feels in touch with a single organization, which knows him, values him and meets his needs with the fastest and easiest method of communication [1].
In any organization, both production and service, the most important factor for the Maintenance and survival of the organization are their customers, so that if the organizations succeed in gaining their satisfaction and loyalty, it has provided the ground for its long-term growth and survival. Customer satisfaction or dissatisfaction is effective in the interests of the all organizations and companies regardless of the profession and industry in which they operate; customer satisfaction is a key factor for success [2].
Social customer relationship management took a new form and changed from traditional form to electronic and modern form. Improvements in the field of electronics caused customer relationship management to enter various fields such as social networks, and lead organizations to a broader relationship in line with modern science. Organizations have been able to use this technology to expand their relationships with customers to their advantage and satisfy the relationship between employees and customers. The researchers defined social customer relationship management as integration of customer activities into emerging social media processes, systems, and technologies for customer engagement, collaboration, and customer relationship enhancement [3]. With the emergence and rapid development of social media networking in the last decade, the interest in social media marketing among researchers and marketing organizations has also grown rapidly around the world. As managers become more active in incorporating social media as part of their cohesive marketing communication tools, they have naturally turned their attention to issues related to the return on social media investment: Can the use of social media improve a company's performance?
Research framework
The social networks extended in the last decade, the interest and excitement of marketing in networks between researchers and Companies have grown rapidly. The managers have comforted in the integration of social networks as part of the marketing communications of the organization, and naturally, they have focused their attention on investment in social media. Social network activities can improve organizations [4]. The application of social media today is a comprehensive need and organizations must organize the use of this tool for their strategic goals. The companies have investigated this tool as an essential strategy for changing customer relationship management, which can facilitate new marketing and satisfaction capabilities. Social media integration in customer relationship management using a resource based view perspective and dynamic capabilities theory will show that the application of social media would enhance and intensify the effect of social capabilities of communication with customer relationships.
Perspectives based on resource based view (RBV) or resource advantage theory [5,6]. And dynamic capabilities theory Are the theoretical foundations of this research? Both perspectives state that the optimal performance of an organization is determined by capturing resources and their benefits in converting those resources into capabilities. The RBV focuses managerial attention on the firm's internal resources in an effort to identify those assets, capabilities and competencies with the potential to deliver superior competitive advantages. The common theme is that the firm's resources are financial, legal, human, organizational, informational and relational; resources are heterogeneous and imperfectly mobile and that management's key task is to understand and organize resources for sustainable competitive advantage [7]. RBV focuses attention on an organization’s internal resources as a means of organizing processes and obtaining a competitive advantage. Resource-based view theory states that competitive advantage can only be achieved through the development and use of unique valuable, indescribable, and irreplaceable resources [5]. Studies and researches that have tested resource-based view theory confirm reliable results [8].
Dynamic Capabilities Theory is the capability of an organization to purposefully adapt an organization's resource base. The term dynamic capabilities emphasizing that the ability to react adequately and timely to external changes requires a combination of multiple capabilities, states that business markets are dynamic and organizations rather than in The use of their resources should be heterogeneous and should reflect changes in the capabilities with which they acquire and use existing resources. The resourcebased view of the firm emphasizes sustainable competitive advantage; the dynamic capabilities view, on the other hand, focuses more on the issue of competitive survival in response to rapidly changing contemporary business conditions.
The New Dynamic Capabilities framework, posed by Amy Shuen in her analysis of Web 2.0, focuses on the firm's ability to quickly orchestrate and reconfigure externally sourced competences, ranging from Apple, Google Android, IBM Linux developer ecosystems to crowd sourced, crowd funded open innovations, while leveraging internal resources such as platforms, know-how, user communities and digital, social and mobile networks.
These distinctions show the variance of intra-organizational performance over time since we live in the age of information and communication technology and the pervasiveness of smart phones among the people, this space has provided the development of social networks in different communities. In the context of traditional customer relationship management, the organization has important and prominent customer information and uses this information to manage its customer relationship. The traditional definition of customer relationship management is still generally valid, but the rapid and pervasive spread of social media in both the consumer and business markets suggests that the traditional view of customer relationship management needs to be reconsidered [9,10].
Customers have started using social networks to communicate with other people and companies, and as a result, information production and interaction between users has begun. Customers have actively begun to create collaborative experiences with firms Change in customer behavior enables companies to apply technologies and capabilities [3]. The urgency of having a "social customer," or creative customer, who can generate large amounts of value-added content on a social network, has created a challenge for professionals and researchers to rethink what is called customer relationship management [11]. Therefore, the concept of customer relationship management has been expanded to include the capabilities of new technologies and social networks. Although social customer relationship management is a relatively new field in marketing, studies focusing on the boundaries between Customer relationship management and social networkbased customer relationship management have begun [12]. Considering the important role of social network in social customer relationship management, this research has provided the following definition for it: “a firm's competency in generating, integrating, and responding to information obtained from customer interactions that are facilitated by social media technologies” [3].
Social customer relationship management is not a substitute for traditional customer relationship management, but rather an extension and sequence that combines social functions, processes, and capabilities for communication and interaction. According to the mentioned contents, Ofogh Kourosh chain stores should use the social capabilities of customer relationship management to increase their competitiveness in producing, integrating and responding to the information obtained from customer interaction using social networking technologies. It has been facilitated to be used in a positive and increasing direction on the performance of these stores, and while using social media, social networking, which is known today as one of the most widely used and effective methods in the advertising industry, managing efficiency, effectiveness and financial costs. This research is done to examine the capabilities of social network, customer participation and engagement and the performance of Ofogh Kourosh stores and the development of these capabilities. Therefore, we will examine whether: The social capabilities of customer relationship management of Ofogh Kourosh chain stores have a positive effect on customer engagement and participation and the performance of this organization?
Conceptual model and theoretical concepts
Regarding the title of this research, we have three important keywords, CRM capabilities, customer engagement and performance; now we try to define a conceptual model to explain the relation between these keywords. To express how the use of social network technology can be useful in both customer relationship and financial performance, we propose a conceptual model that adapts strategies to the market and develops market improvement capabilities. This model first establishes the relationship between the social capabilities of customer relationship management and customer engagement, and then considers how the social capabilities of customer relationship management directly affect the organization's performance between social capabilities and organizational performance. Finally, it identifies how the customer engagement affects the organization's performance [13].
We consider this model and base our work on extracting and analyzing our data on the basis of this conceptual framework (Figure 1).

Figure 1. Conceptual Model.
The social capability of customer relationship management emphasizes an organization's ability to attract customers in engagement and interactive dialogue and develop customer relationship. Bilateral interaction-based technologies are not only able to enhance quality of interaction between partners, but can also increase the amount and quality of information provided to customers [14].
New literature shows that marketing capabilities, including the social capabilities of customer relationship management, lead to strong customer relationships that positively lead to customer satisfaction [3]. With a marketing technology perspective, this literature suggests that marketing technologies enable organizations to build more effective and productive customer relationships to gain more customer information and more effective responses to the demands [15,16]. The purpose of a brand social page is to encourage customers to react and interact with that company (interactions such as liking, commenting and sharing), so when companies and brands want to interact and create added value with customers, the level of customer engagement will increase because they receive more information and feel valued [13]. Organizations that acquire such capabilities are more effective in attracting and engaging customers and provide better customer service by applying these information capabilities. Along with resource-based view and dynamic capability theory, previous researches suggest that development outstanding capabilities can be the source of the organization's outstanding performance [17]. Marketing capabilities in both large organizations in industrialized countries and small organizations depend on the performance of the organization [18]. The social capabilities of customer relationship management increase the company's efficiency in customer relations and internal management. Therefore, organizations with more customer relationship management capabilities have better overall performance.
The Impact of Customer Engagement: Companies site customer engagement as the greatest advantage among other benefits of social networking. Increasing customer engagement in parallel has doubled by the development of the Internet and Web 2.0 digital technology tools, especially social networks such as wikis and blogs, sites such as Facebook and Tweeter, My Space, and LinkedIn. The conceptual need for customer participation to create opportunities from aspects and tools of Web 2.0 technology has focused on creating the relationship between vendors and customers [19,20].
Researchers consider the interactive ability of the social network along with its power to create dialogue between individuals and organizations in the community of sellers and customers and place customers among the producers of content and value in order to better serve and satisfy customers [13]. Now according to our conceptual model
We define the Main objectives and hypotheses as:
Hypothesis 1: Social Capabilities of Customer Relationship Management Ofogh Kourosh chain stores have a positive effect on customer engagement.
Hypothesis 2: Social Capabilities of customer relationship management has a positive effect on the performance of Ofogh Kourosh chain stores in business.
Hypothesis 3: The level of customer engagement has a positive effect on business performance of Ofogh Kourosh chain stores in business.
Method description
To better understand the research method, we will review the primary method of transforming the social capabilities of customer relationship management into a measurable quantity. Social capabilities of Customer relationship management are the development of understanding of the company's values by current and potential customer and customer relations. This growth is partly reflected in sales growth and a better understanding of the needs of target customers. Therefore, the measurement of social network capability and capability index is done with a statistical estimating model based on input-output which is an effective way to predict the efficiency of the company in a business context. Resource-based view defines an organization's capabilities as the ability to use resources (inputs) to achieve the desired goals (Outputs). Conceptual modeling based on the input-output of the organization's capabilities, the "stochastic frontier analysis method" is suitable for this estimate, because the stochastic frontier analysis method provides the appropriate econometric tools and techniques for practical and observational estimates of an organization's performance levels [21,22].
Stochastic frontier analysis method consists of two random components, one related to (inefficiency) of the organization and the other is a traditional random error that is not under the control of the organization.
This model can be expressed in the following form:
Yi = xi β + (Vi – Ui), i =1, ..., N, (Tim Coelli,1996) (1)
Where Yi is the production (or the logarithm of the production) of the i-th firm;
xi is a k x 1 vector of (transformations of the) input quantities of the i-th firm;
β is a vector of unknown parameters; the Vi are random variables which are assumed to be iid. N (0, σ V2), and independent of the Ui which are non-negative random variables which are assumed to account for technical inefficiency in production and are often assumed to be iid. | N (0, σ U2) |.
The computer program calculates predictions of individual firm technical efficiencies from estimated stochastic production frontiers,
EFFi = E (Yi*|Ui, Xi)/E (Yi*|Ui=0, Xi) (2)
Where Yi* is the production (or cost) of the i-th firm, which will be equal to Yi when the dependent variable is in original units and will be equal to exp(Yi) when the dependent variable is in logs. In the case of a production frontier, EFFi will take a value between zero and one. The relevant expressions for the production function cases are provided in Battese and Coelli [21].
This original specification has been used in a vast number of empirical applications the lower the inefficiency component, the higher the efficiency of the organization. Therefore, in previous researches, the inefficiency rate (inefficiency =100 – efficiency) was considered as an indicator for the efficiency of the company [23]. We also add social network resources to the list of input resources, including technology infrastructure, sales, general costs, administrative and management costs and like this. For example, #Tag, Post, #Video, #Image, etc., as input sources, to emphasize the social capabilities of customer relationship management in using the social network. Considering that in this research we have decided to study and compare the use of social network and its impact on the performance of the organization, we have collected the initial information according to what was indicated in the statistical community and data collection method section. It turns out that the organization has started and continued its activities in the social network. More posts and more hash tags indicate that the organization uses the social network more in interaction with customers. The social data resources are extracted also from their participation and interaction on the social page of the organization's Instagram.
In addition to conventional input resources, we have also considered social network resources as parts of the input string to emphasize the capabilities of the social network and examine its effect on the efficiency of the organization. Stochastic frontier analysis method estimates the efficiency of units (firms) by using Microeconomics and econometric theories. In other words, the SFA production function, which represents the geometric location of efficient firms (efficient production boundary), is estimated using econometric models, based on which firm inefficiencies are measured. Since this method estimates the production function (or cost), it is necessary to specify a specific type of production function (or cost) at the beginning. it is usually necessary in such analyzes to use the trans log function, which is the most flexible form of production function (or cost) or the (Cobb- Douglas) function. The Trans log state of Equation (1) according to the variables of this research is in the form of Equation (3):
Ln (SALES) = β0 + β1 Ln (SGAS)+ β2 Ln (SMR)+ β3 Ln (CENG) (Vi – Ui) (3)
In this equation:
SALES: The sum of total sales revenue and accounts receivables from sales, which is a dependent variable and the amount of its natural logarithm, is entered in the equation.
SGAS: Sum of Sales - General and Administrative expenses that are Independent variable and its logarithm are in the equation.
CENG: represents the amount of customer participation and engagement that is the mediator variable and enters the equation in logarithmic form.
SMR: The amount of use of social network that the independent variable and its logarithm is included in the equation.
Vi: Random component that is not controlled by the organization
Ui: Component related to the technical inefficiency of the organization that we need to estimate to calculate performance
β0: Fixed value of width from origin (intercept)
βi: Vector of weight of independent variables in the formation of dependent variable function.
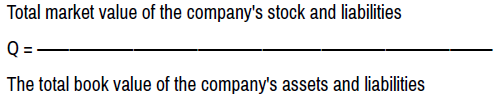
Using the frontier software and the collected data and the regression of the above equation estimates a prediction of the efficiency of the company, which in fact represents the social customer relationship management capability in the social network that is estimated in the years under study. So far we have been able to calculate the social capability variable of customer relationship management for the next part to test the research hypotheses. We also use the Q-Tobin ratio for calculation of the performance of the organization, as a dependent variable. We use the ratio (sum of the company's stock market value and debt amount) to (book value of the company's assets and debt amount) in the observed period for this purpose. It was said that we have collected the data as we need for this study.
Now with respect to performance attributed (Q Tobin):
 (4)
(4)
In this regard, we calculate the company's performance using the data collected for four years and record it in an Excel data file. Now that the data of the research variables have been completed, which include performance (Q) - social capabilities (SCRM) - Customer engagement (CENG) and social media usage (SMR), we construct the equations for the conceptual model and research hypotheses:
Ln (CENG) = β0 + β1 Ln (SCRM) (5)
Ln (Q) = β0 + β1 Ln (SCRM)+ β2 Ln (CENG) (6)
In Equations (5) and (6):
Ln (Q): The logarithm of firm performance that is a dependent variable
Ln (CENG): The logarithm of customer engagement level, which is the mediating variable
Ln (SCRM): The logarithm of the social capabilities of customer relationship management which is an independent variable
β0: Constant value of width from the origin (intercept),
β1 and β2: Vector weighted coefficients for the variables of the equation
Using Stata 14.0 program and performing single and multiple regression equations (5) and (6), we determine and calculate the parameters and analyze the hypotheses. The purpose of choosing a research method is for the researcher to determine what to adopt that will make him as accurate and easy as possible to potential answers. The research method depends on the goals and nature of the subject as well as the facilities and resources [24]. Descriptive research describes what it is and the existing conditions or relationships, common beliefs, current processes, tangible effects or expanding trends and examines often events, and effects of the past which are related to the existing conditions [25].
In descriptive research, the study population can be studied and tested through a survey. Survey is the collection of information that is used as a plan and as a practical guide of description with prediction or analysis that is done to the relationships of some variables to answer research questions and includes description and conclusion, Khaki, 2001.
According to the above, it can be said that in this study, because the description of social media capabilities is examined and to better understand these conditions and provide solutions for its impact on customer relationship management performance, this research is a descriptive-survey research. Also, since this research has been done in a dynamic organization and its results can be used practically to solve executive problems; it is also an applied research. In this research, a survey has been conducted to investigate the distribution by studying the documents of libraries and Internet sites. All the means and stages of systematic collection of information and the way of their logical analysis to achieve a certain goal is called the scientific method of research. In general, the goal is to discover the facts, and therefore in all humanities, its general principles are the same, and depending on which category of the desired truth belongs, its own methods, which do not contradict the scientific principles and methods of research, the detail is determined and the criterion of action is used [26]. In the data analysis section, in addition to descriptive indicators such as frequency distribution tables, dispersion indices, mean, and variance, the calculation and analysis of inferential data indices is done by modeling equations using frontier 4.1 and Stata 14.0 software.
According to the purpose of research, scientific research is divided to into three basic categories, applied, Functional and developmental. The present study is an applied research according to the purpose of the research. The purpose of applied research is to find a solution to solve administrative problems [26].
Measures and data description
In the present study, a combined method is used. In the library studies section, written sources such as books, articles, dissertations and the Internet are used. Our tool in this research is data collection tool. In this research, we collected information through observations and collecting the observed data from the social network and the interaction between the organization and customers, as well as financial information which are extracted from the financial statements of the stock exchange and financial reports of the organization. Both the issue of reliability and validity are the principles of measuring and evaluating scientific research. Due to this importance, in the present study, an attempt has been made to consider the above issues in order to be useful and effective methods of data collection. Validity means that the scale and content of the data tool contained in the tool, exactly tailored to the subject matter that assess the study. This means that the results of using a tool are not more or less than the needs of the researcher. The validity of a measuring instrument means that the instruments actually measure what they are made for. Since the reliability of a scale is a prerequisite for its scientific validity, it is clear that it will be invalid in areas where a measurement scale is not reliable. But a reliable scale does not necessarily have scientific value because it is likely to measure something that the researcher does not want Khaki, 2007.
Due to the homogenous structure of the data collection tool, the tool has reliability. Also, according to the definition of the validity of a tool, which is a tool for accurate measurement of the intended purpose, the data collection method from the official Instagram site is valid and has the necessary validity.
Definitions of variables (conceptually and operationally)
Social capability of customer relationship management (SCRM): Capabilities Features and advantages that the use of social media network brings to the organization. Applying new technologies and capabilities to interact with customers the amount of social network application means the number of posts that the organization has issued in a year in the social network under study and includes # tag, # image, and #video as the input data for stochastic frontier analysis method that is used to measure this variable
Customer engagement (CENG): Integrating the activities that the customer faces, including trends, systems and technologies with social networking applications for Engaging customers in two-way interactive processes and collaborating to improve and enhance the customer relationship Trainor [3]. Interactions such as post, like, comments, sharing different hash tags by customers in the official social network of the organization are examples of customer engagement and customer engagement data.
Performance (Q): The performance of a company or organization in the business environment and it is how efficient and productive the firm is managed. For the performance of the organization we use the Q-Tobin ratio as a dependent variable that is the ratio (sum of the market value of the company's shares and the amount of debt) to the book value of the organization's assets and liabilities in the period under review.
Statistical community, the sampling method
The statistical community in this study is "Ofogh Kourosh chain stores and all customers of this company who interact with this company in the Instagram network". The period under study is (from 2016 to 2020) 4 years. Input data statistics of the research variables defined in relation to the interaction of this organization with customers from the Instagram site of Ofogh Kourosh Company. In this study, the data corresponding to the variables related to the social network, including the number of posts issued on the Instagram page by the company, the number of hash tags issued in the posts, and the number of likes posted by customers in following The posts and the number of comments shared with the pages of the posts in one-year periods are completely measured and recorded in the excel file related to the data in the relevant record. The mentioned data is the data of the company's activity and customer interaction. In our survey the questionnaire was not used and the data were completely collected for the variables, therefore, it is obvious that the data are homogeneous with the whole statistical community and have their general characteristics and random sampling of data is not used, and according to the data collection method, it has the necessary validity for research tests. Financial data related to financial variables have also been extracted from the reports of Ofogh Kourosh Company, which are officially issued and audited in the reviewed periods in the Codal system of Tehran Stock Exchange and securities.
Data statistics
As mentioned, the data related to the research social network has been collected from the official Instagram site of Ofogh Kourosh chain stores called okcs.ir with more than 235,000 followers. The financial data has also been collected from the Codal system of the Tehran Stock Exchange Organization in an excel file. According to equation (3), (5) and (6), because the logarithm of values is used in the equations, so the values of the data are converted into a logarithm. After calculation in Stata 14.0, Descriptive statistics of data presented (Figures 2-6) [27].

Figure 2. Graph of descriptive statistics of Q.

Figure 3. Graph of descriptive statistics of SMR.

Figure 4. Graph of descriptive statistics of CENG.

Figure 5. Graph of descriptive statistics of SALES.

Figure 6. Descriptive statistics of costs (SGAS).
In Graph (1) to (5) we indicated the changes in the performance, social CRM capabilities, level of using social media interactions with customers, total revenue of the stores and the changes in company expenses in the four years under review. Table 1 lists the variables and their statistical summaries calculated in Stata 14.0. In this table and the following tables SCRM social capability variable - SMR social network activity
| Variables | Obs. Years | Mean | Std. Dev. | Min | Max |
|---|---|---|---|---|---|
| Q | 4 | 0.0832 | 0.308167 | -0.294 | 0.371 |
| SCRM | 4 | 4.508 | 0.093854 | 4.379 | 4.604 |
| SMR | 4 | 6.18 | 0.502792 | 5.78 | 6.86 |
| CENG | 4 | 10.7 | 1.543373 | 9.17 | 12.23 |
| SALES | 4 | 17.495 | 0.741058 | 16.63 | 18.35 |
| SGAS | 4 | 15.475 | 0.8684661 | 14.36 | 16.4 |
Variable - CENG customer participation and engagement variable - SALES total sales variable (operating income) - SGAS variable total sales and general and administrative costs and Q variable performance. It is worth mentioning that the data is used in the form of natural logarithm of values and of course the values of the table of statistical summaries are also calculated as logarithm (Tables 1-6).
| Percentiles | Smallest | |||
| 1% | 0.294- | 0.294- | ||
| 5% | 0.294- | 0.039- | ||
| 10% | 0.294- | 0.295 | Obs. years | 4 |
| 25% | 0.1666- | 0.371 | Sum of weights | 4 |
| 50% | 0.128 | Mean | 0.08325 | |
| Largest | Std. Dev. | 0.308167 | ||
| 75% | 0.333 | 0.294- | ||
| 90% | 0.271 | 0.039- | Variance | 0.094967 |
| 95% | 0.271 | 0.295 | Skewness | 0.2919224- |
| 99% | 0.271 | 0.371 | Kurtosis | 1.446077- |
| Percentiles | Smallest | |||
| 1% | 5.78 | 5.78 | ||
| 5% | 5.78 | 5.82 | ||
| 10% | 5.78 | 6.26 | Obs. years | 4 |
| 25% | 5.8 | 6.86 | Sum of weights | 4 |
| 50% | 6.04 | Mean | 6.18 | |
| Largest | Std. Dev. | 0.502792 | ||
| 75% | 6.56 | 5.78 | ||
| 90% | 6.86 | 5.82 | Variance | 0.2528 |
| 95% | 6.86 | 6.26 | Skewness | 0.618622 |
| 99% | 6.86 | 6.86 | Kurtosis | 1.782086 |
| Percentiles | Smallest | |||
| 1% | 9.17 | 9.17 | ||
| 5% | 9.17 | 9.59 | ||
| 10% | 9.17 | 11.81 | Obs. years | 4 |
| 25% | 9.38 | 12.23 | Sum of weights | 4 |
| 50% | 10.7 | Mean | 10.7 | |
| Largest | Std. Dev. | 1.543373 | ||
| 75% | 12.02 | 9.17 | ||
| 90% | 12.23 | 9.59 | Variance | 2.382 |
| 95% | 12.23 | 11.81 | Skewness | e-07 1.66- |
| 99% | 12.23 | 12.23 | Kurtosis | 1.096303 |
| Percentiles | Smallest | |||
| 1% | 16.63 | 16.63 | ||
| 5% | 16.63 | 17.21 | ||
| 10% | 16.63 | 17.79 | Obs. years | 4 |
| 25% | 16.92 | 18.35 | Sum of weights | 4 |
| 50% | 17.5 | Mean | 17.495 | |
| Largest | Std. dev. | 0.741059 | ||
| 75% | 18.07 | 16.63 | ||
| 90% | 18.35 | 17.21 | Variance | 0.549168 |
| 95% | 18.35 | 17.79 | Skewness | 0.0185992- |
| 99% | 18.35 | 18.35 | Kurtosis | 1.633461 |
| Percentiles | Smallest | |||
| 1% | 14.36 | 14.36 | ||
| 5% | 14.36 | 15.3 | ||
| 10% | 14.36 | 15.84 | Obs. years | 4 |
| 25% | 14.83 | 16.4 | Sum of weights | 4 |
| 50% | 15.57 | Mean | 15.475 | |
| Largest | Std. dev. | 0.868466 | ||
| 75% | 16.12 | 14.36 | ||
| 90% | 16.4 | 15.3 | Variance | 0.754233 |
| 95% | 16.4 | 15.84 | Skewness | 00.3240534- |
| 99% | 16.4 | 16.4 | Kurtosis | 1.794121 |
Research data resources
• “Tehran Stock Exchange and Securities Organization” codal database for financial data
• Instagram official site of Ofogh Kourosh “Okcs.ir” for social media data resource
In Tables 1-6 Descriptive statistics of all variables used in the analysis based on data collected during the years 2016 to 2020 using data execution in Stata 14.0 software has been calculated and presented. According to the quantities of statistical distribution of variables and the value of skewness, which is related to the degree of asymmetry of the distribution curve with respect to the normal distribution function, in case of all variables it is a number between -1 and 1 and the value of kurtosis, which is related to sequence traction of the curve lateral sides, for all variables, it is a number between -2 and 2. So, the distribution could be considered normal distribution and therefore according to the above tables the distribution of all variables is normal. Mean, standard deviation and variance values are also indicated in the table related to statistical quantities of variables. In graph 6 the estimated values of SCRM from frontier is indicated in 4 years of survey.
Estimating the social capabilities of SCRM
As mentioned in the theoretical foundations, to estimate the social capabilities of customer relationship management, we defined the equation (3) between the input and output sources of the company. By implementing Input data file and executing stochastic frontier analysis function in frontier 4.1 software, output results are listed in Table 7, which we will discuss: In order to accurately use the appropriate model in calculating efficiency, we have used the Likelihood Ratio (LR) Test. This method is preferred because it provides an asymmetrically efficient estimate of the unknown parameters of the model. It also allows efficient observations to make a larger contribution to the shape of the production boundary. The statistics of this test are obtained through the following ratio:
| Coefficient | Std. Err | T-Ratio | Variables | |
|---|---|---|---|---|
| β0 | 3.231 | 0.981 | 3.291 | - |
| β1 | 0.904 | 0.072 | 12.522 | SGAS |
| β2 | 0.147 | 0.099 | 1.475 | SMR |
| β3 | 0.052- | 0.052 | 1.007- | CENG |
| σ2 | 0.025 | 0.036 | 0.677 | - |
| ϒ | 0.999 | 0.001 | 56.235 | - |
| LR | 3.982 | - | - | - |
LR = -2{Ln[L(H0)/L(H1)]} = -2{Ln[L(H0)] – Ln[L(H1)]}, H1 =ϒ ≠ 0, H0 = ϒ =0 (7)
Where L (H0) and L (H1) are the values of the probability function under the hypothesis zero (H0) and the opposite hypothesis (H1), respectively. This statistic has an asymptotic Chi-Square distribution under Hypothesis Zero. Parameter ϒ is always between zero and one. The closer the value of ϒ is to zero, the larger the random component from the efficient frontier dealer. Conversely, the closer the estimate is to one, the larger the technical inefficiency component of the total deviation from efficient boundary. As can be seen in the output results, the coefficient of dependence on the CENG variable is β1 = 0.904 and is positive, which indicates the positive and relatively strong effective relationship of this variable in total sales. The coefficient of dependence on the SMR variable, the amount of organization using the social network is also positive and equal to β2 = 0.147, and indicates the effectiveness of using the social network in increasing sales of Ofogh Kourosh chain stores. But we see that the coefficient of variable CENG means engagement and participation is Negative β3 = - 0.052 and therefore we cannot say that the mediating variable has played an increasing role in sales of the of Ofogh Kourosh stores. To check the significance and validity of using the frontier analysis function for efficiency estimation:
As shown in the output table of the function ϒ = 0.99 And according to the LR Test and its statistical value which is equal to LR = 3.981 with a degree of freedom d = 1, and therefore according to the table of critical values of the Chi-Square distribution with a significance of p <0.05 and within 95% of confidence, the hypothesis (H0) is rejected and the use of Stochastic Frntier Analysis function to estimate the efficiency of the company is approved. Performance estimation values for the years under study are also included in the output file of Stochastic Frontier Analysis function. These outputs indicate the efficiency of sales (revenue) by using the resources resulting from the effect of the organization's activities in the social network (the amount of social network usage and the level of participation and engagement of customers) with the production function. We register these efficiencies of Ofogh Kourosh to continue our study (Figure 7) (Tables 8 and 9).

Figure 7. Graph of SCRM variable according the frontier output file.
| Percentiles | Smallest | |||
| 1% | 4.379 | 4.379 | ||
| 5% | 4.379 | 4.521 | ||
| 10% | 4.379 | 4.528 | Obs. years | 4 |
| 25% | 4.45 | 4.604 | Sum of weights | 4 |
| 50% | 4.5245 | Mean | 4.508 | |
| Largest | Std. Dev. | 0.093854 | ||
| 45% | 4.566 | 4.379 | ||
| 90% | 4.604 | 4.521 | Variance | 0.008809 |
| 95% | 4.604 | 4.528 | Skewness | 0.5827736- |
| 99% | 4.604 | 4.604 | Kurtosis | 2.073771 |
| Variables | Q | Scrm | Ceng | Smr | Sales | Sgas |
|---|---|---|---|---|---|---|
| Q | 1 | - | - | - | - | - |
| SCRM | 0.8828 | 1 | - | - | - | - |
| CENG | 0.9505 | 0.6941 | 1 | - | - | - |
| SMR | 0.3905 | 0.1941 | 0.5 | 1 | - | - |
| SALES | 0.6994 | 0.2823 | 0.8836 | 0.4652 | 1 | - |
| SGAS | 0.6268 | 0.1936 | 0.8271 | 0.3652 | 0.9908 | 1 |
Correlation test
Now we examine the correlation test of variables using Stata software and calculating and performing the correlation matrix shown in Table 9. As can be seen in Table 9, the correlation between the variable mediator (CENG) and the independent variable (SCRM) is 0.6941, which is a positive value in the range of zero to one and indicates a relatively strong correlation between the social capabilities of customer relationship management and customer engagement.
Also, according to the table above, the correlation between the dependent variable (Q) and the independent variable (SCRM) is 0.8828, which again indicates a positive value and a strong correlation between these two variables. Therefore, it could be said that between organizational performance and social customer relationship management capabilities there is also a positive correlation. According to the table, the correlation between dependent variable (Q) and mediator variable (CENG) is 0.9505, which is in the range of zero and positive one. In addition, there is a positive correlation between the variable of social network usage (SMR) and the variable of social capabilities of customer relationship management (SCRM) with a positive value of 0.3905 and an acceptable correlation between the variable of social network usage (SMR) and mediator (CENG) with a positive value of 0.50. In the next section, we test the hypotheses to check the consistency of the results of the correlation matrix with the results of the hypothesis test and predictions.
Testing the hypotheses
Hypothesis 1: In this section, we first examine Hypothesis 1, the relationship between the mediating variable of customer engagement with the independent variable of social capabilities of customer relationship management.
Social capabilities of customer relationship management have a positive effect on Customer participation and engagement of Ofogh Kourosh chain stores now, by performing regression on Equation 5, the results of Table 10 are obtained:
| Obs. Years | 4 | |||||
| F(1.2) | 41.5 | |||||
| Prob >F | 0.0233 | |||||
| R-Squared | 0.4818 | |||||
| Root-MSE | 1.3608 | |||||
| SCRM | Coef. | Std. Err | t | p>t | Conf. 95% | Interval |
| β1 | 11.41377 | 1.77179 | 6.44 | 0.023 | 3.790374 | 19.03716 |
| β0 | -40.75327 | 7.34437 | -5.55 | 0.031 | -72.36674 | -9.139802 |
Linear regression
Reg CENG SCRM, r
As we can see in the Table 10, the coefficient of β 1 is 11.41, which is a positive value and indicates the significant impact of customer engagement and participation on the social capabilities of customer relationship management and the value of p=0.023 <0.05 significance (within 95% confidence), Ensuring this positive relationship between the mediating variable and the independent variable the social capabilities of customer relationship management. Therefore, the hypothesis H0 is rejected and the hypothesis H1 is accepted and our first hypothesis is confirmed.
Hypothesis 2 and Hypothesis 3: According to hypothesis 2 of the present study
Hypothesis 2: The social capabilities of customer relationship management have a positive effect on the performance of Ofogh Kourosh chain stores. Now we examine the relationship between the dependent variable of organization performance and the independent variable of social capabilities of customer relationship management of Ofogh Kourosh and Hypothesis 3, the relationship between the mediating variable of customer engagement with the dependent variable of Ofogh Kourosh performance. As we indicated before, we considered the equation 6 for these relationships.
By performing regression on Equation 6, the results of Table 11 are obtained: To test Hypothesis 2, as we see in the table, a coefficient of β1 equal to 1.413 was obtained, which is a positive value and indicates the effectiveness of the performance of Ofogh Kourosh from the social capabilities of customer relationship management of this organization. The value of p =0.045 <0.05 significance(within 95% confidence) assures a positive relationship between organizational performance and the variable of social capabilities of customer relationship management. Therefore, the hypothesis H0 is rejected and the hypothesis H1 is accepted (Tables 11 and 12).
| Obs. years | 4 | |||||
| F(2.1) | 11.0856 | |||||
| Prob >F | 0.0212 | |||||
| R-Squared | 0.9995 | |||||
| Root-MSE | 0.01205 | |||||
| Q | Coef. | Std. Err | t | P >t | Conf. 95% | Interval |
| β1 | 1.413 | 0.099438 | 11.21 | 0.045 | 0.14952 | 2.676481 |
| β2 | 0.1301541 | 0.006124 | 21.25 | 0.03 | 0.05234 | 0.207968 |
| β0 | -7.679204 | 0.402101 | -19.10 | 0.033 | -12.78839 | -2.570023 |
| Critical values of the chi-square distribution with d degrees of freedom | |||||||
|---|---|---|---|---|---|---|---|
| Probability of exceeding the critical value | |||||||
| d | 0.05 | 0.01 | 0.001 | d | 0.05 | 0.01 | 0.001 |
| 1 | 3.847 | 6.635 | 10.828 | 11 | 19.675 | 24.725 | 31.264 |
| 2 | 5.991 | 9.21 | 13.816 | 12 | 21.026 | 26.217 | 32.91 |
| 3 | 7.815 | 11.345 | 16.266 | 13 | 22.362 | 27.688 | 34.528 |
| 4 | 9.488 | 13.277 | 18.467 | 14 | 23.685 | 29.141 | 36.123 |
| 5 | 11.07 | 15.086 | 20.515 | 15 | 24.996 | 30.578 | 37.697 |
| 6 | 12.592 | 16.812 | 22.458 | 16 | 26.296 | 32.000 | 39.252 |
| 7 | 14.067 | 18.475 | 24.355 | 17 | 27.587 | 33.409 | 40.79 |
| 8 | 15.507 | 20.09 | 26.125 | 18 | 28.869 | 34.805 | 42.312 |
| 9 | 16.919 | 21.666 | 27.877 | 19 | 30.144 | 36.191 | 43.82 |
| 10 | 18.307 | 23.209 | 29.588 | 20 | 31.41 | 37.566 | 45.315 |
Linear multi regression
Reg Q SCRM CENG, r
Regarding the third hypothesis of this research:
Hypothesis 3: The level of the customer engagement and has a positive effect on the business performance of Ofogh Kourosh chain stores. Now we consider: According to Table 11, we see that the coefficient β 2, which expresses the relationship between organizational performance and customer engagement and participation, is equal to 0.13 a positive value and indicates the effectiveness of the performance of Ofogh Kourosh from the social capabilities of customer relationship management of this organization but not too strong with the value p = 0.03 <0.05 significance (within 95% confidence) H0 hypothesis is rejected and H1 hypothesis is accepted. Of course, due to the weight coefficient of this variable, this positive effect is relatively less, but Hypothesis 3 is confirmed.
In the first parts, while raising the issue, we realized that the use of social media has become a pervasive necessity today and organizations should organize the use of this tool for their strategic goals. Communication managers know the new capabilities of customer relationship management using social media and thus improve marketing strategies and their business performance. Then we described perspectives of resource based view and dynamic capabilities theory as the theoretical basis of this research. Both perspectives stated that the optimal performance of the organization is determined by the use of resources and their benefits in converting these resources into capabilities in the dynamic circumstances of today business environment. In the final section of this research, while presenting descriptive statistics related to research variables and a brief discussion about them. Expressive and analytical inferential statistics and equations and the results of these equations were used to evaluate the hypotheses were presented at the analysis part of this research. Then, we will express the findings and results of this study and make our suggestions in relation to the findings. Finally, we describe the limitations and problems that exist in performing and doing such this research or other similar researches.
Research results
According to the confirmation of the hypothesis 1: It can be seen that the more the activity of Ofogh Kourosh chain stores in the social network, it will bring `the more participation and engagement and companionship of customers, which may not have been possible in the past with huge advertising expenses, which attracted this amount of social customers.
Considering the second hypothesis
We find that increasing the social capabilities of customer relationship management will have an effective share in firm revenue and, of course, increases the market value of the company, and in this way will improve performance.
According to the confirmation of the third hypothesis
We conclude that attracted customers can be used as an effective factor in increasing revenue and sales. The results show the critical role that social capabilities of customer relationship management play when companies use social media in their marketing strategies. These social capabilities can improve company performance and customer engagement. These findings will greatly contribute to the customer relationship management literature and strengthen management perspectives on the effectiveness of social media technology in management strategies. Given the pervasiveness of social media networks and web tools, it should be noted that stores are gradually moving towards virtual and online stores, and this increases the need to use the capabilities of social networking. In this research, we presented a research method that can be used as an accurate model for conducting research in businesses and industries that use various social media networks such as Facebook, Telegram, Instagram, Twitter, etc. in interaction with customers. We measured the social capabilities of customer relationship management and examined its impact on customer participation and engagement and organization performance. This research provides an accurate but simple method for measuring the use of social media networks capabilities.
Research suggestions
In line with the findings of previous studies Trainor [3], the results of this study confirm the existence of social CRM capabilities, which is a sign and the creation of a new form of customer relationship management capabilities in social media. In addition, the results of the present study confirm the role of social capabilities of customer relationship management as a leading factor in business performance. Considering the three hypotheses of this research, Ofogh Kourosh Company should not only consider investing in social media as a cost, but also as an important resource along with other resources in creating new type of customer relationship management capabilities for organizational transformation and firm value change, creation of brand value and opportunity. To develop and improve the social capabilities of customer relationship management, the company must use social networking activities at the appropriate level to maximize the benefits. In this study, we examined that process of work in a theoretical and practical way that the results of use and activity in social networks attract customers' attention and the innovative and fast response of the company in this new business environment to the customers. In such cases, companies that are more involved in social networking will benefit more from customer interaction. Considering the performance variable, Q-Tobin, the results of our study shows that companies which use social CRM capabilities at a higher level are more likely to improve their performance. We suggest that the company spend advertising costs more on investment in infrastructure development. because it will get more output from this field, both in terms of better communication with customers and financially.
According to the research results, we suggest to researchers:
• In the future, adjust advertising and marketing strategies using social media networks. The costs that were spent on advertising in the past could be used in development of media and social networks.
• Business marketing professionals focus on strategies that emphasize the structure of customer relationship management based on social networks. These strategies lead to more interaction between more customers and the organization.
• Companies that consider social networking technology should focus on integrating this technology with their existing management systems to support the social capabilities of their organization. More activity will lead to a better understanding for marketing and financial managers to consider budgets spent on social media as an investment rather than an expense.
• Researchers conduct this research on a wider community of companies with larger and smaller dimensions in the categories of different branches of business and industry so that we can make assumptions in a wider area. Examine business over a wider time frame so that companies can take full advantage of it. Of course, there are problems and limitations to this large-scale study that we will address in the next section.
• It is necessary for commercial companies in various industries and businesses that are active in the social network to archive their social network information by installing software and put it in databases. Non-stock exchange traders should also place their information and financial statements in databases such as the archives of the Codal system to provide the required data based on different categories of industries and businesses at a reasonable time for similar research. This cooperation of companies in providing databases with supervisory institutions and organizations will facilitate future researches and the results of the research will bring benefits to the companies themselves.
In this study, we presented a research method that can be considered as an accurate model for conducting research in businesses and industries that use various social media networks such as Facebook, Telegram, Instagram, Twitter, etc. in interaction with customers, and researchers can use it to measure the social capabilities of customer relationship management and examine its impact on customer participation and involvement and the performance of the organization. This research provides a simple method for measuring the use of social media networks. In the future, more research is needed to provide a more complete and complex dimension to the evaluation of companies that use social media as a tool in their marketing.
Limitations of research
Here we describe the problems and limitations, which are summarized as follows:
• The history of using social media in businesses in Iran reaches about the last five years. Compared to the countries like the United States, this history reaches more than twenty-five years that many stores and businesses use social networks such as Facebook to interact with customers. So we have to admit that the time frame for research and similar researches is relatively short.
• Gathering the information required for such researches in Iran is not classified and straightforward, i.e., it is not yet possible to obtain data from corporate social networks in the form of regular and accessible archives, which are required to be part of the data required for such studies. Also, access to companies' financial information is not easily accessible if they are not on the public stock exchange, and it has its difficulties, such as verification, validity and reliability and such issues.
• The present study was conducted only on a company with the interactive social network Instagram, and in the future, different social networks in the field of communication between customers and organizations should be examined.
• Finally, we should mention that the business environment in recent years in Iran is affected by factors that have caused numerous fluctuations in corporate business. Factors such as the intensification of sanctions, sharp currency fluctuations and changes in the value of the national currency of foreign trade, effects of Politics on economics and similar factors that have naturally influences the process and results of such researches because the research input data would be affected by such factors.
As the author I thank Farzaneh Beikzadeh PhD as my supervisor and Soheila Sardar PhD as consulting for reviews and academic guidance, which has allowed me to improve my research.
This research did not receive any specific grant from funding agencies in the public, commercial, or not-for-profit sectors.
There is no conflict of interest as financial, personal, contractual or professional with public or private commercial agencies or individuals.
Business and Economics Journal received 6451 citations as per Google Scholar report


