Review Article - (2023) Volume 14, Issue 4
Received: 13-Jan-2023, Manuscript No. BEJ-23-87118;
Editor assigned: 16-Jan-2023, Pre QC No. BEJ-23-87118 (PQ);
Reviewed: 31-Jan-2023, QC No. BEJ-23-87118;
Revised: 13-Apr-2023, Manuscript No. BEJ-23-87118 (R);
Published:
20-Apr-2023
, DOI: 10.37421/2151-6219.2023.14.443
Citation: Arewa, Ajibola, James Ayodele
Owoputi, Scholastica Chimdiya Osuji and Emmanuel Chukwuemeka,
Ejianya, et al. "Herding Behavior and Investors' Irrationality in the
Nigerian Equity Market." Bus Econ J 14 (2023): 443.
Copyright: © 2023 Arewa A, et al. This is an open-access article distributed under the terms of the creative commons attribution license which permits unrestricted
use, distribution and reproduction in any medium, provided the original author and source are credited.
In this study quantitative research design was utilized to test the herding behavior of investors in Nigerian equity market. A random technique was adopted to select the companies with sufficient observations that cover the scope of the study. In this study, stock price information from five companies is used. The data used in this analysis were gathered from www.investing.com over an 8 years period, from 2015 to 2022. The cross-sectional absolute standard deviation was determined using the data collected. It is concluded that there is market wide herding behavior of investors and when the market is up there is presence of significant herding behavior of investors. However, there is no significant herding behavior of investors when the market is down. When there is herding in the market, this suggests that the market is inefficient and as such it is recommended that there should be restriction on short sales in order to raised or increase market efficiency. Also, the efficiency of the market will likewise increase when the cost of information declines.
Investigate • Fractionally integrated • Algorithms • Climatic situation • Rescale regression
Over the years, connoisseurs have repeatedly explained that herd behaviour is the driving force behind market rallies and enormous sell-off. In view of the herd instinct the dot-com bubbles that happens in the late-1990’s is a good illustration of herding behaviour, since it was the main factor that was behind the excessive sell-off and run-up. This excessive sell-off and run-up is because investors are always particular about positive returns. Loss aversion suggests that investors dislike negative returns yet more than losing out on prospects for favorable returns, particularly when these losses might have been prevented [1]. Delong and Magin explain that both the run-up and the sell-off are typically attributed to individual investors putting aside their particular opinions and following the assessments of the crowd. When trying to explain the massive market crash using only traditional economic theory, many were uncertain due to the unprecedented level of coordinated and systematic purchasing and selling of assets. However, Roider and Voskort believed that herding could be as a result of investors relying on information obtained from a reputable investor or from a financing house on a particular asset [2].
Investors should be aware of the negative consequences of financial market herding. Herding increases market risk and, as a result, may make these markets less suitable for a variety of investors with low risk tolerance to participate. Price volatility brought on by herding may deter both individual and institutional investment in the financial markets as investors may seek for more secure, less turbulent areas to place their money. Financial market capital outflows have a significant impact on business values, economic development and finance. This issue has made so many researchers both in time pass and recently to focused on studying herding in financial markets. These authors include Nicholson; Basu, Christie and Huang, Chang, et al.; Ouarda, Bouri and Bernard, Sharma, et al.; Lam and Qiao, Gavriilidis, et al.; Arisanti and Oktavendi, Gabbori, Dina and Espinosa, Christian and Arias [3].
Ashish and Kiran documented that there were no herding in the Indian stock market during the period of 2000 to 2012. These authors believed that the absence of herding during this period was because of reforms in the Indian stock market, which raise the number of rational investors and institutional players. This enhances rational pricing model bid or application in this market. Similarly, Yousaf, et al. posited that in the Pakistani stock market, there is no indication of herd behavior in the period of low and high volatility and at the time when the market was up and when it was down. Again, it was revealed from their study that there was no evidence of herding in Pakistani stock market during the global financial crisis of 2008 [4].
However, in the study of Auwal and Sanusi it was revealed that there is evidence of herd behaviors’ of investors in the insurance sector of the Nigerian financial system. Also, Gabbori argued that there is presence of significant herding in Saudi stock market. His findings indicate that in all GCC equity markets there is a pronounced herd behavior. In the study of Lam and Qiao it was seen that herding is present in the up market and in both low and high trading volume. They authors also claimed that size in up market affect herding in their first sub-period samples. Ouarda, Bouri and Bernard found out that there is existence of herding behavior in the European market and this trigger the bearish situation which is brought by a the volume of trades and strong volatility. Other authors who found that there is evidence of herding in the financial market includes Holmes, et al. Teng and Liu, Fenton and Kotzin, Dang and Lin's and Bui, Nguyen and Nguyen [5].
The result of empirical studies of herding behavior of investors in Nigeria equity market are scare and empirical stance of herding in other part of the world stock market are inconclusive. In order to fill this gap in the literature, herd behavior in the Nigerian equity market will be examined for the period 2019-2021. Any researcher has not examined the herding behavior of investors in Nigerian equity market during this period yet. In addition, the duration of this study includes the year during the outbreak of Coronal virus. Based on this, the following research questions are formulated below [6].
Theoretical framework
Conventional financial theory: The classical finance framework, which has dominated the industry for decades, employs 'rational' agent models to explain financial markets. There are two distinct interpretations of rationality. First, when agents obtain new knowledge, they accurately revise their views. And secondly, depending on these accurately updated beliefs, individuals make normatively appropriate decisions [7]. This conventional financial paradigm appears to be too simplistic to be generally supported by the evidence. Numerous empirical studies have demonstrated that the operation of the stock market and the trading behavior of investors are not as easily explicable within this framework as one might anticipate. Under the assumption that agents are rational, asset prices match their underlying worth in the traditional framework of finance. The framework has produced the Efficient Market Hypothesis (EMH), which has been the subject of numerous empirical examinations. It asserts that markets are efficient and that prices reflect their intrinsic worth. According to the EMH, if a market is efficient, investors cannot achieve above-average risk-adjusted returns [8].
Empirical review
Ouarda, Bouri and Bernard conducted an empirical investigation on the herding behavior investors under different markets condition. The authors claimed that their work added to existing literatures on herding behavior of investors in developed economy and on the entire European market. They also examined herding on sectoral levels by adopting data at companies’ levels and estimated herding behavior in forms of volume of transaction traded, returns and volatility. The researchers found out that there is herding behavior during the global recession in 2007-2008 and during the Asian crisis. The further argued that there is presence of herding in the market due to the bearish condition of the market. This was driven by the volume of trade and strong volatility [9].
Herd behavior was first observed in the Indian stock market between 2003 and 2008, prompting research by Saumitra and Siddharth. The empirical findings supported the idea that investors in the Indian stock market are influenced by herd behavior, as stock return dispersions tended to reduce rather than increase during periods of dramatic price swings [10]. Herd behavior, according to the authors, is most prominent in the midst of catastrophic crashes.
Researchers Nakagawa, et al. looked at the Japanese loan market for signs of herd behavior among market participants and the resulting potential damage to the economy. It was first claimed that the various Japanese financial organizations acted in a herd mentality. Furthermore, it was found that financial institutions acted in a herd, which was correlated negatively with GDP and land prices across many time periods. The authors interpreted these findings as suggesting that loans issued by herding of financial institutions could induce inefficiencies of financial markets and disrupting the real economy through a decrease in GDP and land values due to the unstable association between herding and the economy [11].
Five nations in Central and Eastern Europe were studied by Filip, et al. to analyze market behavior. They examined market data from Romania, Poland, Bulgaria, the Czech Republic, and Hungary to look for signs of herding behavior, to see if there were any differences in herding behavior before and after crises, and to see if there were any differences in herding behavior in rising or falling markets. To account for the nonlinear link between stock return and market return, the authors employed a slightly modified version of Chang, et al. CSAD technique, which included the addition of a regressor. They added a supplementary variable and a lag term to account for multicollinearity and boost the robustness of the regression [12]. In the countries of Romania, Bulgaria, the Czech Republic, and Hungary, they discovered signs of herding. Furthermore, they discovered that herding behavior was more evident in bear markets than bull ones, yet there was no discernible difference between herding behavior before and after a crisis and during one.
Investors differ in their gender, education, age, experience, and income, all of which were taken into account by Shusha and Touny as they investigated the effects of four underlying variables of investor behavior: Choice accuracy, fast decision, overconfidence, and investor mood. A total of 255 participants filled out the questionnaire used in the study [13]. According to the estimated models, the primary drivers of attitude that explain why individual investors follow herd behavior are choice precision, fast decision, and investor mood. Nonetheless, complacency does not seem to prevent herd behavior in any of the modeled scenarios.
Dang and Lin's study found evidence of herding behavior in the stock market, with the phenomenon being more prevalent during periods of rising stock prices than falling ones. Vulture behavior was also discovered by Espinosa and Arias in their study of the Australian stock market.
Using a non-parametric kernel regression model, Mahmud and Tinic present new evidence of herding behavior in A-type and B-type Chinese financial markets. Under both extreme high and low market return scenarios, their findings show statistically substantial evidence of herding behavior in the A-type market. The authors claim that the results indicated only minimal evidence of herding behavior in the B-type market. Herding behavior in China was only observed for type A equities, according to study conducted by Li, Hu, and Tang across three different crises.
Bensaida looked at sector-level market behavior in the United States across four distinct market downturns. For this purpose, he used a CSAD model with additional repressors for trading volume and investor emotion to look for correlations between herding and these two variables. Black Monday, the .com bubble, the 2002 market crash, and the 2008 global financial crisis were the four time periods studied. The end results proved that US market herding only occurred during bear markets. Bensaida revealed that herding behavior in the market was connected with market sentiment in 4 of the 12 industries studied, but there was no correlation between trading volume and herding [14].
Method
This study used quantitative research design to test the herding behavior of investors in Nigerian equity market. A random technique was adopted to select the companies with sufficient observations that will cover the scope of this study. Data on stock prices of five companies are used in this study. The data for this study are collected from the www.investing.com for a period of 8 years, which span from 2015 to 2022. The data were used to calculate the cross-sectional absolute standard deviation.
Nature and source of data: The data on weekly stock prices of the selected five firms were collected through www.investing.com. These data were collected over a period of 8 years.
Model specification: This study is line with the study of Moatemri, Abdelfatteh and Olivero who measured herding behavior as once measure in the studies of Tan, et al. and Zheng, et al. based on the two measures that Christie and Huang and Chang, et al. proposed. In order to test herding behavior distinctly from the studies cited above I use a sample set of five company’s stock prices from the Nigerian equity market [15].
Basis of estimated model: To measure or calculate dispersion returns cross-sectional absolute standard deviation among individual company returns within a specific group of securities is utilized.
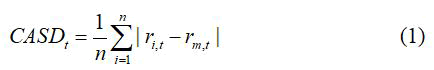
Chang et al. suggested the return dispersion (CASDt) methodology in equation 1.
To test herding behavior investors in Nigerian equity market, I adjust the specification in equation 1 to be:
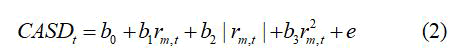
With the specification above the asymmetric of the investor behavior during different market phases or conditions is been taken care of.
CASDt is refer to as a measure of return and rm,t is known as the value of an equally weighted realized return of shares. This method suggested that there will be herding once a less than or lower than proportionate rise/increase in CASDt (cross sectional absolute deviation) when there is a strong movements in the market.
Herding behavior during up-ward and downward markets: Various authors have carried out studies on asymmetric characteristics of asset returns. I am concerned with in investing investors’ behavior in weeks when the market is down and weeks when the market is up or increasing. In order to achieve this method proposed by Chiang et al., is employed. In this method, I introduced a dummy variable in equation 2 above thus, I have:

The equation 3 above will be adopted separately for each firm selected in this study.
The data is separated into two parts using “a” as a dummy variable. This variable is assign one (1) when there is negative portfolio return and its takes zero when there is positive market portfolio return. There is evidence of herding if the coefficient of b3 and b4 are negative and statistically significant, with b3 less than b4 the effects are well noticed in the weeks the markets are down.
Estimation technique
In conducting a test on the herding behaviour of investors in Nigerian equity market, ordinary least square estimator is used. The analysis was conducted using E-view 10 statistical tool.
Descriptive statistics results
The descriptive statistic results are done using mean, standard deviation, skewness, kurtosis and probability of the Jarque-Bera statistic. Table 1 and Table 2 present these results.
| Dangote | Flour_mill | Guinness | UBA | Zenith | |
|---|---|---|---|---|---|
| Mean | 189.7841 | 23.45178 | 70.28005 | 6.738934 | 20.08801 |
| Median | 180.0000 | 21.25000 | 72.00000 | 6.675000 | 20.00000 |
| Maximum | 280.0000 | 38.00000 | 160.8900 | 12.95000 | 33.00000 |
| Minimum | 117.0000 | 13.50000 | 13.00000 | 2.600000 | 9.440000 |
| Std. dev. | 38.91849 | 6.264917 | 39.18332 | 2.321347 | 4.706141 |
| Skewness | 0.499288 | 0.339908 | 0.223818 | 0.420766 | 0.186172 |
| Kurtosis | 2.388504 | 1.867995 | 2.008128 | 2.693189 | 2.373659 |
| Jarque-Bera | 20.90897 | 26.58965 | 18.05885 | 12.23523 | 8.096881 |
| Probability | 0.000029 | 0.000002 | 0.000120 | 0.002204 | 0.017450 |
| Observations | 366 | 366 | 366 | 366 | 366 |
| Source: e-view 10 output | |||||
Table 1. Descriptive statistics of the five company share prices.
The Table 1 above shows the descriptive characteristics of all the five companies’ stock prices. The mean value of stock prices of Dangote cement, Flourmill, Guinness, UBA and Zenith bank are approximately 189.78, 0.03, 23.45, 70.28, 6.74 and 20.09 respectively. Their standard deviation values are approximately 38.92, 6.26, 39.18, 2.32 and 4.71 for Dangote cement, Flourmill, Guinness, UBA and Zenith bank. Guinness plc has the highest standard deviation value followed by Dangote cement. While UBA has the lowest standard deviation value followed by zenith bank. The stock prices of all the companies are positively skewed. The kurtosis values of all the variables are below 3 meaning they are platykurtic in nature; the probability values for the entire variables are approximately zeros. This is an indication that the series of the variables do not follow a normal distribution pattern.
In the below Table 2 the descriptive statistics of the stock return of Dangote cement, Flourmill, Guinness, UBA and Zenith bank is presented the average value of Dangote cement stock return, Flourmill stock return, Guinness stock return, UBA stock return and Zenith bank stock return are approximately -0.0004, -0.0013, -0.004, 0.001 and 0.0004 respectively. Only UBA and Zenith bank that has a positive mean value while the other companies have a negative mean return. The standard deviation of Dangote cement stock return, Flourmill stock return, Guinness stock return, UBA stock return and Zenith bank stock return are approximately 0.070, 0.078, 0.081, 0.079 and 0.080. The skewness values for all the companies’ stock returns are negative with kurtosis values above three. Also, the series of the variables do not follow a normal distribution [16].
| Dangote_return | Flour_mill_return | Guinness_return | UBA_return | Zenith_bank_return | |
|---|---|---|---|---|---|
| Mean | -0.00037 | -0.0013 | -0.00404 | 0.000998 | 0.000385 |
| Median | 0.000000 | 0.000000 | 0.000000 | 0.000000 | -0.00195 |
| Maximum | 0.244444 | 0.228464 | 0.275894 | 0.298153 | 0.325397 |
| Minimum | -1.000000 | -1.000000 | -1.000000 | -1.000000 | -1.000000 |
| Std. dev. | 0.070203 | 0.078013 | 0.080533 | 0.078991 | 0.079677 |
| Skewness | -7.4372 | -5.44884 | -4.7203 | -5.30235 | -5.42571 |
| Kurtosis | 114.7251 | 75.36961 | 66.64320 | 72.92452 | 71.60675 |
| Jarque-Bera | 193732.2 | 81680.83 | 63128.61 | 76278.95 | 73575.76 |
| Probability | 0.000000 | 0.000000 | 0.000000 | 0.000000 | 0.000000 |
| Observations | 366 | 366 | 366 | 366 | 366 |
| Source: E-view 10 Output | |||||
Table 2. Descriptive statistics of the five company share returns.
Inferential statistic result
The inferential statistic result is based on the test of the equations stated in chapter three, equation 2 and equation 3. These equations were estimated using Ordinary Least Square (OLS) and Two-Stage Least Square (2SLS) for each of the sub-periods and for the aggregate period in testing the hypotheses of this study.
The test of the level of market wide herding behaviour: The test of hypothesis that the level of market wide herding of investors in Nigerian equity market is low. This test is conducted for the aggregate period, pre-COVID period, during COVID, and post COVID and the results are reported in the Tables below.
Table 3 below shows the result of the present of market wide herding behavior for the aggregate period which ranges from 2015 to 2021. Two estimators were used for this purpose and they are ordinary least square and two stage least square. The test of the market wide herding behavior is based on the sign of the coefficient of RMSQ (portfolio return square). If this coefficient is negative and significant it means that there is herding behavior around the market. In the Table above the coefficient of return square is -1.547 with probability value of 0.006 given by both OLS and 2SLS. Since the coefficient of return square is negative and significant there is an evidence of market wide herding during the aggregate period? Alternately, the participants in this market were taken decision based on the decision of others investors [17].
| OLS | 2SLS | ||||||||
|---|---|---|---|---|---|---|---|---|---|
| Variable | Coefficient | Std. error | t-Statistic | Prob. | Variable | Coefficient | Std. error | t-Statistic | Prob. |
| RM | 0.053 | 0.023 | 2.344 | 0.019 | RM | 0.053 | 0.022 | 2.344 | 0.019 |
| ABSRM | 0.516 | 0.068 | 7.645 | 0 | ABSRM | 0.516 | 0.068 | 7.645 | 0 |
| RMSQ | -1.547 | 0.556 | -2.78 | 0.006 | RMSQ | -1.547 | 0.556 | -2.78 | 0.006 |
| C | 0.019 | 0.001 | 13.105 | 0 | C | 0.019 | 0.001 | 13.105 | 0 |
| Source: E-view 10 output | |||||||||
| Note: CASD (cross-sectional absolute deviation) is the dependent variable | |||||||||
Table 3. Test of the level of market wide herding behaviour for the aggregate period (2015-2021).
The output of the test on market wide herding for pre-COVID period is reported in the above Table. Two different estimation techniques were adopted for this test. These estimators are OLS and 2SLS. The results of the 2SLS are used to verify the results of the OLS. From the below Table 4, it is seen that the coefficient of RMSQ is -1.229 with probability value of 0.062. The result given by the OLS is same as that of the 2SLS. Thus, this result reveals that there is presence of market wide herding in the pre-COVID period. The next Table gives the results of market wide test during the COVID period [18].
| OLS | 2SLS | ||||||||
|---|---|---|---|---|---|---|---|---|---|
| Variable | Coeff | Std. error | t-Stat | Prob. | Variable | Coeff | Std. error | t-Stat | Prob. |
| RM | 0.079 | 0.029 | 2.692 | 0.008 | RM | 0.079 | 0.029 | 2.692 | 0.008 |
| ABSRM | 0.474 | 0.085 | 5.56 | 0.000 | ABSRM | 0.474 | 0.085 | 5.56 | 0.000 |
| RMSQ | -1.229 | 0.654 | -1.88 | 0.062 | RMSQ | -1.229 | 0.654 | -1.88 | 0.062 |
| C | 0.021 | 0.002 | 10.386 | 0 | C | 0.021 | 0.002 | 10.386 | 0.000 |
| Source: E-view 10 output | |||||||||
| Note: That CASD meaning cross sectional absolute deviation is the dependent variable | |||||||||
Table 4. Test of the level of market wide herding behaviour for the pre-COVID period (2015-2018).
The results of the current market-wide herding tendency are displayed in Table 5 below during the heat of COVID-19, which runs from 2019 through 2020. For this, the Ordinary Least Square and Two Stage Least Square estimation methods were utilized. The sign of the RMSQ coefficient serves as the basis for the examination of market-wide herding behavior. The market is experiencing herding behavior if this coefficient is negative and significant. The coefficient of return square RMSQ in the above Table is approximately -1.045 with associated probability value of 0.381 provided by both OLS and 2 SLS. There is confirmation of market-wide herding over the entire period because the coefficient of return square is negative and significant. Thus, during the COVID period there is presence of cascading. The findings of a market-wide test conducted for the post COVID period are shown in the subsequent Table.
| OLS | 2 SLS | ||||||||
|---|---|---|---|---|---|---|---|---|---|
| Variable | Coeff | Std. error | t-Stat | Prob. | Variable | Coeff | Std. error | t-Stat | Prob. |
| RM | -0.00747 | 0.037671 | -0.19827 | 0.8432 | RM | -0.00747 | 0.037671 | -0.19827 | 0.8432 |
| ABSRM | 0.425222 | 0.1356 | 3.135853 | 0.0023 | ABSRM | 0.425222 | 0.1356 | 3.135853 | 0.0023 |
| RMSQ | -1.04562 | 1.188928 | -0.87946 | 0.3813 | RMSQ | -1.04562 | 1.188928 | -0.87946 | 0.3813 |
| C | 0.020185 | 0.002767 | 7.295276 | 0 | C | 0.020185 | 0.002767 | 7.295276 | 0 |
| Source: E-view 10 output | |||||||||
| Note: That CASD meaning cross sectional absolute deviation is the dependent variable | |||||||||
Table 5. Test of the level of market wide herding behavior during COVID Period (2019-2020).
The below Table 6 summarizes the results of the market-wide herding test conducted in the post COVID period. For this test, two alternative estimating methods were used. OLS and 2SLS are the estimators used here. The outcomes of the OLS are validated using the outcomes of the 2SLS. The coefficient of RMSQ is approximately -9.59 with a probability value of 0.107, as can be seen in the Table below. The OLS and 2SLS both produce the same outcome. This is an indication that there is insignificant herding behavior of investors during this period. Thus, this finding suggests that market-wide herding existed throughout the post COVID period.
| OLS | 2SLS | ||||||||
|---|---|---|---|---|---|---|---|---|---|
| Variable | Coeff | Std. error | t-Stat | Prob. | Variable | Coeff | Std. error | t-Stat | Prob. |
| RM | 0.120331 | 0.120707 | 0.996888 | 0.3238 | RM | 0.120331 | 0.120707 | 0.996888 | 0.3238 |
| ABSRM | 1.293688 | 0.382415 | 3.382942 | 0.0014 | ABSRM | 1.293688 | 0.382415 | 3.382942 | 0.0014 |
| RMSQ | -9.58845 | 5.838091 | -1.6424 | 0.107 | RMSQ | -9.58845 | 5.838091 | -1.6424 | 0.107 |
| C | 0.008388 | 0.004327 | 1.938535 | 0.0585 | C | 0.008388 | 0.004327 | 1.938535 | 0.0585 |
| Source: E-view 10 output | |||||||||
| Note: That CASD meaning cross sectional absolute deviation is the dependent variable | |||||||||
Table 6. Test of the level of market wide herding behaviour for the post COVID period (2021).
Test of herding behavior in the up and down market
This test is conducted to know if there is presence of herding behavior during the up market or during the down market and it is tested for all the periods; aggregate period, pre-COVID period, during COVID, and post COVID. And the results are reported in the Tables below [19].
The coefficient value of Dummy return square ARMSQ is used to determine if there is herding behavior in the down market while (1-A) RMSQ is utilize to determine if there is presence of herding or not in the up-market. In Table 7 the results for the aggregate period is presented and the coefficient of (1-A) RMSQ is -2.074 and probability value of 0.0003 given by the OLS. The 2SLS gives coefficient value to be -2.074 with probability value of 0.043. The coefficient of (1-A) RMSQ is having a negative and significant effect on cross sectional absolute deviation. It means there is significant herding behavior in the up market. However, the coefficient of ARMSQ is positive and insignificant as seen from the output of both OLS and 2SLS.
| OLS | 2SLS | ||||||||
|---|---|---|---|---|---|---|---|---|---|
| Variable | Coeff | Std. error | t-Stat | Prob. | Variable | Coeff | Std. error | t-Stat | Prob. |
| (1-A) RM | 0.598 | 0.073 | 8.25 | 0 | (1-A) RM | 0.598 | 0.1 | 5.959 | 0 |
| ARM | -0.242 | 0.097 | -2.491 | 0.013 | ARM | -0.242 | 0.101 | -2.396 | 0.017 |
| (1-A) RMSQ | -2.074 | 0.573 | -3.616 | 0.0003 | (1-A) RMSQ | -2.074 | 1.023 | -2.027 | 0.043 |
| ARMSQ | 1.514 | 1.102 | 1.374 | 0.17 | ARMSQ | 1.514 | 1.339 | 1.131 | 0.259 |
| C | 0.02 | 0.001 | 13.654 | 0 | C | 0.02 | 0.001 | 14.665 | 0 |
| Source: E-view 10 output | |||||||||
| Note: That CASD meaning cross sectional absolute deviation is the dependent variable | |||||||||
Table 7. Test of herding behaviour in the up and down market for the aggregate period (2015-2021).
As shown in Table 8 the test of herding behavior of investors when the market is up and when the market is down for the pre-COVID period. The results of the 2SLS are used to confirm the results of the OLS in this study. The coefficient and probability value of ARMSQ are approximately 0.70 and 0.61 respectively. This result indicates that ARMSQ has a positive but insignificant influence on CASD (Cross-Sectional Absolute Deviation). This means that there is absence of herding behavior when the market is down. For (1-A) RMSQ the coefficient is negative and significant at 5 percent alpha value. That is to say when the market is up investors tend to mimic each other. This outcome is same for the two estimators used [20].
| OLS | 2SLS | ||||||||
|---|---|---|---|---|---|---|---|---|---|
| Variable | Coeff | Std. error | t-Stat | Prob. | Variable | Coeff | Std. error | t-Stat | Prob. |
| (1-A) RM | 0.562 | 0.091 | 6.149 | 0 | (1-A) RM | 0.562 | 0.091 | 6.149 | 0 |
| ARM | -0.251 | 0.128 | -1.962 | 0.051 | ARM | -0.251 | 0.128 | -1.962 | 0.051 |
| (1-A) RMSQ | -1.489 | 0.672 | -2.214 | 0.028 | (1-A) RMSQ | -1.489 | 0.672 | -2.214 | 0.028 |
| ARMSQ | 0.7 | 1.395 | 0.502 | 0.616 | ARMSQ | 0.7 | 1.395 | 0.502 | 0.616 |
| C | 0.021 | 0.002 | 10.459 | 0 | C | 0.021 | 0.002 | 10.459 | 0 |
| Source: E-view 10 output | |||||||||
| Note: That CASD meaning cross sectional absolute deviation is the dependent variable | |||||||||
Table 8. Test of herding behaviour in the up and down market for the pre-COVID period (2015-2018).
The test of investor herding behavior during market ups and downs during the pre-COVID period is presented in Table 9. The findings of the 2SLS are used in this study to support the findings of the OLS. The probability value and coefficient for ARMSQ are roughly 0.01 and 4.76, respectively. This finding suggests that ARMSQ has a significant but positive impact on CASD (cross-sectional absolute deviation). This indicates that when the market is down, there is no significant herding behavior. The coefficient for (1-A) RMSQ is approximately -2.86 with probability value of 0.02, this coefficient is negative and significant. In other words, when the market is doing well or up, investors often imitate one another. The two estimators utilized yield the same results.
| OLS | 2SLS | ||||||||
|---|---|---|---|---|---|---|---|---|---|
| Variable | Coeff | Std. error | t-Stat | Prob. | Variable | Coeff | Std. error | t-Stat | Prob. |
| (1-A)RM | 0.562892 | 0.142624 | 3.946694 | 0.0001 | (1-A)RM | 0.562892 | 0.142624 | 3.946694 | 0.0001 |
| ARM | -0.01794 | 0.162941 | -0.11012 | 0.9125 | ARM | -0.01794 | 0.162941 | -0.11012 | 0.9125 |
| (1-A)RMSQ | -2.85879 | 1.201271 | -2.3798 | 0.0192 | (1-A)RMSQ | -2.85879 | 1.201271 | -2.3798 | 0.0192 |
| ARMSQ | 4.760154 | 1.840398 | 2.58648 | 0.0112 | ARMSQ | 4.760154 | 1.840398 | 2.58648 | 0.0112 |
| C | 0.021841 | 0.002618 | 8.343401 | 0 | C | 0.021841 | 0.002618 | 8.343401 | 0 |
| Source: E-view 10 output | |||||||||
| Note: That CASD meaning cross sectional absolute deviation is the dependent variable | |||||||||
Table 9. Test of herding behaviour in the up and down market during COVID period (2019-2020).
The test of cascading behavior of investors during the up and down market was analyzed for the post COVID period and the outcome of this test is presented in the below Table 10. Both OLS and 2SLS estimation methods were adopted to test the presence of herding in both up market and down-market phases. The result of the 2SLS is used as a robustness check against the result of the OLS. As seen from the Table the coefficient of ARMSQ is negative and insignificant given by both estimators. By implication, there is insignificant herding behavior in the down market during this sample period. Similarly, the coefficient of (1-A) RMSQ is negative but insignificant; this shows that there is insignificant herding in the up market for the post COVID period in Nigeria.
| OLS | 2SLS | ||||||||
|---|---|---|---|---|---|---|---|---|---|
| Variable | Coeff | Std. error | t-Stat | Prob. | Variable | Coeff | Std. error | t-Stat | Prob. |
| (1-A)RM | 1.420533 | 0.418469 | 3.394596 | 0.0014 | (1-A)RM | 1.420533 | 0.418469 | 3.394596 | 0.0014 |
| ARM | -1.25257 | 0.649485 | -1.92857 | 0.0598 | ARM | -1.25257 | 0.649485 | -1.92857 | 0.0598 |
| (1-A)RMSQ | -9.57966 | 5.898675 | -1.62404 | 0.1111 | (1-A)RMSQ | -9.57966 | 5.898675 | -1.62404 | 0.1111 |
| ARMSQ | -11.9964 | 16.77339 | -0.71521 | 0.478 | ARMSQ | -11.9964 | 16.77339 | -0.71521 | 0.478 |
| C | 0.008141 | 0.004658 | 1.747556 | 0.0871 | C | 0.008141 | 0.004658 | 1.747556 | 0.0871 |
| Source: E-view 10 output | |||||||||
| Note: That CASD meaning cross sectional absolute deviation is the dependent variable | |||||||||
Table 10. Test of herding behaviour in the up and down market for the post COVID period (2021).
Using the aggregate sample period, the herding behavior of investors was analyzed and it was revealed that there is presence of significant market wide herding in Nigeria. This finding is supported by the finding of Gabbori who discovered that there is presence of significant herding in Saudi stock market. Also, Auwal and Sanusi revealed that there is evidence of herd behaviors of investors in the insurance sector of the Nigerian financial system. This demonstrates that during the time period under examination Nigerian investors followed the market's performance and paid little attention to the unique qualities of the stocks. The outcome of this study shows that in the up market there is evidence of significant herding behavior but no herding behavior when the market is down. These findings are partly support and partly oppose the studies of Yousaf, et al. and Dang and Lin's. First, from the findings of Yousaf, et al. in the Pakistani stock market, they argued that there is no indication of herd behavior in the period of low and high volatility and at the time when the market was up and when it was down. Secondly, Dang and Lin's study found evidence of herding behavior in the stock market, with the phenomenon being more prevalent during periods of rising stock prices than falling ones.
The researcher came up with the following conclusions, which are given in the following order below, based on the key findings for the aggregate sample period outlined in this study.
• The study concluded that there is market wide herding behavior
of investors; this indicates that the market is inefficient.
• It is concluded that when the market is up there is presence of
significant herding behavior of investors. Investors tend to follow
the same direction in their investment decision.
• Lastly, it is concluded that there is no significant herding behavior
of investors when the market is down.
The following policy recommendations are made by the researcher in this report for the government and regulatory organizations of the Nigerian stock market to adopt. They are listed below.
• When there is herding in the market, this suggests that the
market is inefficient and as such it is recommended that there
should be restriction on short sales in order to raised or increase
market efficiency. Also, the efficiency of the market will likewise
increase when the cost of information declines.
• Herding behavior can also result in a greater degree of
financial asset return co-movement, which lessens the
advantages of portfolio diversification. Investors are therefore
advised to spot herding activity in the financial markets
before taking any investment decision.
Suggestion for further studies
This study contributed to the on growing literatures on the herding behavior of investors in various financial markets. The study sample size is just five quoted companies in the Nigeria Stock Exchange for a period ranging from 2015 to 2021, longer time series data periods for future research are advised and more quoted firms can be added to future work. Additionally, nations from sub-Saharan Africa can be chosen for future study. Also, future research may choose to include volume of trade, daily data, quarter and yearly data.
Business and Economics Journal received 6451 citations as per Google Scholar report


