Research Article - (2022) Volume 13, Issue 4
Received: 17-Jan-2022, Manuscript No. HYCR-22-53955;
Editor assigned: 19-Jan-2022, Pre QC No. HYCR-22-53955;
Reviewed: 02-Feb-2022, QC No. HYCR-22-53955;
Revised: 17-Mar-2022, Manuscript No. HYCR-22-53955;
Published:
01-Apr-2022
, DOI: DOI: 10.37421/2157-7587.2022.13. 399
Citation: Olotu Yahaya, Olanrewaju OO, Rodiya AA, and Adekunle PA. "Experimental Study of Rainfall-Runoff Process under a Calibrated Rainfall Simulator ." Hydrol Curr Res 13 (2022): 399.
Copyright: © 2022 Olotu Y. This is an open-access article distributed under the terms of the creative commons attribution license which permits unrestricted use, distribution and reproduction in any medium, provided the original author and source are credited.
Rainfall and runoff are important components of the hydrological cycle. The relationship between these components is very important for the Integrated Water Management System (IWMS), soil erosion control, and irrigation scheduling. Modeling rainfall-runoff also plays an important role in the management and planning of water resources [1,2]. This relationship basically depends on some factors such as characteristics of rainfall, runoff, temperature, and infiltration [3]. Runoff is generated when all the processes such as infiltration, evaporation demands have been satisfied. The rate and volume of generated runoff depend on rainfall characteristics (rainfall intensity, rainfall duration, and rainfall variability), catchment (catchment area, shape, slope, and orientation), and the soil types (mineral and organic) and nature.
Rainfall intensity is significant in generating surface and sediment yield. Raindrop impact energy is related to the surface runoff and rainfall intensity. Therefore, a high-intensity storm could be attributed to large soil detachments and transportation [4]. Mohamad and Ataollah [5] indicated that the rate of surface flow and sediment transport depends on rainfall intensity [6]. Truman [7] compared the impact variable and constant rainfall intensity on runoff and showed that large surface runoff was generated with variable rainfall intensity at the initial stage of rainfall-runoff simulation, while more surface flow was generated at the final stage of the constant rainfall-intensity event.
Estimation of a precise surface flow is useful for flood design and also important in optimum usage of precipitation in dryland farming land preparations [8]. Models as physically-based and conceptual have been used to simulate the rainfall processes. However, due to its complexity and spatio-temporal variation, few models can accurately simulate this highly non-linear process [9]. Rain Simulators (RSs) are mostly be used to create artificial rainfall of different intensities to study interactions among rainfall, surface runoff, and sediment yield. RSs found their application in field measurements and laboratory experiments, where the impact of weather conditions is undesirable [10]. They have been used to accelerate research in soil erosion and runoff from agricultural land and highways [11]. This system may not reproduce rainfall accurately because the rainfall intensity is constant and raindrop kinetic energy is mostly impacted on a particular point on the soil surface. However, the laboratory experiment has its downsides, but it is very important in the simulation of surface runoff events [12]. In this study, a locally developed portable rainfall simulator would be applied to create rainfall of varying intensities on two sized runoff plots A (1.2 m* 0.6 m) and B (1.0 m* 0.5 m). The time response of rainfall intensities to the generation of surface runoff would be conceptually determined.
Study area
Simulated rainfall studies were conducted at Auchi Polytechnic, Auchi, Edo State, Nigeria. It is located at 7.07 latitude and 6.26 longitudes, and it is situated at 188 meters above sea level. The experimental site experiences an average annual rainfall of 1211 mm and a mean temperature of 29.5oC. The location of the study area is shown in (Figure 1).

Figure 1. Map of Edo State showing Etasko-West.
Development of rainfall simulator
A rainfall simulator made of a 2 mm metal sheet with 0.6 m* 0.4 m dimension and adjustable feet with a minimum height of 1.3 m is used for the experiment. The framework supporting the simulator tank was constructed of angular steel supported at the four edges. Elbow joints of different diameters were used to join the PVC pipe as shown in Figure 2. Minimum and maximum rainfall intensities of 0.18 mm/min and 0.25 mm/min were generated.

Figure 2. Installation of rainfall simulator and runoff plot.
Calibration of rainfall simulator
A number of 15 catch cans of 0.1 m in diameter were placed at spacing (25 cm* 25 cm) to collect water under varying pressure of 0.5 kg/cm3, 1.0 kg/cm3, 1.5 kg/cm3and 2.0 kg/cm3respectively. The volume of collected rainwater was converted to the millimeter as follows.

Where Rd=Rainfall depth (cm);
V=Collected rainfall volume (cm3);
A=Orifice area (cm2).
Rd is converted to the nearest (mm) by the value of 1000 [13].
Kinetic energy of rainfall intensities and uniformity were estimated using eqs. 2 and 3

Where KE is kinetic energy (J m-2 mm-1) and I is rainfall intensity (mm h-1).

Where is the mean rainfall intensity (mm h-1), n is the number of observations, and Xi(i=1, 2. …..n) are the individual observations. X
Runoff plots
The Runoff Plots (RPs) were constructed from 2mm mild steel to prevent blending. The plot (A) is 1.2 m × 0.6 m, while (B) is 1.0 m × 0.5 m, a height of 0.25 m each. Each of the RPs was driven into the bare soil to the depth of 0.125 m as depicted in plate 1. Rainfall Intensities (RI) of 10.8 mm/hr, 12.6 mm/hr, 14.4 mm/hr, 15.0 mm/hr, 15.2 mm/hr., and 15.3 mm/hr were simulated on the runoff experimental plots. The generated surface runoff volume from the simulation attempts was converted to the depth in millimeter in equations 4 and 5.
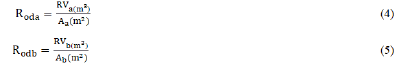
Where;
Roada is runoff depth (mm) from plot (A), Roada is the runoff depth from plot (B)
RVa and RVb are from runoff volume from plot A and B respectively
Aa and Ab are the runoff catchment areas for plots A and B [13].
Data analysis
The relationship of the variables such as simulated rainfall and runoff intensities, infiltration and soil moisture were evaluated using SPSS software. Regression coefficients were used to evaluate the differences and develop a robust model.
Generation of water balance variables
The results in (Tables 1 and 2) showed the generation hydrological variables as surface runoff (GR), Initial Moisture Content (IMC), and other variables when subjected to various simulated rainfall depths under runoff plots A and B. The relationship between the Simulated Rainfall (SR) and Generated Surface Runoff (GR) indicated that large surface flow was observed at plot B under each rainfall simulation attempt, whereas more infiltration was recorded in plot A. Based on these observations, it was deduced that surface flow was quickly generated in plot B due to its small catchment area which allowed the watershed to contribute to an initial runoff under less concentration time. Hence, the Infiltration Depth (INFT) is low in plot B, while INFT is high in plot A due to its large catchment area which allowed a longer period for the surface flow to be generated. However, the established relationship of rainfall-runoff for each catchment plot (A and B) indicated a robust relationship between the variables (SR and GR) with R2= 0.9942 for B and 0.9926 for plot A at P<0.05 as (Figure 3). The finding agrees the study showed that rainfall-runoff established in East Singhblum district showed a good correlation between the hydrological variables with a coefficient of determination value of 0.99. The early initial response of runoff generation from the small runoff plot (B) under simulated rainfall is similar to the investigation of [13] showed that smaller runoff plot ABCDa generated higher surface flow than large plot EFGHm. The field experimental was investigated with seven simulated rainfall attempts using Rainfall Depths (RD) of 20.0 mm, 40.0 mm ………140.0 mm with incremental of 20.0 mm per simulation attempt (Table 1, 2, and Figure 4). The RD corresponded to selected rainfall intensities (RI) of 10.8 mm/hr, 12.6 mm/hr, 14.4 mm/hr, 15.0 mm/hr, 15.2 mm/hr, and 15.3 mm/hr. The investigations were conducted on runoff plots A (1.2 m × 0.6 m) and B (1.0 m × 0.5 m) as shown in (Table 3).
| SR (mm) | GR (mm) | IMC (%) | FMC (%) | WC (%) | INFT (mm) |
|---|---|---|---|---|---|
| 20 | 0 | 15.3 | 33.2 | 17.9 | 20 |
| 40 | 10.2 | 14.5 | 35.9 | 21.4 | 30 |
| 60 | 25.1 | 10.3 | 44.2 | 33.9 | 35 |
| 80 | 36.1 | 12.3 | 48.9 | 36.6 | 43.9 |
| 100 | 45.1 | 10.8 | 53.1 | 42.3 | 54.9 |
| 120 | 54.3 | 9.6 | 61.8 | 52.2 | 65.7 |
| 140 | 63.4 | 7.9 | 69.9 | 62 | 76.6 |
Table 1. Generated water balance parameters from runoff plot (A).
| SR (mm) | GR (mm) | IMC (%) | FMC (%) | WC (%) | INFT (mm) |
|---|---|---|---|---|---|
| 20 | 0 | 17.3 | 37.9 | 20.6 | 20 |
| 40 | 20 | 14.5 | 39.1 | 24.6 | 20 |
| 60 | 41.7 | 9.1 | 44.2 | 35.1 | 18.3 |
| 80 | 61.7 | 12.3 | 48.2 | 35.9 | 18.3 |
| 100 | 77.1 | 14.6 | 53.1 | 38.5 | 22.9 |
| 120 | 92.5 | 13.5 | 65 | 51.5 | 27.5 |
| 140 | 107.9 | 11 | 70.1 | 59.1 | 32.1 |
| SR=Simulated Rainfall; GR=Generated Runoff; IMC=Initial Moisture Content (IMC); FMC= Final Moisture Content; WC=Water Content; INFT=Infiltration. | |||||
Table 2. Generated water balance parameters from runoff plot (B).
| RI (mm/hr) | ROA (mm/h) | ROB (mm/h) | MSR (mm) | MROA (mm) | MROB (mm) | KA | KB | |
|---|---|---|---|---|---|---|---|---|
| 10.8 | 0 | 0 | 28.3 | 1.5 | 3.5 | 0 | 0 | |
| 12.6 | 10.2 | 20 | 45 | 12 | 21.9 | 0.3 | 0.5 | |
| 14.4 | 25.1 | 41.7 | 61.7 | 22.6 | 40.3 | 0.4 | 0.7 | |
| 15 | 36.1 | 61.7 | 78.3 | 33.1 | 58.7 | 0.5 | 0.8 | |
| 15.2 | 45.1 | 77.1 | 95 | 43.7 | 77.1 | 0.5 | 0.8 | |
| 15.2 | 54.3 | 92.5 | 111.7 | 54.3 | 95.5 | 0.5 | 0.8 | |
| 15.3 | 63.4 | 107.9 | 128.3 | 64.8 | 113.9 | 0.5 | 0.8 | |
| RI (mm/hr)=Rainfall Intensity; ROA (mm/hr) and ROB (mm/hr)=surface runoff from plots A and B; MSR (mm)=Modelled Rainfall; MROA and MROB=Simulated Runoff from Plot A and B; KA and KB=Runoff Coefficient for plot A and B. | ||||||||
Table 3. Observed and modelled water balance parameters from plot A and B.

Figure 3. Relationship between Simulated Rainfall (SR) and Generated Runoff (GR) over the runoff plots.

Figure 4. Rainfall simulated attempts.
Effects of rainfall intensities on surface runoff
During the field experimentation, seven (7) Rainfall Intensities (RI) were applied as precipitation events for each of the runoff plots A and B as shown in (Table 3). The surface coefficients for plots A (KA) and B (KB) were estimated using WMESS (2017) approach as the ratio of the volume of simulated rainfall at each simulation attempt. Applied RI of 10.8 mm/hr generated 0.0 mm/hr for plots A and B respectively. This indicated that the simulated rainfall was lost to infiltration. Conversely, the second simulation attempt of 12.6 mm/hr generated 10.2 mm/hr and 20.0 mm/hr for ROA and ROB (Table 3). The experimental results showed that the size of the runoff plot is significant to the volume and intensity of generated surface runoff. The relationship between Simulated Rainfall (SR) and Surface Runoff (GR) from plots A and B showed a linear trend with the R2=0.993 and 0.994 at P<0.01 in Tables 4 and 5. Hence, it was deduced that increases in surface runoff are related to increases in rainfall intensities. This observation confirms the findings from other studies where high rainfall intensity increases runoff intensity and volume. The results in Figures 5, 6, and 7 showed the established mathematical relationship between the modeled surface runoff and simulated rainfall. Conversely, a strong relationship exists between the hydrological variables with R2=0.9926, 0.9942, and 0.9984 for the Modeled Surface Runoff (MROA), generated surface runoff (ROA), MROB and ROB, and Modeled Simulated Rainfall (MSR) and Simulated Rainfall (SR) for the plot A and B respectively.
| Model | R | R square | Adjusted R square | Std. error of the estimate | Change statistics | Durbin-watson | ||||
|---|---|---|---|---|---|---|---|---|---|---|
| R Square Change | F Change | df1 | df2 | Sig. F change | ||||||
| 1 | .996a | 0.993 | 0.991 | 2.17098 | 0.993 | 674.728 | 1 | 5 | 0 | 1.087 |
Table 4. Model summary for ROA.
| Model | R | R square | Adjusted R square | Std. error of the estimate | Change Statistics | Durbin-watson | ||||
|---|---|---|---|---|---|---|---|---|---|---|
| R square change | F change | df1 | df2 | Sig. F change | ||||||
| 1 | .997a | 0.994 | 0.993 | 3.25988 | 0.994 | 854.031 | 1 | 5 | 0 | 0.79 |
Table 5. Model summary for ROB.

Figure 5. Calibration of modeled and generated runoff in A.

Figure 6. Calibration of modeled and generated runoff in B

Figure 7. Calibration of modeled and generated rainfall
Understanding the mechanism of rainfall-runoff is significant to designing a robust Integrated Water Management Scheme (IWRS) and hydraulic structures for water conservation and erosion control. However, it is important to have a detailed characteristic of the rainfall-runoff relationship from the natural and artificial processes to build solid hydraulic models and similitudes. Hence, the application of a rainfall simulator is generally used to understand the surface flow, soil loss, infiltration processes, soil erodobility, and erosivity index. This study evaluated the response of various RIs (10.8 mm/hr, 12.6 mm/hr, 14.4 mm/hr, and 15.3 mm/hr) on the two bare runoff plots A and B on sandy loamy soil. The result of the field experiments showed that the first simulation attempt of rainfall intensity and volume of 10.8 mm/hr and 20.0 mm generated no surface runoff, the whole simulated rainfall was lost to infiltration, and the subsequent simulations generated a surface flow of varying volume, intensity, and runoff coefficient. The finding indicated that the generated surface runoff from the smaller runoff plot (B) of 0.50m2 is higher than the surface runoff plot of 0.72 m2 under the same rainfall intensity and equal gradient of inclination for runoff plots. The concentration-time for surface flow in plot A is higher than plot B by 13.2%. It required a longer period for the runoff to initiate and flow from the watershed in a large plot to the outlet compared to the smaller catchment plot. Conversely, the overall study’s result is very significant to developing a rainfall-runoff model capable of solving complex soil loss and erosion events.
Hydrology: Current Research received 2843 citations as per Google Scholar report