Research - (2021) Volume 10, Issue 7
Received: 08-Jun-2021
Published:
12-Jul-2021
, DOI: 10.37421/2169-026X.2021.10.317
Citation: Selvaraj N. "Electronic Waste Management - A Tamilnadu Perspective." J Entrepren Organiz Manag 10 (2021): 317.
Copyright: © 2021 Selvaraj N. This is an open-access article distributed under the terms of the Creative Commons Attribution License, which permits unrestricted use, distribution, and reproduction in any medium, provided the original author and source are credited.
The usage of electronic devices is increasing day by day. Developed and developing countries, both are equally responsible for generating E-waste. Technology has short span of life. It has no shelf life. Change in technology takes place quite often; therefore the older one becomes redundant and turns into waste when new version of technology is emerged. This leads to generation of E Waste on a massive scale. In the technical era, every day companies are finding new electronic items and accordingly satisfy consumer needs. Consumers also express their interest in buying the electronic goods immediately after the electronic goods are introduced in the market. To examine the various ways to solve E-Waste problems. To assess the impact of E-Waste management to the local communities. The ‘t’ test is used to find out the significant difference among the two group of samples regarding any intention variable which is internal scale. The cause and effect relationship between dependent and independent variables are carried out by the Multiple Regression Analysis. The aspects of harmful E-Waste for the environment, reasons of increasing E-Waste, Useful method of Disposal of E-Waste, ways to solve E-Waste problems and impact of E-Waste management to the local communities have been measured with the help of the variables drawn from previous studies. The regulations with regard to the management of E waste has to be simplified so that manufacturers, dismantlers, authorized recyclers and other related parties can perform better for effective and timely disposal.
Mandatory provision • Government provision • Sustainability provision • Company policy and legal provisions
In the 21st Century, the information and communication revolution has brought remarkable changes in the way we organize our lives. The development in communication and technology in India has a great impact on our economy, industries and life style of people. Initially, we dealt with record players, radios, VCRs and black-and-white televisions; followed by CD and DVD. Air conditioners, air coolers, cellular phones, refrigerators, computers, laptops, power bank and many other gadgets arrived in the Indian market and in the hands of common man. Electronics have become part of the throw away culture of developed countries. This is not an exception even in the developing countries. Electronic gadgets are meant to make our lives comfortable, happier and simpler, but they contain poisonous toxic substances, their disposal and recycling becomes a health nightmare. These have led to various problems including the problem of huge amount of hazardous waste and other wastes generated from electric products. Over the past two decades, the global market of Electrical and Electronic Equipment (EEE) continues to grow exponentially, while the life span of those products becomes shorter and shorter. Due to Rapid economic growth, urbanization and industrialization, demand for consumer goods, has been increased for both the consumption and the production of EEE. Any improperly disposed electronics can be classified as E-waste. E-waste basically comprises electronic goods that are not fit for their original use.
Need for the study The usage of electronic devices is increasing day by day. Developed and developing countries, both are equally responsible for generating E-waste. Technology has short span of life. It has no shelf life. Change in technology takes place quite often; therefore the older one becomes redundant and turns into waste when new version of technology is emerged. This leads to generation of E Waste on a massive scale. The existing management practices related to E-waste in India are poorly managed and have the potential to risk both human health as well as environment. Moreover, the policy level initiatives are not being implemented in an appropriate way. The study on this subject will definitely help in forming solid base for future research and detailed study on the subject. This material will also serve as the source of data for future study. As this is a relatively new research subject, the study conducted on this subject will help in better understanding of this subject and will also play a major role in developing the interest of concerned persons. This study will thus help in formulating appropriate measures for minimizing E-waste volume.
Statement of the problem In the technical era, every day companies are finding new electronic items and accordingly satisfy consumer needs. Consumers also express their interest in buying the electronic goods immediately after the electronic goods are introduced in the market. Due to the innovation in electrical and electronic companies, consumers frequently replace their existing equipment with new one. It creates lot of impact to the society in the name of E-waste. The consequences of E-waste are shocking. The nation now dumps between 300 million to 400 million electronic items per year, and less than 20 percent of that E-waste is recycled. The extreme amount of lead in electronics alone causes damage in the central and peripheral nervous systems, the blood and the kidneys. E waste related to computers end up in landfills. Only about two percent of PCs ever find their way to a second user. About 60 million cell phones are replaced worldwide a month and only 10percent are recycled. Flat panel computer monitors and notebooks often contain small amounts of mercury in the bulbs used to light them. Cathode ray tubes in older TVs. All this toxic elements are harmful to human health and environment.
Large volume of E-waste has been sent to countries such as China, India and Kenya, due to lower environmental standards and working conditions makes processing E-waste more profitable. Just 24 States have passed or proposed take-back laws. India is not an exception to E-waste issues. Developed countries are exporting their E-waste to developing countries like India and China. In India, Maharashtra state is leading in E-waste generation and Mumbai city of Maharashtra is the leading city among all the cities of India in E-waste generation.
Scope of the study The prime focus of the present study is the Consequences of E-Waste on human health and environment. It has further provided information regarding conceptual framework of E-waste. This study also revealed the impact of E-Waste on mankind and providing awareness to companies, its consequences and the suggestions of the public regarding disposal of E-waste in Tamilnadu.
Objectives of the study
The confined objectives of the present study are:
1. To examine the various ways to solve E-Waste problems.
2. To assess the impact of E-Waste management to the local communities.
3. To offer suggestions for improving the E-Waste management and its business opportunities on the basis of findings of the study.
Research methodology is a scientific and systematic way to solve research problems. The research methodology deals with research methods and taken into consideration the logic behind the methods. In total, the research methodology of the study includes research design, sampling framework, data collection, framework of analysis and limitations.
Research design of the study
Research design is the conceptual structure within which the research is conducted. It is a blue print for the collection, management and analysis of the data. The research design in the present study is descriptive in nature since it describes the phenomena of socio economic implications of E-Waste Management and its Business Opportunities at tamilnadu. Apart from this, the present study has its own objectives and pre-determined methodology. It is purely descriptive in nature.
Sampling framework of the study
The sampling framework of the study consists of determination of sample size and sampling procedure of the study.
Correlation coefficient
The most familiar measure of dependence between two quantities is the Pearson product-moment correlation coefficient, or "Pearson's Correlation." It is obtained by dividing the covariance of the two variables by the product of their standard deviations. Karl Pearson developed the coefficient from a similar but slightly different idea by Francis Galton.
The population correlation coefficient ρX,Y between two random variables X and Y with expected values μX and μY and standard deviations σX and σY is defined as:
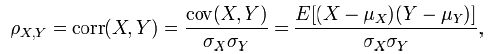
Where E is the expected value operator, cov means covariance, and, corr a widely used alternative notation for Pearson's correlation.
The Correlation Co-efficient has been applied on relationship among dimensions of harmful e-waste for the environment and relationship among dimensions of ways to solve E-waste problems.'
T-Test
The ‘t’ test is used to find out the significant difference among the two group of samples regarding any intention variable which is internal scale. The ‘t’ statistics is calculated by
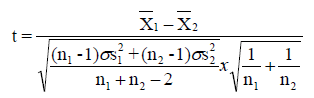
Degree of freedom of (n1 + n2– 2)
Whereas t– ‘t’ statistics
X1 – Mean of the first sample
X2 – Mean of the second sample
σ12 – Variance in the first sample
σ22– Variance in the second sample
n1 – Number of samples in first group
n2 – Number of samples in second group
In the study, the ‘t’ test has been used to find out the significant difference between general public gender, marital status and family type with respect to harmful E-Waste for the environment, reasons of increasing E-Waste, useful method of disposal of E-Waste, ways to solve E-Waste problems, and Impact of E-Waste Management to the Local Communities among the socio economic implications of E-Waste management and its business opportunities in Tamilnadu.
To find out the significant difference between E-Waste Companies educational Qualification with respect to problems in handling the E-Waste, treatment and disposal options and Impact of E-Waste Management to the Local Communities among the socio economic implications of E-Waste management and its business opportunities in Tamilnadu.
The general form of the regression model is:
Y=a + b1 X1+ b2 X2+ ………… + bnXn + e
Where
Y= Dependable Variable
X1, X2, …..Xn= Independent Variables
b1, b2,……, bn= Regression Coefficient of Independent variables
a = Constant; and
e= Error Team
In this study, the multiple regression analysis has been used to find out the impact of various dimensions of ways to solve E-Waste problems on Impact of E-Waste management to the local communities.
Limitations of the study
The aspects of harmful E-Waste for the environment, reasons of increasing E-Waste, Useful method of Disposal of E-Waste, ways to solve E-Waste problems and impact of E-Waste management to the local communities have been measured with the help of the variables drawn from previous studies.
Borthakur A and Singh P [1] described that developing countries are facing enormous challenges related to the generation and management of E-waste which are either internally generated or imported illegally; India is no exception to it. However, the existing management practices related to E-waste in India are reasonably poor and have the potential to risk both human health and the environment. Moreover, the policy level initiatives are not being implemented in an appropriate way. The austere problem of E-waste along with its policy level implications is looked upon in the paper. It has been found that there is an urgent need to address the issues related to E-waste in India in order to avoid its detrimental future consequences.
Vats MC and Singh SK [2] described that how compatible infrastructure for E-waste treatment is limited in India and informal recycling survived under the ambit of flexible legislative framework. The presence of toxic and hazardous substances in E-wasted equipment attracted the attention of the waste managing agencies in the country because these substances endanger the human health, environment, wherever present in uncontrolled conditions. The existence and implementation of Environmentally Sound Management is partial and progressing very slowly due to obvious reasons. The formal recyclers have commissioned comprehensive E-waste treatment facilities; but inadequate in proportion to the E-waste generation in the country since the informal recyclers are treating 95percent of the E-waste generated with hazardous practices. The formal E-waste collection from all sources is ambiguous. E-waste contains a good amount of valuable recyclable materials also and has potential to become lucrative business in the country.
Jayapradha A discussed the scenario of E-waste in India and some new recycling approaches and technology for the proper management of E-waste, thereby discarding into environment is either nil or minimal. They also focused on the health hazards of E-waste and various management methods for handling this hazardous waste [3]. Thus finding a sustainable solution for handling the mass volume of E-waste generated without creating an impact to the environment and public health is the need of the hour. They also explained that the E-waste management which is a colossal task in developing countries like India and is more complicated due to the lack of stringent rules and regulation for monitoring the large quantity of E-waste getting generated. Providing proper infra-structure for processing the E-waste and starting an effective training program for innovative recycling & recovery methods and for their use of E-waste will strengthen the future generation technically to solve the burning issue. An effective take-back program providing incentives for producers to design products that uses less toxic materials thereby reducing the resource, and also design products that are easier to disassemble, reuse, and recycle may help in reducing the wastes. Most of the E-waste finds its way to the unorganized sector with profit as the prime motivating factor, hence technical improvements of informal recycling processes coupled with proper training in handling waste electrical and electronic equipment’s has to be offered to the local industry and community so to obtain better environmental performance without sacrificing the economic and social benefits. Thus handling of E-waste undeniably requires better management and improved working environment guided by strict regulations [4].
Relationship among dimensions of harmful E-waste for the environment
In this study Harmful E-Waste for the Environment consists of five that measure Very High Harmful E-waste, Highly Harmful E-waste, Moderately Harmful E-waste, Harmful E-waste and Extremely Harmful E-waste.
Ho: There is no relationship among various dimensions of Harmful E-Waste for the Environment.
From the Table 1 it can infer that the correlation coefficient for Harmful E-Waste for the Environment is strong and positive. It can be concluded that Very High Harmful E-waste has positive and strong relation with Highly Harmful E-waste (25.5%), Moderately Harmful E-waste (15.4%), Harmful E-waste (2.9%) and Extremely Harmful E-waste (2.8%).
| Harmful E-Waste for the Environment | Very High Harmful E-waste | Highly Harmful E-waste | Moderately Harmful E-waste | Harmful E-waste | Extremely Harmful E-waste |
|---|---|---|---|---|---|
| Very High Harmful E-waste |
1.000 | 0.255** | 0.154** | 0.029 | -0.028** |
| Highly Harmful E-waste |
1.000 | 0.222** | 0.228** | 0.204 | |
| Moderately Harmful E-waste |
1.000 | 0.207** | 0.287** | ||
| Harmful E-waste |
1.000 | 0.589** | |||
| Extremely Harmful E-waste |
1.000** | ||||
| **Correlation is significant at the 0.01 level (2-tailed). | |||||
Highly Harmful E-waste has positive and strong relation with Moderately Harmful E-waste (22.2%), Harmful E-waste (22.8%) and Extremely Harmful E-waste (20.4%).
Moderately Harmful E-waste has positive and strong relation with Harmful E-waste (20.7%) and Extremely Harmful E-waste (28.7%).
Harmful E-waste has positive and strong relation with Extremely Harmful E-waste (58.9%).
Relationship among dimensions of ways to solve Ewaste problems
In this study Ways to Solve E-Waste Problems consists of five that measure Mandatory provision, Government provision, Sustainability provision, Company policy and legal provisions and Company responsibility on E-Waste.
Ho: There is no relationship among various dimensions of Ways to Solve E-Waste Problems.
From the Table 2 it can infer that the correlation coefficient for Ways to Solve E-Waste Problems. It can be concluded that Mandatory provision has positive and strong relation with Government provision (41.9%), Sustainability provision (13.8%), Company policy and legal provisions (6.9%) and Company responsibility on E-Waste (2.2%).
| Ways to Solve E-Waste Problems | Mandatory provision | Government provision | Sustainability provision | Company policy and legal provisions | Company responsibility on E-Waste |
|---|---|---|---|---|---|
| Mandatory provision | 1.000 | 0.419** | 0.138** | 0.069 | 0.022** |
| Government provision | 1.000 | 0.380** | 0.328** | 0.229 | |
| Sustainability provision | 1.000 | 0.578** | 0.386** | ||
| Company policy and legal provisions | 1.000 | 0.521** | |||
| Company responsibility on E-Waste | 1.000** | ||||
| **Correlation is significant at the 0.01 level (2-tailed). | |||||
Government provision has positive and strong relation with Sustainability provision (38%), Company policy and legal provisions (32.8%) and Company responsibility on E-Waste (22.9%).
Sustainability provision has positive and strong relation with Company policy and legal provisions (57.8%) and Company responsibility on E-Waste (38.6%).
Company policy and legal provisions has positive and strong relation with Company responsibility on E-Waste (52.1%).
Impact of various dimensions of ways to solve E-waste problems on impact of E-waste management to the local communities
Regression is the determination of statistical relationship between two or more variables. In simple regression two variables are used. One variable (independent) is the cause of the behavior of another one (dependent). When there are more than two independent variables the analysis concerning relationship is known as multiple correlations and the equation describing such relationship is called as the multiple regression equation. Regression analysis is concerned with the derivation of an appropriate mathematical expression is derived for finding values of a dependent variable on the basis of independent variable. It is thus designed to examine the relationship of a variable Y to a set of other variables X1, X2, X3………….Xn. the most commonly used linear equation in Y=b1 X1 + b2 X2 +……+ bnXn + b0
Here Y is the dependent variable, which is to be found. X1, X2,… and Xn are the known variables with which predictions are to be made and b1, b2,….bn are coefficient of the variables.
In this study, the dependent variable is Impact of E-Waste Management to the Local Communities; Independent variables are service quality they are Mandatory provision, Government provision, Sustainability provision, Company policy and legal provisions, Company responsibility on E-Waste and comfort are discussed as follows:
• Dependent Variable – Impact of E-Waste Management to the Local Communities (y)
• Independent Variable
i. Mandatory provision (X1)
ii. Government provision (X2)
iii. Sustainability provision (X3)
iv. Company policy and legal provisions (X4)
v. Company responsibility on E-Waste (X5)
• Multiple R value: 0.779
• R Square value: 0.635
• Adjusted R square value: 0.628
• F value: 60.738
• P value: 0.000
The multiple correlation coefficient is 0.779 measures the degree of relationship between the actual values and the predicted values of the Impact of E-Waste Management to the Local Communities. Because the predicted values are obtained as a linear combination of Mandatory provision (X1), Government provision (X2), Sustainability provision (X3), Company policy and legal provisions (X4), Company responsibility on E-Waste (X5) and Comfort (X6) the coefficient value of 0.779 indicates that the relationship between Impact of E-Waste Management to the Local Communities and the six independent variables is quite strong and positive (Table 3).
| Variables | Unstandardized Coefficients(B) | S.E error of B | Standardized Coefficients Beta |
t-value | p-value |
|---|---|---|---|---|---|
| Constant | .331 | .228 | ----------- | 1.452 | .147 |
| Mandatory provision | .102 | .037 | .134 | 2.773 | .006** |
| Government provision | .182 | .052 | .174 | 3.508 | .000** |
| Sustainability provision | .060 | .046 | .055 | 1.308 | .191 |
| Company policy and legal provisions | .198 | .067 | .161 | 2.929 | .004** |
| Company responsibility on E-Waste | .785 | .083 | .586 | 9.466 | .000** |
| Comfort | .003 | .050 | .003 | .058 | .954 |
| Note: ** Denotes significant at 1% level * Denotes significant at 5% level |
|||||
The Coefficient of determination R-square measures the goodness-of-fit of the estimated Sample Regression Plane (SRP) in terms of the proportion of the variation in the dependent variables explained by the fitted sample regression equation. Thus, the value of R square is 0.635 simply means that about 63.5% of the variation in Impact of E-Waste Management to the Local Communities is explained and R square value is significant at 1% level.
The multiple regression equation is:
Y= 0.331 + 0.102 X1+ 0.182 X2 + 0.060 X3 + 0.198 X4 + 0.785 X5
Here the coefficient of X1 is 0.102 represents the partial effect of Mandatory provision on Impact of E-Waste Management to the Local Communities, holding the other variables as constant. The estimated positive sign implies that such effect is positive that Impact of E-Waste Management to the Local Communities would increase by 0.102 for every unit increase in Mandatory provision and this coefficient value is significant at 1% level. The coefficient of X2 is 0.182 represents the partial effect of Government provision on Impact of E-Waste Management to the Local Communities, holding the other variables as constant. The estimated positive sign implies that such effect is positive that Impact of E-Waste Management to the Local Communities would increase by 0.182 for every unit increase in Government provision and this coefficient value is significant at 1% level. The coefficient of X3 is 0.060 represents the partial effect of Sustainability provision on Impact of E-Waste Management to the Local Communities, holding the other variables as constant. The estimated positive sign implies that such effect is positive that Impact of E-Waste Management to the Local Communities would increase by 0.060 for every unit increase in Sustainability provision and this coefficient value is not significant at 1% level. The coefficient of X4 is 0.198 represents the partial effect of Company policy and legal provisions on Impact of E-Waste Management to the Local Communities, holding the other variables as constant. The estimated positive sign implies that such effect is positive that Impact of E-Waste Management to the Local Communities would increase by 0.198 for every unit increase in Company policy and legal provisions and this coefficient value is significant at 1% level. The coefficient of X5 is 0.785 represents the partial effect of Company responsibility on E-Waste on Impact of E-Waste Management to the Local Communities, holding the other variables as constant. The estimated positive sign implies that such effect is positive that Impact of E-Waste Management to the Local Communities would increase by 0.785 for every unit increase in Company responsibility on E-Waste and this coefficient value is significant at 1% level.
Based on standardized coefficient, Company responsibility on E-Waste (0.586), Government provision (0.174), Company policy and legal provisions (0.161) is the most important factors to extract Impact of E-Waste Management to the Local Communities, followed by Mandatory provision (0.134) and Sustainability provision (0.055).
Government provision has positive and strong relation with Sustainability provision (38%), Company policy and legal provisions (32.8%) and Company responsibility on E-Waste (22.9%). Sustainability provision has positive and strong relation with Company policy and legal provisions (57.8%) and Company responsibility on E-Waste (38.6%). Company policy and legal provisions has positive and strong relation with Company responsibility on E-Waste (52.1%). The Coefficient of Determination R-square measures the goodness-of-fit of the estimated Sample Regression Plane (SRP) in terms of the proportion of the variation in the dependent variables explained by the fitted sample regression equation. Thus, the value of R square is 0.635 simply means that about 63.5% of the variation in Impact of E-Waste Management to the Local Communities is explained and R square value is significant at 1% level.
1. The regulations with regard to the management of E waste has to be simplified so that manufacturers, dismantlers, authorized recyclers and other related parties can perform better for effective and timely disposal.
2. Government should bring informal sector in to formal system and give them adequate infrastructure and safety measures for recycling and also increase the accountability of this sector.
3. Government should set up regulatory agencies in each district, which are vested with the responsibility of coordinating and consolidating the functions of the various government authorities regarding hazardous substances.
Waste management strategies are largely technical and focused on environmental aspects, leaving out underlying social problems and relevant solutions. The lack of public awareness regarding the disposal of electronic goods and inadequacy of policies to handle the issues related to E-waste enhance the problem in India. While the Government and the industry are unanimous on the view that E-waste needs to be efficiently managed from a social and environmental standpoint, there still is a need for them to mutually arrive at a consensus by understanding the practical and cultural realities on ground. Unless the informal sector is formalized or made to be part of a defined E-waste supply chain, it will automatically defeat the very purpose of what the Government and industry intend to achieve.
The present study was confined only to the consumers and E-waste management companies in Tamilnadu. An extended research work can be followed to study the marketing problems of E-waste management companies’ employees only. There is a scope of detailed study on scientific and technical aspect of E-waste arising from electrical and electronic products. A future study can be on functioning of all E-waste management companies of India. There is a scope of a comparative study of effective E-waste practices followed by India and other countries.
Entrepreneurship & Organization Management received 1115 citations as per Google Scholar report