Research Article - (2020) Volume 0, Issue 0
Received: 04-Nov-2020
Published:
30-Nov-2020
Citation: Yang, Shieh-Yueh, Heui-Chun Liu, Chin-Yi Lin and Ming-Jang Chiu, et al. “Development of Assaying Plasma TDP-43 Utilizing Immunomagnetic Reduction.” J Neurol Disord 8 (2020): 443.
Copyright: © 2020 Yang SY, et al. This is an open-access article distributed under the terms of the Creative Commons Attribution License, which permits unrestricted use, distribution, and reproduction in any medium, provided the original author and source are credited.
TDP-43 is a promising biomarker for frontotemporal dementia (FTD) and amyotrophic lateral sclerosis (ALS). However, studies on TDP-43 in human biofluid are rare. In this work, the authors utilized an ultrasensitive technology, called immunomagnetic reduction (IMR), to develop the reagent for assaying TDP-43. The preclinical performance characteristics of the TDP-43 reagent, such as the standard curve, detection limits, assay linearity, dilution recovery range, assay reproducibility, spike recovery, reagent stability, and interference tests, were explored according to the CLSI guidelines. Plasma samples from normal controls (NC, n = 27) and from patients with frontotemporal dementia (FTD, n = 9), Alzheimer’s disease (AD, n = 34) and Parkinson’s disease (PD, n = 10) were collected for TDP-43 assays using the IMR TDP-43 reagent. The low-detection limit of assaying TDP-43 was 0.68 fg/ml, and the upper-detection limit was 100 pg/ml. There was no significant interference effect when assaying TDP-43 mixed with hemoglobin, bilirubin, intralipid, albumin, etc. The FTD patients had significantly higher levels of plasma TDP-43 (0.419 ± 0.193 pg/ml ) compared to the NC subjects (0.163 ± 0.097 pg/ml ), AD patients (0.165 ± 0.082 pg/ml ) and PD patients (0.069 ± 0.068 pg/ml ). Through analysis of the ROC curve, the cut-off value of plasma TDP-43 for discriminating FTD from the other patient groups was 0.237 pg/ml, which resulted a clinical sensitivity of 0.889 and a specificity of 0.831. These results demonstrate the feasibility of assaying plasma TDP-43 to specifically identify FTD.
Frontotemporal dementia • Plasma biomarkers • TDP-43 • Immunomagnetic reduction.
The clinical diagnosis of neurodegenerative diseases usually relies on the opinions of experienced neurologists, which often causes diagnostic delays in clinical practice or suppresses the accurate enrollment of subjects in drug trials. An objective and rapid diagnosis for neurodegenerative diseases is needed. An assay of biomarkers in biofluid could be a candidate.
It is known that biomarkers must be pathologically and therapeutically related to the diseases of interest, e.g., amyloid β (Aβ), tau protein (Tau) and neurofilament light protein (NfL) are related to Alzheimer’s disease (AD) [1-5], and α-synuclein is related to Parkinson’s disease (PD) [6-8]. Many papers have shown the feasibility of assaying Aβ, Tau, NfL, or α-synuclein in the cerebrospinal fluid (CSF) or plasma to differentiate AD or PD from normal controls. Moreover, the levels of biomarkers in biofluid in patients with AD or PD have been correlated with neuroimaging, such as positron emission tomography or magnetic resonance imaging. These results validate the clinical significance of biofluid biomarkers for precisely determining AD or PD. With these advances, researchers have focused on assaying biomarkers in biofluid for other types of neurodegenerative diseases.
TAR DNA-binding protein (TDP-43), discovered in 2006 [9], is a pathological hallmark for almost 50% of frontotemporal dementia (FTD) and amyotrophic lateral sclerosis (ALS) [10-13]. TDP-43 is a nuclear protein with 414 amino acids and a molecular weight of 44.7 kDa. It plays a role in nuclear transcription in relation to alternative splicing or exon skipping [14,15]. TDP-43 is also a key component in RNA transport granules and plays an important role in regulating local translation at distal locations. It has been reported that the hyperphosphorylation, ubiquitination or C-terminal truncation of TDP-43 increases the aggregation of TDP-43 in the cytoplasm in FTD and ALS patients [9,16-18]. Thus, TDP-43 is a promising biomarker for FTD and ALS [11,19].
However, studies on TDP-43 in human biofluid are rare. The results of exploring TDP-43 concentrations in cerebrospinal fluid (CSF) or plasma in patients with FTD are not consistent and have depended on the assay technologies, the antibodies, the signal reading technologies, sample preparation and so on [20-25]. In this work, the authors utilized an ultrasensitive technology, called immunomagnetic reduction (IMR) [26-29], to develop reagents for assaying TDP-43. In addition to investigating the preclinical performance of the TDP-43 reagent, the feasibility of discriminating FTD from normal controls, AD and PD using the reagent to assay the TDP-43 levels in human plasma is examined [30-33].
Synthesis of TDP-43 reagent
Antibodies (GTX630196, Genetex) against TDP-43 were immobilized onto dextran-coated magnetic Fe3O4 nanoparticles (MF-DEX-0060, MagQu) by following the processes reported in Ref. 30. NaIO4 solution is used to oxidize dextran to create aldehyde groups (-CHO). Antibodies reacted with oxidized dextran via the link of -CH=N-. The unbound antibodies were removed from the solution through magnetic separation. Magnetic nanoparticles with antibodies were dispersed in phosphate-buffered saline (PBS) buffer (1x). The concentration of the TDP-43 reagent was 10 mg Fe/ml. By using laser dynamic scattering, the mean diameter of the magnetic nanoparticles with antibodies was measured as approximately 55 nm. The reagent was stored at 4ºC.
IMR measurement
An IMR analyzer (XacPro-S, MagQu) was used to measure the IMR signals of a sample. For each measurement, 60-μl of reagent was mixed with a 60-μl sample. Duplicate measurements were performed for each sample. For each batch of IMR measurements, two control solutions were used. One was blank, i.e., PBS solution, the other was 1-pg/ml TDP-43 (AP-190, R&D) in PBS solution. To explore the preclinical performance of the TDP-43 reagent, several characteristics, such as the standard curve, detection limit, assay linearity, dilution recovery range, assay reproducibility, spike recovery, reagent stability, and interference tests, were investigated. The investigations were performed according to the global standardizations described by the Clinical & Laboratory Standards Institute (CLSI). The document numbers of the guidelines are EP5- A3, EP7-A2, EP17-A2, and C28-A2. Thus, the preclinical performance of the TDP-43 reagent with IMR could be globally applied to clinical chemistry and laboratory medicine.
Enrollment of subjects
All subjects were enrolled at National Taiwan University Hospital with the approval of the ethics committees of the hospital. All participants provided written informed consent. Each subject was identified as a normal control (NC), a patient with Alzheimer’s disease (AD), a patient with Parkinson’s disease (PD) or a patient with frontotemporal dementia (FTD) according to the inclusion and exclusion criteria listed in Table 1.
| Group | Inclusion criteria | Exclusion criteria |
|---|---|---|
| NC | 1. Education: at least primary school 2. Age > 50 years 3. Body weight ≥ 40 kg 4. CDR* = 0 5. MMSE++ ≥ 26 |
1. Subjects with cranial metallic implants, cardiac pacemakers or claustrophobia. 2. Previous diagnosis of MCI or dementia 3. Significant history of depression 4. Geriatric Depression Scale > 8 |
| aMCI | 1. Subjects must meet the 2011 NIA-AA diagnostic guidelines for MCI due to AD based on memory impairment tested by WEMS-III+ and a score for any subtest below the 4th percentile and must be maintaining normal activities of daily living [31]. 2. Subjects must have MMSE scores between 24 and 28 and CDR = 0.5. |
1. Subjects with cranial metallic implants, cardiac pacemakers or claustrophobia. 2. Significant history of depression 3. Geriatric Depression Scale > 8 |
| AD | 1. Subjects must meet the 2011 NIA-AA diagnostic guidelines for probable AD dementia [31]. 2. Subjects must have MMSE scores between 10 and 22 and CDR = 0.5 or 1. |
|
| FTD | 1. Subjects must meet the diagnostic guideline for frontotemporal lobe degeneration (mainly primary progressive aphasia) [32] 2. CDR = 0.5 or 1 |
|
| PD | 1. Subjects must have symptoms of bradykinesia and at least one of the following: muscular rigidity, rest tremor (4-6 Hz), or postural instability unrelated to primary visual, cerebellar, vestibular or proprioceptive dysfunction [33]. 2. Three or more of the following symptoms: unilateral onset, resting tremor, progressive disorder, persistent asymmetry most affecting the side of onset, excellent response to levodopa, severe levodopa-induced chorea, levodopa response for over 5 years, and clinical course of over 10 years. 3. MOCA# score greater than 26 for PD-NC 4. MOCA score less than 21 for PD with dementia |
1. Significant history of depression 2. History of repeated strokes with stepwise progression, repeated head injury, antipsychotic or dopamine-depleting drugs, definite encephalitis and/or oculogyric crises on no drug treatment, negative response to large doses of levodopa (if malabsorption was excluded), strictly unilateral features after 3 years, other neurological features (supranuclear gaze palsy, cerebellar signs, early severe autonomic involvement, Babinski sign, early severe dementia with disturbances of language, memory or praxis), exposure to a known neurotoxin, or presence of cerebral tumor or communicating hydrocephalus on neuroimaging. |
Preparation of plasma samples
A 9 ml or 6 ml K3 EDTA lavender-top tube was used for a blood draw with each enrolled subject. Fasting was not necessary for the blood draw. Blood samples were centrifuged at 1500 - 2500 g at room temperature for 15 minutes. Plasma was collected and aliquoted into cryotubes (0.5 ml aliquots) and stored at -20ºC. The plasma was frozen within 3 hours after the blood draw. Each frozen plasma aliquot was placed in wet ice and positioned at room temperature for IMR measurement.
Statistical method
Continuous variables for each measurement are presented as the means ± standard deviations. Continuous variables were compared using a t-test, and p-values were determined. Pearson correlation r was performed with GraphPad Prism.
Hook effect on the assay
Spiked TPD-43 (AP-190, R&D) in phosphate buffered saline (PBS) solutions with various concentrations of TDP-43 were used for the IMR measurements. The TDP-43 concentrations ranged from 0.001 to 1000 pg/ ml. The IMR signals of these TDP-43 solutions are plotted in Figure 1. The error bar associated with each data point in Figure 1 was generated from duplicate measurements. Stronger IMR signals, IMR (%), were obtained for higher TDP-43 concentrations. However, the IMR signal for the 10000-pg/ml TDP-43 solution (4.48%) was the same as that for the 1000-pg/ml TDP-43 solution. This might imply that the Hook effect occurred at approximately 10000 pg/ml of TDP-43 solution. Therefore, the IMR signals in Figure 1 for TDP-43 concentrations from 0.001 pg/ml to 1000 pg/ml were used for exploring the analytic relationship that follows the logistic function-
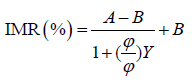 (1)
(1)
where A, B, φo and γ are fitting parameters, and φ is the concentration of TDP-43. By fitting the TDP-43 concentration-dependent IMR signals in Figure 1 to Eq. (1), the parameters are found to be A = 2.89, B = 4.55, γ = 0.57 and φo = 4.32. The fitted logistic function is depicted by the solid line in Figure 1. As the fitted logistic function was extrapolated from 1000 to 10000 pg/ml, the measured IMR signal at 1000 pg/ml TDP-43 was below the fitted logistic function. This evidence indicates that the Hook effect occurs at 10000 pg/ml when assaying TDP-43.

Figure 1. Relationship between IMR (%) and spiked TDP-43 concentrations in PBS solution.
Assay detection limit
The guidelines for evaluating the detection capacity of clinical laboratory measurement procedures (i.e., limit of blank and detection) are described in CLSI EP17-A2. The limit of blank (LoB) was established first, then the limit of detection (LoD) was determined. The LoB was established by finding the appropriate percentile (p) value of the ranked measured concentrations for blank samples; in this case, p = 0.95:
LoB = Results at position [0.95 × NB + 0.5], (2)
where NB = 60 (NB is the number of trials) in this case. Equation (2) becomes
LoB = Results at position 57.5 (3)
Linear interpolation was performed using the 57th and 58th ranked measured concentrations. The 60 measured concentrations for PBS samples (blank samples) that were not spiked with TDP-43 are ranked in Table 2. The 57.5th ranked measured concentration was 0.529 fg/ml. Thus, the LoB for using the IMR TDP-43 reagent to assay TDP-43 was 0.529 fg/ml.
The limit of detection (LoD) was calculated via
LoD = LoB +1.65σS, (4)
Where, σS denotes the standard deviation of the measured TDP-43 concentrations of TDP-43 solutions at a given spiked TDP-43 concentration (e.g., 1.0 fg/ml in this work) in PBS. The measured TDP-43 concentrations of 60 TDP-43 solutions are listed in Table 3. The mean value of the 60 measured concentrations was 0.922 fg/ml. The σS of the 60 measured concentrations was 0.091 fg/ml. The LoD for assaying TDP-43 using IMR was 0.679 fg/ml via Eq. (4).
| Rank | Measured concentration (fg/ml) | Rank | Measured concentration (fg/ml) |
|---|---|---|---|
| 1 | -2.64 | 31 | -0.17 |
| 2 | -2.64 | 32 | -0.12 |
| 3 | -2.47 | 33 | -0.08 |
| 4 | -2.30 | 34 | -0.08 |
| 5 | -2.30 | 35 | -0.04 |
| 6 | -2.30 | 36 | -0.04 |
| 7 | -2.30 | 37 | -0.02 |
| 8 | -2.13 | 38 | -0.02 |
| 9 | -1.81 | 39 | -0.02 |
| 10 | -1.81 | 40 | 0.00 |
| 11 | -1.66 | 41 | 0.00 |
| 12 | -1.52 | 42 | 0.00 |
| 13 | -1.38 | 43 | 0.00 |
| 14 | -1.38 | 44 | 0.00 |
| 15 | -1.38 | 45 | 0.02 |
| 16 | -1.25 | 46 | 0.02 |
| 17 | -1.25 | 47 | 0.08 |
| 18 | -1.12 | 48 | 0.08 |
| 19 | -1.12 | 49 | 0.13 |
| 20 | -1.12 | 50 | 0.13 |
| 21 | -1.12 | 51 | 0.19 |
| 22 | -0.74 | 52 | 0.25 |
| 23 | -0.64 | 53 | 0.25 |
| 24 | -0.54 | 54 | 0.25 |
| 25 | -0.46 | 55 | 0.40 |
| 26 | -0.46 | 56 | 0.48 |
| 27 | -0.46 | 57 | 0.48 |
| 28 | -0.37 | 58 | 0.58 |
| 29 | -0.23 | 59 | 0.58 |
| 30 | -0.23 | 60 | 0.68 |
| Rank | Measured concentration (fg/ml) | Rank | Measured concentration (fg/ml) | |
|---|---|---|---|---|
| 1 | 1.00 | 31 | 1.00 | |
| 2 | 1.03 | 32 | 1.03 | |
| 3 | 0.90 | 33 | 0.90 | |
| 4 | 0.86 | 34 | 0.86 | |
| 5 | 0.86 | 35 | 0.86 | |
| 6 | 0.83 | 36 | 0.83 | |
| 7 | 0.86 | 37 | 0.86 | |
| 8 | 0.88 | 38 | 0.88 | |
| 9 | 1.03 | 39 | 1.03 | |
| 10 | 1.07 | 40 | 1.07 | |
| 11 | 0.98 | 41 | 0.98 | |
| 12 | 0.91 | 42 | 0.91 | |
| 13 | 0.98 | 43 | 0.98 | |
| 14 | 0.91 | 44 | 0.91 | |
| 15 | 0.80 | 45 | 0.80 | |
| 16 | 0.88 | 46 | 0.88 | |
| 17 | 0.90 | 47 | 0.90 | |
| 18 | 0.86 | 48 | 0.86 | |
| 19 | 0.83 | 49 | 0.83 | |
| 20 | 0.91 | 50 | 0.91 | |
| 21 | 1.00 | 51 | 1.00 | |
| 22 | 0.88 | 52 | 0.88 | |
| 23 | 0.91 | 53 | 0.91 | |
| 24 | 0.90 | 54 | 0.90 | |
| 25 | 0.86 | 55 | 0.86 | |
| 26 | 0.96 | 56 | 0.96 | |
| 27 | 0.88 | 57 | 0.88 | |
| 28 | 0.91 | 58 | 0.91 | |
| 29 | 0.81 | 59 | 0.81 | |
| 30 | 0.93 | 60 | 0.93 |
Assay linearity
The range of assay linearity was evaluated by comparing the measured TDP-43 concentration converted from the measured IMR signal, denoted with φTDP-43-IMR, to the spiked TDP-43 concentration φTDP-43 in PBS samples. The acceptance criteria of the slope and the coefficient of determination in the TDP- 43-IMR-φTDP-43 curve were 0.9~1.1 and ≥ 0.95, respectively. Figure 2 plots the φTDP-43-IMR-φTDP-43 curve. The slope of the curve (gray dashed line) using the data points from 0.0001 to 1000 pg/ml was found to be 1.10, which is the upper limit of acceptance criteria. However, the data point at 0.0001 pg/ml obviously deviates from the linear curve. This implies that the data point at 0.0001 pg/ml should not be included when evaluating the assay linearity. The linear curve for the data points from 0.001 to 1000 pg/ml is plotted with the dot line. The slope was obtained as 1.10, which is also the upper limit of acceptance criteria. The linear curve from 0.001 to 100 pg/ml is plotted with the solid line, whose slope is 0.94; the coefficient of determination (R2) is 0.9999. Hence, conservatively, the analytical measurement range for assaying TDP-43 using the IMR TDP-43 reagent spans from 0.001 to 100 pg/ml.

Figure 2. Linearity between measured TDP-43 concentrations and spiked TDP-43 concentrations in PBS solution.
Dilution recovery range
A TDP-43 solution with a known concentration (9.96 pg/ml) measured with IMR was diluted by factors of 2, 5, 10, 20, 50 and 100 with PBS solution. The expected TDP-43 concentrations of these diluted solutions were determined to be 4.98, 1.99, 1.00, 0.50, 0.20 and 0.10 pg/ml, respectively. The measured TDP-43 concentrations of these diluted solutions were assayed using the IMR TDP-43 reagent, as listed in Table 4. The dilution recovery was determined via-
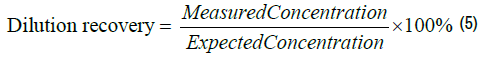
The dilution recoveries are listed in the right-most column of Table 4. The recoveries for TDP-43 solutions diluted at 1:2, 1:5, 1:10, 1:20, 1:50 and 1:100 ranged from 96.4% to 108.1%, which are within the acceptable dilution recovery range from 90% to 110%. According to the experimental results in Table 3, the sample used for the IMR TDP-43 assay should not be diluted more than 100 times.
| Dilution factor | Expected concentration (pg/ml) | Measured concentration (pg/ml) | Dilution recovery |
|---|---|---|---|
| 2x | 4.98 | 5.31 | 106.6% |
| 5x | 1.99 | 2.15 | 108.1% |
| 10x | 1.00 | 1.07 | 107.0% |
| 20x | 0.50 | 0.53 | 105.5% |
| 50x | 0.20 | 0.19 | 96.4% |
| 100x | 0.10 | 0.10 | 100.4% |
Assay reproducibility
By following the CCLS EP5-A3: Approved Guidelines for Evaluation of Precision Performance of Quantitative Measurement Methods, the reproducibility of assaying TDP-43 with IMR was tested. The TDP-43 solutions were measured precisely in one run. Two sequential measurements containing two duplicate measurements each were regarded as two runs: Run1 and Run2. Two different and unknown TDP-43 concentrations were used for the tests of reproducibility. The measured TDP-43 concentrations φTDP-43-IMR using the IMR TDP-43 reagent are listed in Table 5 for TPD-43-PBS sample 1 and in Table 6 for TDP-43-PBS sample 2. The mean concentrations of TPD-43-PBS were 0.101 pg/ml for TDP-43-PBS sample 1 and 1.02 pg/ml for TDP-43-PBS sample 2. Following the statistical method described in the CCLS EP5-A3 guidelines, an analysis of the results in Tables 5 and 6 yielded the within-lab precision and standard deviations of repeatability, which are shown in Table 7. The imprecision (%CV) of assaying TDP-43 using the IMR TDP-43 reagent was less than 15%.
| Run 1 | Run 2 | ΔMean | Mean (pg/ml) | ||||||||||
|---|---|---|---|---|---|---|---|---|---|---|---|---|---|
| Day | Date | Result 11 Â (pg/ml) | Result 12 Â (pg/ml) | Mean 1 Â (pg/ml) | ΔResult 1 | Day | Date | Result 21 Â (pg/ml) | Result 22 Â (pg/ml) | Mean 2 | ΔResult 2 | ||
| 1 | 2019/6/12 | 0.100 | 0.105 | 0.103 | 0.00002 | 2 | 2019/6/13 | 0.102 | 0.097 | 0.100 | 0.00002 | 0.00001 | 0.101 |
| 3 | 2019/6/18 | 0.099 | 0.102 | 0.101 | 0.00001 | 4 | 2019/6/26 | 0.104 | 0.104 | 0.104 | 0.00000 | 0.00001 | 0.102 |
| 5 | 2019/6/27 | 0.100 | 0.106 | 0.103 | 0.00004 | 6 | 2019/7/1 | 0.100 | 0.110 | 0.105 | 0.00010 | 0.00000 | 0.104 |
| 7 | 2019/7/2 | 0.100 | 0.099 | 0.100 | 0.00000 | 8 | 2019/7/4 | 0.098 | 0.098 | 0.098 | 0.00000 | 0.00000 | 0.099 |
| 9 | 2019/7/5 | 0.101 | 0.102 | 0.102 | 0.00000 | 10 | 2019/7/9 | 0.098 | 0.103 | 0.101 | 0.00002 | 0.00000 | 0.101 |
| 11 | 2019/7/10 | 0.103 | 0.100 | 0.102 | 0.00001 | 12 | 2019/7/11 | 0.112 | 0.111 | 0.112 | 0.00000 | 0.00010 | 0.107 |
| 13 | 2019/7/15 | 0.105 | 0.105 | 0.105 | 0.00000 | 14 | 2019/7/16 | 0.115 | 0.102 | 0.109 | 0.00017 | 0.00001 | 0.107 |
| 15 | 2019/7/18 | 0.100 | 0.101 | 0.101 | 0.00000 | 16 | 2019/7/19 | 0.099 | 0.101 | 0.100 | 0.00000 | 0.00000 | 0.100 |
| 17 | 2019/7/23 | 0.101 | 0.101 | 0.101 | 0.00000 | 18 | 2019/7/24 | 0.098 | 0.099 | 0.099 | 0.00000 | 0.00001 | 0.100 |
| 19 | 2019/7/29 | 0.103 | 0.098 | 0.101 | 0.00002 | 20 | 2019/7/31 | 0.096 | 0.100 | 0.098 | 0.00002 | 0.00001 | 0.099 |
| Sum | 0.00002 | 0.102 | 0.097 | 0.100 | 0.00002 | 0.00001 | 0.101 | ||||||
| Run 1 | Run 2 | ΔMean | Mean (pg/ml) | ||||||||||
|---|---|---|---|---|---|---|---|---|---|---|---|---|---|
| Day | Date | Result 11 Â (pg/ml) |
Result 12 Â (pg/ml) |
Mean 1 Â (pg/ml) |
ΔResult 1 | Day | Date | Result 21 Â (pg/ml) |
Result 22 Â (pg/ml) |
Mean 2 | ΔResult 2 | ||
| 1 | 2019/6/12 | 1.01 | 1.05 | 1.03 | 0.0016 | 2 | 2019/6/13 | 1.04 | 1.06 | 1.05 | 0.0004 | 0.0004 | 1.04 |
| 3 | 2019/6/18 | 1.01 | 0.99 | 1.00 | 0.0004 | 4 | 2019/6/26 | 1.03 | 1.04 | 1.04 | 0.0001 | 0.0012 | 1.02 |
| 5 | 2019/6/27 | 1.01 | 1.02 | 1.02 | 0.0001 | 6 | 2019/7/1 | 0.97 | 0.98 | 0.98 | 0.0001 | 0.0016 | 1.00 |
| 7 | 2019/7/2 | 1.04 | 0.98 | 1.01 | 0.0036 | 8 | 2019/7/4 | 1.03 | 0.99 | 1.01 | 0.0016 | 0.0000 | 1.01 |
| 9 | 2019/7/5 | 1.08 | 1.09 | 1.09 | 0.0001 | 10 | 2019/7/9 | 1.02 | 1.02 | 1.02 | 0.0000 | 0.0042 | 1.05 |
| 11 | 2019/7/10 | 0.99 | 0.99 | 0.99 | 0.0000 | 12 | 2019/7/11 | 0.99 | 1.00 | 1.00 | 0.0001 | 0.0000 | 0.99 |
| 13 | 2019/7/15 | 1.06 | 0.99 | 1.03 | 0.0049 | 14 | 2019/7/16 | 1.00 | 1.04 | 1.02 | 0.0016 | 0.0000 | 1.02 |
| 15 | 2019/7/18 | 0.99 | 1.09 | 1.04 | 0.0100 | 16 | 2019/7/19 | 1.00 | 1.00 | 1.00 | 0.0000 | 0.0016 | 1.02 |
| 17 | 2019/7/23 | 1.00 | 1.08 | 1.04 | 0.0064 | 18 | 2019/7/24 | 0.99 | 1.04 | 1.02 | 0.0025 | 0.0006 | 1.03 |
| 19 | 2019/7/29 | 1.00 | 1.01 | 1.01 | 0.0001 | 20 | 2019/7/31 | 1.03 | 1.00 | 1.02 | 0.0009 | 0.0001 | 1.01 |
| Sum | 0.0272 | 0.0073 | 0.0098 | 1.02 | |||||||||
| Material | Mean of measured TDP-43 concentrations | Standard deviation  (Coefficient of variation) | |
|---|---|---|---|
| Repeatability | Within-lab precision | ||
| TDP-43-PBS sample 1 | 0.101 pg/ml | 0.0033 pg/ml (3.28%) |
0.0041 pg/ml (4.14%) |
| TDP-43-PBS sample 2 | 1.02 pg/ml | 0.029 pg/ml (2.88%) | 0.032 pg/ml (3.12%) |
Spiked recovery
The TPD-43 concentration of a human plasma sample (No. PRA in Table 8) was assayed with IMR TDP-43 reagent and was found to be 0.038 pg/ml. The other human plasma sample spiked with TDP-43 (No. PRF in Table 8) was assayed using the IMR TDP-43 reagent and concentration was 862.8 pg/ml. Sample PRA was mixed with Sample PRF at various volume ratios, as listed in Table 8. The expected and measured concentrations of these mixtures are listed in Table 8. The spiked recovery was calculated as the ratio of the measured concentration to the expected concentration. As shown in Table 8, the spiked recovery ranged from 98.6% to 108.8% for TDP-43 plasma samples using the IMR TDP-43 reagent.
| Plasma sample No. | Volume ratio (PRA:PRF) | Original concentration (pg/ml) | Expected concentration (pg/ml) | Measured concentration (pg/ml) | Spiked recovery rate |
|---|---|---|---|---|---|
| PRA | - | 0.038 | - | - | - |
| PRB | 80%:20% | - | 172.6 | 179.15 | 103.8% |
| PRC | 60%:40% | - | 345.1 | 375.58 | 108.8% |
| PRD | 40%:60% | - | 517.7 | 551.92 | 106.6% |
| PRE | 20%:80% | - | 690.2 | 680.84 | 98.6% |
| PRF | - | 862.8 | - | - | - |
Interference test
Interference effects of natural biomaterials, drugs and chemicals in human blood on assaying TDP-43 were investigated. Each of the natural biomaterials and drugs tabulated in Table 9 was added to individual PBS solutions spiked with a fixed concentration of TDP-43. Notably, the concentrations of the interfering materials used in this study were much greater than ordinary levels. The sample No. 1 was a pure TDP-43 solution without any interfering material. The measured TDP-43 concentration of Sample No. 1 was 1.07 pg/ml, which was used as a reference concentration to calculate the recovery rates of other TDP- 43 samples with interfering materials. The measured TDP-43 concentrations for these TDP-43 solutions with interfering materials (Sample Nos. 2-19) are listed in Table 9. All the measured TDP-43 concentrations for Sample Nos. 2-19 were compared with the reference TDP-43 concentration (Sample No. 1). The Mean % Recovery was determined by the ratio of the measured TDP- 43 concentration of a sample to that of Sample No. 1. Acceptable Mean % Recovery values range from 90.0% to 110.0%. The results showed that the Mean % Recovery of these tests ranged from 95.8% to 108.3%, as shown in Table 9. The results show that the biomolecules, drugs and chemicals listed in Table 8 did not significantly interfere with the assay for TDP-43 using the IMR TDP-43 reagent.
| Sample No. | Interfering material | Concentration | Measured TDP-43 concentration (pg/ml) | Recovery rate |
|---|---|---|---|---|
| 1 | None | - | 1.07 | - |
| 2 | Conjugated bilirubin | 600 mg/ml | 1.02 | 95.5% |
| 3 | Hemoglobin | 10000 mg/ml | 1.03 | 95.8% |
| 4 | Intra lipid | 30000 mg/ml | 1.13 | 106.0% |
| 5 | Albumin | 60000 mg/ml | 1.07 | 99.8% |
| 6 | Rheumatoid factor | 500 IU/ml | 1.06 | 98.8% |
| 7 | Uric acid | 200 mg/ml | 1.09 | 102.1% |
| 8 | a-synuclein | 10 pg/ml | 1.10 | 103.4% |
| 9 | Amyloid b 1-42 | 100 pg/ml | 1.16 | 108.3% |
| 10 | Amyloid b 1-40 | 100 pg/ml | 1.11 | 104.0% |
| 11 | Tau protein | 100 pg/ml | 1.03 | 96.3% |
| 12 | Acetylsalicylic acid | 500 mg/ml | 1.15 | 107.2% |
| 13 | Ascorbic acid | 300 mg/ml | 1.15 | 107.3% |
| 14 | Ampicillin sodium | 1000 mg/ml | 1.07 | 100.6% |
| 15 | Quetiapine fumarate | 100 mg/ml | 1.05 | 98.7% |
| 16 | Galantamine hydrobromide | 90 ng/ml | 1.07 | 100.5% |
| 17 | Rivastigmine hydrogen tartrate | 100 ng/ml | 1.14 | 106.8% |
| 18 | Donepezil hydrochloride | 1000 ng/ml | 1.03 | 96.7% |
| 19 | Memantine hydrochloride | 150 ng/ml | 1.07 | 100.4% |
Plasma TDP-43 concentrations in patients with dementia
The IMR TDP-43 reagent was used to assay TDP-43 in human plasma for normal controls (NC, n = 27) and patients with Alzheimer’s disease (AD, n = 34), Parkinson’s disease (PD, n = 10), or frontotemporal dementia (FTD, n = 9). The demographic information of the subjects is listed in Table 10. The ages of the NC, AD, PD, and FTD groups were 64.1 ± 7.6, 75.9 ± 9.2, 73.9 ± 5.3, and 60.9 ± 6.6 years, respectively. The measured concentrations of plasma TDP-43 were 0.163 ± 0.097 pg/ml for the NC subjects, 0.165 ± 0.082 pg/ml for the patients with AD, 0.069 ± 0.068 pg/ml for the patients with PD, and 0.419 ± 0.193 pg/ml for the patients with FTD, as shown in Figure 3 (a). The FTD group had significantly higher levels of plasmas TDP-43 than the other groups (p < 0.01). Through analysis of the ROC curve, the cut-off value to discriminate FTD from the other groups, including NC, AD and PD, was found to be 0.237 pg/ml. The clinical sensitivity and specificity were 88.9% and 83.1%, respectively, as shown in Figure 3 (b). The area under the curve was 0.917.
| Group (n) | NC (27) | AD (34) | PD (10) | FTD (9) |
|---|---|---|---|---|
| Female % | 75.0 | 46.7 | 40.0 | 44.4 |
| Age (years) | 64.1 ± 7.6 | 75.9 ± 9.2 | 73.9 ± 5.3 | 60.9 ± 6.6 |
| MMSE | - | 19.0 ± 4.8 | 24.6 ± 5.6 | - |
| H-Y stage | - | - | 2.6 ± 1.1 | - |
| TPD-43 (pg/ml) | 0.163 ± 0.097 | 0.165 ± 0.082 | 0.069 ± 0.068 | 0.419 ± 0.193 |

Figure 3. (a) Measured plasma TDP-43 concentrations in healthy controls (HC) and patients with Alzheimer’s disease (AD), Parkinson’s disease (PD) or frontotemporal dementia (FTD), (b) ROC curve for discriminating FTD from other groups using plasma TDP-43 concentration.
In the clinic, FTD is frequently misdiagnosed as AD due to overlapping clinical symptoms. TDP-43 is a promising biomarker for enhancing the diagnostic accuracy for AD and FTD. More attention and efforts have been paid to assaying TDP-43 in biofluids. For example, Steinacker et al. utilized immunoblotting for assaying soluble TDP-43 in CSF [20]. FTD patients had higher concentrations of CSF TDP-43 than NC patients. Suárez-Calvet et al. used ELISA to assay CSF TDP-43 for NCs, C90rf72 expansion carriers, GRN mutation carriers and FTD patients without a known mutation [25]. The results showed no significant difference in CSF TDP-43 levels between the NCs and FTD patients. Feneberg et al. used mass spectrometry to analyze TDP-43 in exosomes from CSF. They found an increase in exosome TDP-43 in FTD patients compared to NCs [21]. Kuiperij et al. used ELISA to determine the soluble TDP-43 levels in CSF [22]. FTD patients had higher levels of CSF TDP- 43 than NCs. Generally, there is an increasing trend in CSF TDP-43 levels for patients with FTD compared to NCs.
The studies on assaying plasma TDP-43 are very limited. In 2008, Foulds et al. applied ELISA to assay plasma TDP-43 in patients with FTD and NCs [24]. Although FTD patients showed higher levels of TDP-43 than NCs, 46% of FTD patients had similar levels of TDP-43 to the NCs. Moreover, the vast majority of NC patients show plasma TDP-43 levels lower than the lowdetection limit. This implies that a more sensitive assay is needed to precisely detect the levels of plasma TDP-43 in NCs. In 2014, Suárez-Calvet et al. used ELISA to assay plasma TDP-43 in patients with FTD and NCs [25]. No significant difference in plasma TDP-43 levels were observed between NCs and patients with FTD. To our knowledge, the data shown in this work are the first to demonstrate a clear difference in plasma TDP-43 between patients with FTD and NCs, patients with AD and patients with PD. The key point to achieving such a clear difference could probably be the ultrasensitivity of the IMR TDP-43 assay. As shown in Figure 3 (a), the detected levels of plasma TDP-43 were within the range of 0.004 to 0.737 pg/ml. The LoD of IMR TDP- 43 reagent was 0.679 fg/ml. This reveals that the measured concentrations of plasma TDP-43 were more than 1000-fold higher than the LoD. Hence, the concentration of plasma TDP-43 can be precisely assayed with the IMR TDP- 43 reagent [30-33].
According to the results of the a priori study in Figure 3 (a), the measured levels of plasma TDP-43 in patients with FTD were significantly higher than those in NCs, patients with AD, and patients with PD. The effect size of the measured plasma TDP-43 level was found to be 2.57 between FTD and NC patients, 2.54 between FTD and AD patients, and 6.05 between FTD and PD patients. The mean levels of plasma TPD-43 in patients with FTD were higher than those in NCs and patients with AD by at least twice. Notably, the concentrations of plasma TDP-43 in patients with PD were relatively low, even lower than that in NCs (p < 0.01). More subjects with PD should be enrolled to demonstrate that patients with PD would have extremely low levels of plasma TDP-43.
Remarkably, in Figure 3 (a), seven of the thirty-four AD patients had plasma TPD-43 levels higher than the cut-off value (= 0.237 pg/ml). The positive prevalence of FTD in AD is 20.6% by using plasma TDP-43. This result is consistent with another study that has shown that TDP-43 pathological changes can occur in approximately 20% of AD patients.
In summary, reagent for assaying TDP-43 utilizing immunomagnetic reduction was developed. Many preclinical performance characteristics were explored according to the CLSI guidelines. The results showed that the low detection limit of the assay was 0.68 fg/ml, which was sensitive enough to precisely assay TDP-43 in human plasma. FTD patients had significantly higher levels of plasma TDP-43 than NCs, AD patients and PD patients with normal cognition. The results of this a priori study for assaying plasma TDP- 43 revealed that the cut-off value of plasma TDP-43 for discriminating FTD from others was 0.237 pg/ml, with sensitivity and specificity being 88.9% and 83.1%, respectively. Independent cohorts should be enrolled to validate the cut-off value in the future.
This work was partially supported by MagQu Co., Ltd.
Neurological Disorders received 1343 citations as per Google Scholar report