Research Article - (2023) Volume 14, Issue 5
Received: 02-Sep-2022, Manuscript No. JBMBS-22-73564;
Editor assigned: 05-Sep-2022, Pre QC No. JBMBS-22-73564 (PQ);
Reviewed: 20-Sep-2022, QC No. JBMBS-22-73564;
Revised: 23-Dec-2022, Manuscript No. JBMBS-22-73564 (R);
Published:
03-Jan-2023
, DOI: 10.37421/2155-6180.2023.14.131
Citation: Goswami, Anirban, Faiyaz Ahmad, Mumtaz Ahmad and Md Ishtiyaque Alam, et al. "Determination of Disease Pattern of Scheduled Castes Population Using Model Based Clustering." J Biom Biosta 14 (2023): 131.
Copyright: �© 2023 Goswami A, et al. This is an open-access article distributed under the terms of the creative commons attribution license which permits unrestricted use, distribution and reproduction in any medium, provided the original author and source are credited.
In this study to identify the disease patterns using statistical methods on data of schedule castes of Patna, Vaishali and Nalanda districts of Bihar. Using model based clustering technique; the study is designed to determine the patterns and hidden relationships in dataset. Clustering is a valuable exploratory tool for data analysis that extracts information from a data set and transforms it into an intelligible structure for further applications. The objective of this study to provide profiling of patients, determine dominant disease and dominant month segment. In this regard, clustering is used to profile patients according to their month attended in OPD. The Bayesian Information Criterion (BIC) used to find out the optimum numbers of clusters in a dataset. Using this, a number of clusters are formed on the basis of type of disease acquired by patients, demographic socioeconomic and other characteristics beside that the patients are divided into several clusters based on the diseases they have.
Model based clustering • Disease pattern • Segments • Dominant • Optimum
The Scheduled Castes (SC) are those castes/races within the country that face radical social, educational, and economic backwardness as a result of the age-old exercise of inaccessible, as well as others due to both a lack of infrastructure and geo-spatial isolation, and who require special attention to protect their interests and accelerate their socio-economic development. The scheduled castes are those communities that are scheduled in accordance with clause (1) of article 341 of the constitution [1]. Generally, these castes are relatively behind in occupational, educational, social, cultural, religious and political sector [2]. According to census of 2011 the scheduled caste population of India is 16.63% (201378372) of total Indian population (1210854977) out of which 51.41% are male while 48.59% are female.
The scheduled caste population in Bihar is 15.91% (1,65,67,325) of total population of Bihar (10,40,99,452), out of which 51.95% are male while 48.05% are female [3]. The scheduled caste population in Patna district is 15.77% (920918) of total population (5838465) of Patna district [4]. As far as distribution on SC in districts of Patna is taken under consideration, it is 21.11% (738,031) of total population (3,495,021) in Vaishali district, out of which 51.95% are male while 48.05% are female and in Nalanda district, SC population is 21.11%(607,672) of total population i.e., 2,877,653 [5,6].
The national commission scheduled caste suggests that the state governments have plans to provide land to landless SC people and to improve the health conditions of scheduled castes [7]. The states should prioritize programs to offer basic minimum services such as primary education, health, drinking water, nutrition, rural housing, and connecting roads and electrifying for SC villeges. For the wellbeing of SC population, ministry of AYUSH has initiated mobile health care program under under Schedule Caste Sub-Plan (SCSP). The central council for research in unani medicine (M/O AYUSH, Govt. of India) implemented a health programme under Scheduled Caste-Sub Plan (SCSP) for the benefit of SC population and to improvement their health status by unani treatment. Also, to raise public knowledge about preventative, promotional, and curative health issues through lectures and group meetings, health camps and distribution of literature among SC population.
In the SC population, people are suffered from different diseases mainly topical or seasonal infections. It can become viral and every second person becoming ill. As a result, a large number of people lost their health due to lack of care. The organization's or institution's facilities quickly crumbled as the number of patients increased unexpectedly, and the institute had no plans to give therapy or medicine to patients. So, it is need to develop analytical methodology to analyze this seasonal activity of diseases with the demographical and other characteristic in SC population to solve this issue. Clustering is an effective exploratory tool for analyzing this data.
Specifically focused on cluster analysis findings on a portion of data from one of the major institutions, where numerous patient groupings have been tentatively identified. If clusters are marginally separated then cluster analysis can be a challenging in multivariate approach. Mainly, clustering method is to form the clusters from huge datasets on the basis of similarity measure. Clustering's purpose is to identify a new set of categories, the new groups are of interest in themselves and their evaluation is intrinsic [8]. Clustering divides data instances into subsets such that like examples are grouped together and diverse instances are clustered together. The clustering method is used to find commonalities between data items. Each data point within the same cluster has a higher degree of similarity than data points from other clusters. Object clustering is as old as the human need to describe the conspicuous traits of persons and things and associate them with a category. Many clustering algorithm are available today to gather the data by comparing the similarities between the data and analyze. Model based clustering is one of the most commonly used clustering methods [9,10]. Wolfe introduced the methodology of clustering objects through analyzing a mixture of distributions. The primary assumption is that items within a class have a same characteristic distribution, but objects from different classes have a different distribution.
Then the entire population follows as a mixture distribution, and the goal of clustering is to take such a mixture and break it down into basic components in order to estimate the "probabilities of membership," or the probability that each observation belongs to each cluster. Basically, clustering algorithms based on the probability models that offer a principled alternative to heuristic based algorithms. It is assumed that in model-based approach, the data may be generated from a finite mixture of underlying probability distributions such as multivariate normal distributions. One of the most recent implementations of model based clustering is MCLUST in which each observation is assumed to follow a finite mixture of multivariate Gaussian distributions [11-13]. MCLUST describes cluster geometries (shape, volume, and orientation) by reparametrizing component covariance matrices, and formulates different models by imposing constraints on each geometric feature [14]. The Expectation-Maximization (EM) algorithm is used for maximum likelihood estimation, and the Bayesian Information Criterion (BIC) is used for selection of optimal models [15,16].
The objective of this study to find out the dominant diseases in SC population i.e. which disease caused the greatest number of dominant patients to suffer, and which dominant month? As a result, the institute's administration can enhance or decrease its facilities such as medicines, doctors, specialists etc. In time and all the patients can get the treatment easily and no one have to lost their health condition [17,18]. Model based clustering used to analyze the various factors that are responsible for diseases by demographic, socioeconomic and other factors. Also, provide benefits to healthcare of the organization/institute for grouping the patients having similar type of diseases or health issues.
Models for cluster analysis
It is assumed that in model based clustering that the data are generated from a mixture of underlying probability distributions where each component represents a different group or cluster. Then
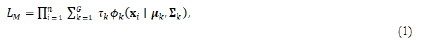
Where,
x=(x1,..., xn) represents the data of multivariate observations, G is the number of components, and τk is the probability that an observation belongs to the kth component (τk ≥ 0; ΣGk=1 τk=1), and the density of an observation xk as:

The exception of model based hierarchical clustering, for which the model used is the classification likelihood with a parameterized normal distribution assumed for each class as:

Where the li are labels indicating a unique classification of each observation: li=k if xi belongs to the kth component. The components or clusters of these models are ellipsoidal, centered at the means μk. The covariances Σk determine their other geometric features. Banfield and Raftery developed a model based framework for clustering of each covariance matrix is parameterized by eigenvalue decomposition in the form:
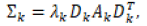
Where Dk is the orthogonal matrix of eigenvectors, Ak is a diagonal matrix whose elements are proportional to the eigenvalues of Σk, and λk is a scalar. The orientation of the principal components of Σk is determined by Dk, while Ak determines the shape of the density contours, λk specifies the volume of the corresponding ellipsoid, which is proportional to λkd|Ak|", “where d is the data dimension. Characteristics (as orientation, volume and shape) of distributions are usually estimated from the data, and can be allowed to vary between clusters, or constrained to be the same for all clusters.
In model based clustering, constraining of DkAkDkT be the identity matrix I corresponds to Gaussian mixtures in which each component is spherically symmetric. The equal volume spherical model (EII), which is parameterized by Σk=λl, represents the framework's most restrictive model, with the smallest number of parameters. The unequal volume spherical model (VII), Σk=λkI, allows the spherical components to have different volumes, determined by a different λk for each component of k. In unconstrained model (VVV), Dk, Ak and λk to vary between components. The unconstrained model is the most common model, but it has also the disadvantage that the maximum number of parameters needs to be estimated, requiring relatively more data points in each component. The range of elliptical models with other constraints and fewer parameters with the parameterization Σ k = λDADT and λ DkADkT each component is elliptical, but all have equal volume, shape and orientation as equal and variable (denoted EEE and EEV). All of these models are implemented in MCLUST [19]. Celeux and Govacrt also considered the model in which Σk =λkBk, where Bk is a diagonal matrix with |Bk| =1. Geometrically, the diagonal model corresponds to axis-aligned elliptical components. In the experiments reported in this paper, we considered the EII, VII, EEE, EEV and VVV models as implemented in MCLUST VVV models as implemented in MCLUST and the diagonal model as implemented by Murua, et al. Table 1 shows the geometric interpretation of the various parameterizations discussed in the article [20].
| Identifier | Model | HC | EM | Distribution | Volume | Shape | Orientation |
|---|---|---|---|---|---|---|---|
| EII | λI | * | * | Spherical | Equal | Equal | NA |
| VII | λkI | * | * | Spherical | Variable | Equal | NA |
| EEI | λA | * | Diagonal | Equal | Equal | Coordinate axes | |
| VEI | λkA | * | Diagonal | Variable | Equal | Coordinate axes | |
| EVI | λAk | * | Diagonal | Equal | Variable | Coordinate axes | |
| VVI | λkAk | * | Diagonal | Variable | Variable | Coordinate axes | |
| EEE | λDADT | * | * | Ellipsoidal | Equal | Equal | Equal |
| EEV | λDkADkT | * | Ellipsoidal | Equal | Equal | Variable | |
| VEV | λkDkADkT | * | Ellipsoidal | Variable | Equal | Variable | |
| VVV | λkDkADkT | * | * | Ellipsoidal | variable | variable | variable |
| ('*' Indicates availability). | |||||||
Table 1. Covariance matrix parameterizations Σk available in model based clustering for Hierarchical Clustering (HC) and EM for multidimensional data.
Expectation and Maximization (EM) algorithm
The diagonal model implementation of model based clustering, the desired number of clusters G is specified, and then the model parameters ( k, μk and Σk appropriately constrained, for 1 ≤ k ≤ G) are estimate the unknown parameters and compute the membership probabilities by the EM algorithm. In practice, mixture hierarchical clustering based on the classification likelihood (3) with Gaussian terms often gives good, but suboptimal partitions. When starting sufficiently close to the ideal value, the EM algorithm can refine partitions. Using the partitions produced, Dasgupta and Raftery were able to get good result in a number of examples by using the partitions produced using the model-based hierarchical agglomeration as starting values for an EM algorithm for constant-shape of Gaussian models, together with the BIC to determine the number of clusters.
In the context of EM algorithm, the Expectation (E) steps and Maximization (M) steps alternate. In the E-step, based on the current parameter estimations, the probability of each observation belonging to each cluster is calculated conditionally.
The model parameters are computed in the M-step given the current group of membership probabilities. When the EM algorithm has reached its conclusion, each observation is assigned to the group with the highest conditional probability (Because a data point may have a nonzero probability of belonging to many clusters at the same time, the conditional probabilities from EM provide a 'soft clustering'). In the clustering context, the EM algorithm for mixture models is usually initialized with a model based hierarchical clustering step.
Model selection
Because each combination of a different specification of the covariance matrices and a different number of clusters corresponds to a new probability model, the probabilistic framework of model based clusters permits the challenges of selecting the optimum clustering method.
Hence, the correct number of clusters to be reduced simultaneously to a model selection problem. This is significant because the probability model has a tradeoff (and the associated clustering approach), and number of clusters. For example, if one uses a complex model, a small number of clusters may be sufficient, but if one uses a simple model, a higher number of clusters may be required to appropriately match the data. Within model based clustering framework, selection of the number of clusters can be achieved through the use of the Bayesian Information Criterion (BIC). BIC to compute the Bayesian Information Criterion (BIC) gave the maximized log likelihood for model, the data dimensions, and the number of components in the model. The BIC is the maximum log likelihood with a penalty for the number of parameters in the model, and it permits comparison of models with different parameterizations and cluster counts. A high BIC value implies strong evidence for the corresponding model. Hence, the BIC score can be used to compare models with different covariance matrices for parameterizations and different numbers of clusters.
Model based strategy for clustering
Method of strategy for a model based clustering as
• Determine the maximum number of clusters to examine (M) and a set of possible Gaussian model parameterizations to consider. In general, M should be as little as feasible.
• Perform mixed hierarchical clustering for the unconstrained Gaussian model and obtain the corresponding classifications for up to M groups.
• Perform EM for each parameterization and each number of clusters 2,..., M, beginning with the classification from hierarchical clustering.
• Calculate the BIC for the one-cluster model for each parameterization, as well as the mixture likelihood with the ideal parameters from EM for 2,..., M clusters. This produces a matrix of BIC values for each feasible parameterization and cluster number combination.
• For each model, plot the BIC values. A decisive first local maximum indicates strong evidence for a model (Parameterization and Number of clusters) and figure out the optimum number of clusters.
Profiling of patients
The primary issues involved in identifying the diseases pattern in the data set. In this case, the screened patients in the village (SC population) are divided into several groups in order to obtain information on the number of patients diagnosed with a certain disease. The, the patients are divided into groups based on their month segment. Consider that M1, M2,....,Mn are separate clusters that relate to different month segments. The month segment refers to the number of patients seen every three months. As a consequence of its findings, we know the dominant month and dominant month segment, i.e. which month and month segment had the highest or optimum number of patients.
Disease pattern of patients
In order to determine the dominating month in which the number of patients with a specific condition or disease is optimum, a dataset of various disease segments (which are discovered by profiling) is gathered and fed into the "R" (Version 4.1.2) programme. From this point on, a connection between the month and disease segment may be made. Additionally, in a month there are different type of patients are attended in OPD but we have to find out the dominant disease i.e. the name of disease having optimum patients in that particular month or month segment. The identical database is feed to ‘R’ software and form four clusters. These clusters contain information about month segments as well as the dominant disease in each segment. Dominant is the maximum number of patients who have one disease.
Data sets
A mobile health care team from Regional Research Institute of Unani Medicine, Patna (CCRUM, New Delhi, M/O AYUSH, Govt. of India) conducted weekly visit at ten selected spots in scheduled caste populated area of Patna, Vaishali and Nalanda districts of Bihar during year 2018-19 to 2019-20, where OPD was being conducted and screening with demographic information like age, gender, educational qualification, occupation, month, disease, etc, as well as treatment of patients were done and data was collected properly. After collection of all data, it was double entered in Case Record Form (CRF) and Microsoft Excel Sheet. A clean database was generated to analysis this study.
A total of 10693 patients were attended in OPD during the period 2018-19 to 2019-20 to analyze. After accessed the database in through ‘R’ software selected the patients demographic and socioeconomic variables (such as: age, gender, educational qualification, occupation, month, disease, etc) to get the optimum cluster. In R software, selected the attributes as caste, age, gender, educational qualification, occupation, month, disease, etc. of attended and month segment to analysis the model based clustering and to get the results.
Estimation of optimum number of clusters
A plot of the BIC for model-based techniques is shown in Figure 1, where spherical models with equal and varying volumes, constant variance, unconstrained variance, and constant shape models with equal and varying volumes. The red dotted line represents the optimum number of clusters. The optimum estimated number of clusters using parameterizations EEV is 4. Figure 2 show the classification of the clusters against the two principal components (Dim1 and Dim2), cluster 1 and 2 shows well classified but cluster 3 and 4 shows not well classified because of that some common feature contained both of two clusters.

Figure 1. Optimum number of clusters using BIC.

Figure 2. Optimum number of clusters classification.
Profiling of patients
From Table 2 shows, that how many patients were attended in OPD for every month segment (three months segment) and from these months segment in which month segment number of attended patients are optimum? optimum number of 1217 patients attended OPD in Nov-Jan month segment corresponds to cluster-3. Next, optimum number of 1015 patients attended GOPD in Aug-Oct month segment corresponds to cluster-4. Next optimum number of 666 patients attended GOPD in Feb-Aprl month segment corresponds to cluster-2 and May-July month segment corresponds to cluster-1.
| Month Segment | Cluster-1 | Cluster-2 | Cluster-3 | Cluster-4 | Total | Cluster of optimum no. of patients for particular month segment |
|---|---|---|---|---|---|---|
| Nov-Dec-Jan | 163 | 1133 | 1217 | 966 | 3479 | Cluster-3 |
| Aug-Sep-Oct | 248 | 383 | 1653 | 1015 | 3299 | Cluster-4 |
| Feb-Mar-Aprl | 34 | 666 | 995 | 597 | 2292 | Cluster-2 |
| May-June-July | 12 | 137 | 947 | 527 | 1623 | Cluster-1 |
| Total | 457 | 2319 | 4812 | 3105 | 10693 |
Table 2. Profiling of attended patients for clusters formation.
Disease pattern discover using model based clustering
From Table 3 shows, that the most prevalent and dominant disease (optimum number of patients were attended in OPD of a particular disease) across all disease’s types in a specific month segment. Cluster-3 represents the optimum number of patients was suffered from polyarthritis, backache, haemorrhoid and constipation attended in Nov-Jan month segment. This month segment classified as winter season. Polyarthritis is a progressive, disabling, chronic multisystem disease of unknown cause characterized by pain, swelling and stiffness of synovial joints. It is a typical inflammatory illness distinguished by polyarticular inflammation of the synovial tissue. Polyarthritis is defined as arthritis that affects multiple joints is involved. It can cause very painful swelling in small and large joints from ankles, wrists, and hands to hips and knees. It may even occur in the neck and jaw areas. In this month segment, coldness and wetness increased in the environment which enhances the pain in joints. That’s way the number of polyarthritis patients increased in this month segment. It should be observed that prevalence rates of stiffness, numbness, pain, cold feeling in the fingers, dull finger movement, discomfort in the wrist, pain and numbness in the knee joint, and cold sensation in the foot were substantially greater in the winter than they were in the summer.
Backache is commonly associated with the bony lumbar spine, discs between vertebrae, ligaments surrounding the spine and discs, the spinal cord, and nerves. A complex framework of muscles, ligaments, tendons, discs, and bones that work together to support and move the human body. Any issues with any of these components might result in back discomfort. When the weather is cold, blood supply to the muscles, tendons, and ligaments that support the spine is reduced. This reduced blood supply can then promote tightness of surrounding tissue, increasing strain on the spine and pulling on spinal nerves. Cold shivering can cause muscles to stiffen or cramp. People tend to exercise less in the winter than in the summer. Therefore, body doesn’t get enough exercise and lose strength, stability, and flexibility and which leads to increase this disease. Therefore, number of patients is increased in above month segment suffering from backache.
Haemorrhoid defined as varicosity and swelling of anal and rectal veins similar to the varicosity of lower limb veins. It is a specialized highly vascular cushion of thick sub-mucosa containing blood vessels, smooth muscles, elastic and connective tissue that can slide down owing to collagen and supporting connective tissue weakening. The external hemorrhoid is a swelling of tissue outside the anus and the internal hemorrhoid is that tissues inside the rectum exit the anus. In winter season, weather gets cold, blood vessels shrink and blood circulation becomes obstructed. It can cause itching, pain, discomfort, bowel movement disorder, and bleeding. In addition, consumption of alcohol during this season, in order to keep the body warm, can worsen the symptoms. In this season, generally people take dry fruits and nuts more than summers, and even these may worsen the problem of hemorrhoids. More intake of coffee can slow down the bowels and lead to an aggravation of an existing dieses condition. During this season people reduced significantly that the amount of water they intake and this also causes constipation. Constipation means hard stools and more straining on the toilet, which can weaken the supportive tissue in the anal canal and turn in to haemorrhoid downwards.
Constipation is a condition of a patient has painful or infrequent bowel movements that cause in the passage of small amounts of hard, dry stool. Slow down the movement of the stool in the digestive tract and allow for excess absorption of water. It is a common stomach problem. People with unhealthy and disorganized lifestyle habits that slow down the movement of the stool in the digestive tract and allow for excess absorption of water. Therefore the formation of hard and dehydrated stools that is often difficult to pass. In the winter season people feel less thirsty and tend to drink lesser amount of water. This can lead to dehydration and eventually result in irregular bowel movements. As result, people can also face constipation related problems due to the increased consumption of solid foods. The contraction of stomach muscles during the winter season may also increase the respective problem.
Cluster-4 represents the optimum number of patients was suffered from Bronchitis and Bronchial Asthma attended in Aug-Oct, month segment. This month segment belongs to autumn season. Bronchitis is an inflammation in the lungs that some people call a chest cold. Bronchitis is often caused by an infection of the major airways due to viruses and it is usually self-limiting. It can sometimes be caused by allergens, irritants, and bacteria. Irritants include smoke inhalation, polluted air inhalation, dust, among others. Even after a viral infection has cleared, bronchial irritation can develop this condition. Infectious bronchitis may be bacteria, mainly if it follows an upper respiratory viral infection. It is possible to have viral or bacterial bronchitis at the same time. The season of autumn comes into this month segment. It starts after the monsoon or rainy season and lasts till the start of the pre-winter season. During this month segment the weather is cloudy, rainy and wet and hot summer days to leaping cold nights. This has significant implications for climate change. As a result, there is increases in viral infection and bacterial growth in this month segment.
Bronchial asthma is an inflammatory airway disease with episodic occurrences of dyspnea and wheezing. Breathing sounds like wheezing, a dry cough, and signs of respiratory distress. The most noticeable symptom of bronchial asthma is respiratory discomfort induced by bronchial constriction. When the inflamed bronchi come into contact with the triggering factor, the mucous membrane of the bronchi swells, the production of mucus is stimulated and the bronchial muscles cramp. Breathing becomes considerably more difficult as a result of this. Bronchial asthma is often caused by allergies; however non-allergic asthma can develop following a viral infection in the lower respiratory tract. Therefore, climatically changes in this month segment to enhance the problem of bronchitis and bronchial asthma.
Cluster-2 represents the optimum numbers of patients were suffered from Flatulence attended in Feb-Aprl month segment. Flatulence is passing gas from the digestive system that out of the back passage and gas that can build up in the stomach. When people talk, laugh out loud, eat foods, drink beverages or swallow saliva, they consume minuscule amounts of air which accumulates in gut. This buildup of air in human digestive system consists of nitrogen and oxygen. In this month segment mainly in April as hot environment and this season is most prone to stomach problems. It is seen that as the heat rises, so does the digestive problems. Also, increase in temperature has the biggest effect on the digestive system. This is the reason that most of the people these days suffer from stomach related disorders like bloating, feeling full, gas, acidity and indigestion etc. As a result, people often feel heaviness after eating or repeatedly face symptoms like flatulence and acidity (Table 3).
| Sr. No. | Dominant Disease | Cluster-1 | Cluster-2 | Cluster-3 | Cluster-4 | Cluster of optimum no. of patients suffered from particular disease | Optimum Month Segment |
|---|---|---|---|---|---|---|---|
| 1. | Polyarthritis | 64 | 401 | 1136 | 686 | Cluster-3 | Nov-Dec-Jan |
| 2. | Flatulence | 50 | 282 | 280 | 192 | Cluster-2 | Feb-Mar-Aprl |
| 3. | Backache | 50 | 213 | 561 | 290 | Cluster-3 | Nov-Dec-Jan |
| 4. | Bronchitis | 30 | 141 | 187 | 189 | Cluster-4 | Aug-Sep-Oct |
| 5. | Haemorrhoid | 20 | 93 | 207 | 171 | Cluster-3 | Nov-Dec-Jan |
| 6. | Bronchial Asthma | 22 | 92 | 150 | 177 | Cluster-4 | Aug-Sep-Oct |
| 7. | Constipation | 16 | 113 | 114 | 85 | Cluster-3 | Nov-Dec-Jan |
Table 3. Disease pattern using model based clustering.
In this study, to make a profile of patients and determine the disease patterns by model based clustering. Also, how many patients were attended in the OPD and in which months that particular diseased patient attended the most. There are so many diseases prevalent among the SC population that is practically difficult to count them all. So, the primary challenge facing our government is ensuring that everyone receives the appropriate care or medicine. Generally, it is seen that there is always shortage issue of medicines and other resources in concern hospital or institutes to provide treatment to all type of patients. However, it will be much easier to treat all patients if the institute is already aware of the most common diseases in a given month or season. In this regard, the institute or government may already plan ahead of time to ensure that no patient suffers due to a lack of resources and that they receive better care. Such that the institutes come to know the requirements of number of resources for patients from SC population of particular disease in that particular month or month segment and will able to fulfill all requirement in advance.
Journal of Biometrics & Biostatistics received 3496 citations as per Google Scholar report


