Research Article - (2021) Volume 0, Issue 0
Received: 16-Apr-2021
Published:
07-May-2021
, DOI: 10.37421/2223-5833.21.s6.001
Citation: Onwuka IO. " COVID-19 and Corporate Governance
Performance: Beyond the Financial Metrics." Arabian J Bus Manag
Review S6 (2021):001.
Copyright: © 2021 Onwuka IO. This is an open-access article distributed under the terms of the creative commons attribution license which permits unrestricted use, distribution and reproduction in any medium, provided the original author and source are credited.
Corporate governance and more broadly, the performance of corporate boards have traditional been measured using financial metrics. These financial metrics like Return on Investment (ROI), Return on Assets (ROA), Return on Equity (ROE), Earnings and Profitability Ratio (E and P) are ex-post measure of organizations wellbeing or lack thereof arising from corporate board activities. These financial metrics are, for all intents and purposes, self-serving and one-dimensional measure of corporate performance. They do not fully account for the other dimensions of organization responsibilities especially, the social, health and environmental benefits expected from organization’s activities. The COVID-19 and the changing organizational dynamics have made the case for corporate board’s performance to be assessed beyond the usual financial metrics. In this study, we provide a framework that accounts for the various dimensions of organization activities: finance, social and environmental; the so-called Triple-Bottom (TBL) approaches. A TBL-compliance metric was used to track the performance of selected manufacturing firms in Nigeria using a content analytical technique. The result of the analysis showed that majority of the firms performed remarkably well in areas of profitability and economic value creation but performed less satisfactorily in areas of social and environmental sustainability. On aggregate, the sampled firms committed less than 1 percent of their profit after tax on corporate social responsibility while less than 5 percent of the sampled firms scored above average on the TBL-adoption matrix. From the findings of the study we can conclude that manufacturing firms in Nigeria are yet to be fully committed to social and environmental sustainability. The study recommended for a regulatory re-jig away from the usual mandatory declaration of commitment to concrete actions based on measurable indicators on social and environmental sustainability compliance.
COVID-19 • Corporate governance • Financial metrics • Corporate social responsibility • Capillaries
Early this year, news broke out that a novel coronavirus has hit the city of Wuhan, China. It was reported that the SARS-COV2 virus is responsible for the COVID-19 pandemic. The virus later spreads to other parts of the world from early February, 2020 and currently 213 countries are battling with the scorch of the virus. As expected, the coronavirus pandemic is impacting the world in a way that has not been seen since World War II. In particular, the pandemic has impacted on the way businesses are now being conducted and the expectations of the various stakeholders on organizations going forward. For instance, there is now greater awareness on issues of human rights protection, environmental protection, health and safety issues. More than ever before, the issue of Corporate Social Responsibility (CSR) and the duty of care to broader stakeholders by business entities have become more compelling. The pandemic has also increased the interest of the public in supporting responsible business practices and it is expected that consumers will henceforth be demanding more information as to how companies address risks and opportunities relating to health and environmental issues.
Moreover, there is likely to be greater convergence of expectations by citizens of various countries with regard to minimum standards corporations should achieve in relation to social, health and environmental issues regardless of the jurisdiction in which the corporations operates and there will also be increased demand on organizations to go beyond current regulations and legislations regarding corporate social responsibilities to something much more encompassing.
Even before the coronavirus pandemic, many organizations around the world were already voluntarily integrating the considerations of broader community interest into their core business strategies. The coronavirus pandemic has made these considerations even more forceful and compelling.
In this paper, we make a case for broadening the scope of corporate governance measurement to take account of other considerations outside the financial metrics and we outline the conceptual and empirical approach for doing so. The paper therefore, has two broad objectives:
First, we provide a conceptual and methodological overview on the uses and empirical implementation of triple-bottom measurement using firm-level data. Second, we demonstrate, using data from selected manufacturing firms in Nigeria, how the general methodological approach can be usefully applied and tailored to various sectors and contexts to yield policy-relevant insights about how corporate governance performance should be assessed beyond the financial metrics.
Following this introduction, the rest of the paper is organized as follows. The next section provides a conceptual review of triple-bottom approach to corporate governance measurement. We provide the rationale for assessing corporate governance performance beyond the usual financial metrics. In the third section, we provide simple taxonomy for thinking about triple-bottom in corporate governance assessment and use this taxonomy to suggest how different organizations can use the triple-bottom approach to assess the performance of their corporate boards. The section also contains an operational definition of corporate governance and triple-bottom approach that can, in principle, be taken to the data beyond the financial metrics.
In section four, we outline a general and flexible methodology for empirical implementation of triple-bottom measurement to corporate governance using firm level data. After summarizing the basic approach, we demonstrate the various steps involved and the measurement issues that could arise in each step.
In section five, we provide the policy implication of using the triplebottom approach in assessing corporate boards and suggest ways organizations and governments could integrate triple-bottom reporting post COVID-19.
Corporate governance and sustainability
Concept of corporate governance: There are various definitions of corporate governance in extant literature. However, the best definition seems to come from the Canadian Office of the Superintendent of Financial Institutions [1]. The Office defines corporate governance “as the oversight mechanisms which include the processes, structures and information for directing and overseeing the management of a company” [2-6]. This definition is pervasive as it encompasses the means by which members of the board of directors and senior managers are held accountable for their actions, and the establishment and implementation of oversight functions and processes. According to Cadbury Committee, “corporate governance is holding the balance between economic and social goals and between individuals and communal goals” [7-11]. The Organization of Economic Cooperation and Development defines corporate governance as the “distribution of rights and responsibilities among different participants such as the shareholders and other stakeholders”.
Corporate governance studies gain traction in the early 2000s due to conspiracy of events and the scandals that rocked the corporate world from the unexpected failures of large corporations around the world especially Enron, WorldCom, Tyco International (United States of America), HIH Insurance (Australia), Paramalat (Italy), etc. The scandalous collapse of these corporate giants jolted the corporate world and led to massive calls for greater attention on the activities of boards in corporations. These calls were not however, unfounded as several (post-mortem) studies show that the collapse of many of these corporations were attributable to ineffective and weak corporate governance practices especially in areas of excessive risk taking by management with weak oversight by boards; excessive remuneration taking by management with fraudulent acquiescence by the board; flagrant neglect and override of internal control measures, abuse of office, absence or non-adherence to authority limits and general laxity on the part of boards to effectively discharge their oversight functions [12-21].
The shock that followed these corporate scandals prompted a chain of regulatory and supervisory interventions around the globe [22]. The United States fired the first shot with the enactment of Public Accounting Reform and Investors Protection Act of 2002 known as “the Sarbanes-Oxley Act” [23]. Many other countries followed suit with similar enactments including the stock exchange codes in the United Kingdom and Code of Corporate Governance for quoted companies in Nigeria.
The overarching objective of these regulations has been to improve the effectiveness of boards and other corporate governance practices in corporations. It is widely accepted based on a fairly large body of scholarly works that board effectiveness could play a vital role in determining corporate financial performance [24-36]. This belief may have accounted for the preponderance in the usage of financial indicators in measuring the performance of boards. In other words, it has been the practice in extant literature to measure the effectiveness of boards in terms of financial performance of the organization using for instance indicators like profitability, Return on Investment (ROI), Return on Assets (ROA), Return on Equity (ROE), firm’s value (Tobin’s Q), Earnings per Share (EPS), etc.
These financial indicators are usually highlighted in financial statements example include income statement, balance sheet and notes to the financial statement. It is also common to find in annual reports of organization scanty mention of issues related to Corporate Social Responsibilities (CSR) and some humanitarian activities undertaken by the organization [37].
This approach at measuring corporate performance based largely on financial metrics is being challenged by recent re-alignments and a paradigm shift in expectations by the stakeholders. It is increasingly clear that measuring corporate performance based entirely or largely on financial metrics do not fully account for the social, health and environmental benefits derivable from corporate activities. There is a growing consensus that organizations must fully account for how much (or less) they are contributing in addressing the social, health and environmental issues that confronts mankind [38,39]. It is in this respect that the concept of sustainability reporting and the Triple-Bottom Line (TBL) framework enunciated by [40]. This framework is a paradigm shift from the traditional “for profit” to a more comprehensive assessment along the dimensions of profit, people and planet.
Sustainability is simply defined by the United Nations Brundtland Commission [41]. As “meeting the needs of the present without compromising the ability of future generations to meet their own needs.” To achieve this, the United Nations in 2015 [42]. Articulated the 17-Sustainable Development Goals (SDGs). The Sustainable Development Goals forms the framework for improving the lives of populations around the world and mitigating the hazardous man-made effects of climate change. For instance, SDG 13: Climate Action, calls for integrating measures to prevent climate change within development frameworks. SDG 14: Life Below Water, and SDG 15: Life on Land, also call for more sustainable practices in using the earth’s natural resources. Today, there are almost 140 developing countries in the world seeking ways of meeting their development needs, but with the increasing threat of climate change, concrete efforts must be made to ensure development today does not negatively affect future generations.
It must be remarked that sustainable development has been the promoted goals of responsible corporate entities around the world. Most of the corporate governance codes around the world have continued to harp on the issue of sustainability with businesses and corporations around the world increasingly re-appraising their business models to be sustainabilitycompliant [43,44].
However, inspite of the focus on issues of sustainability, measuring the degree to which an organization is being sustainable or pursuing sustainable growth has not been easy or clear-cut [45]. In the mid-1990s, [40,46,47]. Developed a template for measuring sustainability in what has become known as the Triple-Bottom Line (TBL) approach. This framework measures corporate performance beyond the usual financial metrics of profitability and firm value (or shareholder value) to include environmental and social dimension of firm’s activities. By focusing on comprehensive assessment of firm’s activities along the three dimensional trajectory of profits, people and the planet-the TBL has become an important assessment framework for measuring sustainability and sustainability goals.
As a concept, the TBL is a construct that broadens a business focus on the financial bottom line to include social and environmental considerations. By applying the framework, it is plausible to measure a company’s degree of social responsibility, its economic value creation and the environmental impacts of its operations. The framework was introduced in 1994 by John Elkington and later demonstrated in his 1997 book “Cannibals with Forks: The Triple Bottom Line of 21st Century Business” [40]. As recognized by Elkington himself, a key challenge before the introduction of the TBL framework was how to explicitly measure the social and environmental bottom lines unlike the financial bottom line which is easily measured by financial metrics. This difficulty has led to the three bottom lines being evaluated separately on their own merits.
However, the TBL is an accounting framework incorporates these three dimensions of performance - financial, social and environmental. By incorporating these dimensions of performance, the TBL differs from traditional accounting reporting frameworks by the inclusion of ecology (or environment) and social measures which are difficult to assign numerical values to. The TBL is also known as the 3Ps-people, planet and profits [48]. The TBL captures the essence of sustainability by its focus on measuring the impact of an organization’s activities not only on its profitability and shareholders’ value but on the social, human and environmental dimensions [45].
The TBL accounting approach has gained increased traction since the launch of the Sustainable Development Goals by the United Nations in 2015 and many organizations and businesses have adopted the TBL sustainability framework to evaluate their performance and check how sustainable-compliant their activities have been [49,50].
The TBL approach has also gained currency with governments at all levels in many developed countries. In consequence, there have been shifts from profit making and shareholders’ value maximization orientation towards the social and environmental benefits derivable from corporate activities. Increasingly, other stakeholders (besides the shareholders) are expressing interest to know how much corporate organizations are contributing in addressing societal and environmental-related issues within the environment where they operate. This call will only get louder post- COVID-19 pandemic..
Measuring the triple bottom lines
Measuring instrument: There is no universal approach yet to measuring the TBL [51]. Aside the absence of a common denominator for measurement, there is also the issue of differences in country’s institutional dynamics and country-specific approaches to issues of sustainability. For instance, profits globally are measured in monetary units, for instance, in US the dollar. But how does one measure social capital or environmental or ecological wellbeing (or lack thereof). Therefore, finding a common unit of measurement for the TBL has remained a challenge [52,53].
Some scholars have advocated monetizing all the three dimensions of the TBL. However, the practical challenge is how to put monetary value on many intrinsic social or environmental issues [45]. For instance, how can one monetize the issue of endangered species or the lost of wetland or fauna? Other scholars have suggested the calculation of TBL in terms of an index, perhaps a Principal Component Index (PCI). By this method, we eliminate the incompatible-unit problems and as long as there is a universally acceptable accounting method which allows for comparison between entities, for instance, comparing performance between companies, cities, development projects, or some other benchmark, there will be no problem. The Indiana Business Research Center’s Innovation Index is one of such index that has been used to compare a variety of components between one country and other countries [53].
However, there still remains the problem of subjectivity in using such index. For instance, how is the index components weighted? Would each “P” in the TBL get equal weighting? Even if we relax this condition, what about the sub-components within each “P” as is usually the case? Do they all get equal weighting? For instance, is the people category more important or equal to the planet category? Who decides which component weighs heavier in ranking? [51].
There is the other option to do away completely with measuring sustainability using a financial metric or an index. In this case, each sustainability measure will stand alone. For instance, acres of wetland could be a measure of its own and progress could be measured or gauged based on certain parameters like wetland creation, destruction or status quo over time [54]. However, the problem with this approach is the high probability of proliferation of metrics that will be ultimately required to measure sustainability in a wide range of issues to the point that the TBL user may become metric-fatigued.
What should go into the index?
In the absence of universally acceptable method for calculating the TBL or an agreed standard for weighting each of the components of the TBL, it becomes a discretionary issue on what goes into the sustainability index and what is left out. In other words, the user is at liberty to adopt a general framework or adapt the measurement to the specifics of its own needs. For instance, a business entity and local government agency may measure environmental sustainability in the same terms; perhaps, reducing the amount of solid waste that goes into the landfills, but a local mass transit may measure success in terms of passenger miles, whereas a profitmaking bus company may measure success in terms of earnings per share. The TBL framework is flexible enough to accommodate various divergent perspectives to sustainability measurement [52].
According to the TBL can also be adapted to be case or project-specific or allow a broad scope-measuring approach across large geographic boundaries or a narrow geographic scope like a small town. A single case or project-specific TBL approach would measure the effects of a particular project in a specific location, such as a community building a park or town hall. The TBL can also apply to infrastructure projects at the state level or energy project at the national level.
From the foregoing, it appears that the level of entity, type of project and the geographic scope will in most cases determine the decisions about what measures to include. However, it is the stakeholders and subject matter experts that will ultimately determine the set of measures to include in sustainability assessment and the availability of data [45]. Has however, categorized the traditional sustainability measures which have been gleaned and pieced together from academic discourses and empirical works. They include:
Economic measures: Economic measures of sustainability focuses on the flow of money, income and expenditures, taxes, business factors, employment and business diversity factors. Other variables that could come under economic measures include: personal income, cost of underemployment, job growth, revenues and all the other factors that relates to flow of money or some economic resources.
Environmental measures: Under environmental measures are issues related to natural resources including other free gifts of nature like air, water quality, energy consumption, solid and toxic waste and land use. Other environmental issues that an organization may wish to consider in sustainability measurement include issues related to sulfur dioxide concentration, nitrogen oxides concentration, selected priority pollutants, fossil fuel usage, solid waste management, hazardous waste disposal and management and change in land use, deforestation, endangered species, etc.
Social measures: Social measures will focus on issues related to social dimension of communities or regions and include such issues such as education, equity and access to social resources, community health and wellbeing. Other social issues are: use of social capital, unemployment rate, female labour force participation rate, household income, level of poverty, access to education, crime rates, life expectancy, etc [53]. Observed that data for these measures may not be easily available at community, state or national levels. And even where data is available, it is still a subjective issue of what to incorporate or discard in the measurement. By and large, TBL can be difficult to measure. Indeed, of the three legs of the triad, social and environmental dimensions are the most difficult to measure. For instance, the first P=profit, can be easily put in black and white, the other 2 Ps- people and planet (or social and environmental) are highly subjective. How can one put a monetary value on oil spill? How does one measure the monetary cost of a child labour or the cost of deforestation and loss of wetland? These are not easy tasks even for the most enthusiastic sustainability advocate.
Design
The study used a mixed method design which comprised qualitative and quantitative analysis. The dataset comprised financial data from annual reports and statement of income of selected quoted manufacturing firms in Nigeria. These were complemented by 17-TBL-adoption metrics-a construct which was developed and used to track the performance of these selected firms along the TBL parameters (Table 1).
.| S/No | Indicator | Rank |
|---|---|---|
| 1 | Corporate policy and concrete investment on global warming, pollution and deforestation | 0-2 |
| 2 | Corporate policy and concrete investment on global security, terrorism and armed conflicts | 0–2 |
| 3 | Corporate policy and concrete investment on poverty reduction and financial inclusion | 0–2 |
| 4 | Corporate policy and concrete investment on global fight against hunger and mal-nutrition | 0–2 |
| 5 | Corporate policy and concrete investment on global fight against racism | 0–2 |
| 6 | Corporate policy and concrete investment against all forms of discrimination – racial, sexual, religion, creed, etc. | 0–2 |
| 7 | Corporate policy and concrete investment on use of raw materials that are environmentally friendly such as fresh natural and/or organic ingredients | 0–2 |
| 8 | Corporate policy and concrete investment on social value and national orientation | 0–2 |
| 9 | Corporate policy and concrete investment to charity and donations to the less privileged members of the global community | 0–2 |
| 10 | Corporate policy and concrete investment on water related issues | 0–2 |
| 11 | Corporate policy and concrete investment on women empowerment and girl-child education | 0–2 |
| 12 | Corporate policy and concrete investment to disaster assistance to victims and humanitarian reliefs | 0–2 |
| 13 | Corporate policy and concrete investment to reduction in carbon emission | 0–2 |
| 14 | Corporate policy and concrete investment to improved energy efficiency in manufacturing and organizational process | 0–2 |
| 15 | Corporate policy and concrete investment on increasing use of renewable energy, deploying more energy-efficient technologies and closely monitoring emission from all activities | 0–2 |
| 16 | Corporate policy and concrete investment towards the physically challenged members of the community | 0–2 |
| 17 | Corporate policy and concrete investment on equal employment opportunity for male and female | 0–2 |
| Maximum attainable mark | 34 (scaled to 100) |
Sample and sampling technique
Nine (09) manufacturing firms were selected for the study. The purposive sampling technique was used in the selection of the manufacturing firms for the study. The primary criterion for the selection of firms is that such firms must be quoted in the Nigerian Stock Exchange (NSE) and must have been rendering annual returns consistently to the Securities and Exchange Commission (SEC) for the period covered by the study. Efforts were also made to ensure sectoral dispersion in the selection of the sampled firms.
Analytical technique
Apart from the financial data which was gleaned from the annual reports and statement of accounts of the selected manufacturing firms, a TBL-adoption matrix was constructed to track each firm’s commitment and achievement in the area of social and environmental sustainability. As observed earlier, the TBL framework rests on three tripods or 3Ps (Profit, People and Planet). These 3Ps constitute the triple bottom lines. Each bottom line has a unique focus. For instance, the first P (1P), people, represent economic value creation (profit), the second P (2P), social, represent people/society and the third P, planet (3P) represents the environment.
The first P, the economic value creation was proxied by Profit After Taxation (PAT). This has numerical value and can be accessed from the annual reports and statement of accounts of the selected firms. The second P – People (social) was proxied by expenditure on Corporate Social Responsibility (CSR). This too has numerical value and can be gleaned from the annual reports and statement of accounts of the selected firms. The third P, Planet was proxied by a principal composite index derived from a 17-TBL-adoption matrix: A construct developed to track policy enunciation and commitment to environmental sustainability.
It was important to check how each of the firms was progressing towards being totally compliant in the context of social and environmental sustainability. To check this, a TBL-compliant matrix was constructed based on some qualitative parameters. The first construct, TBL1 was derived using the Principal Component Index (PCI). The PCI was necessary to reduce the dimension of the dataset and extract the main characteristics from it. This method is useful to obtain an index which measures the different phases in the TBL-adoption process. Five major processes were identified in the sustainability process namely: commitment to disaster and humanitarian reliefs, commitment to reduction in carbon emission, commitment to improved energy efficiency and use, commitment to use of renewable materials that will ensure efficient technologies and reduced emissions from all production processes. Each of these processes was allocated a numerical value between 0-2. Zero denoting starting period progressing to 2 depending on the degree of commitment to each of the parameters. From this, we generate a matrix of three indicators for each firm and apply the principal component analysis. We identified 17 major progressions towards being TBL-compliant.
The second sustainability index, TBL2, involves a systematic assignment of a numerical value to each of the progressions in the 17-TBL-compliant ladder. This numerical assignment was based on a prima fascia evaluation of each firm’s commitment to sustainability through policy enunciation or actual performance along the TBL-compliant matrix.
This approach at assessing quantitatively and qualitatively corporate governance performance proxied by firm’s commitment to sustainability in Nigeria is robust than earlier attempts which focus largely on financial dimension of firm’s activities. [55-60].
Data from selected manufacturing firms in Nigeria
The annual reports and statement of accounts of selected manufacturing firms (namely, Berger Paints Nigeria Plc, Beta Glass Nigeria Plc, Honeywell Flour Nigeria Plc, Lafarge Nigeria Plc, May and Baker Nigeria Plc, Unilever Nigeria Plc, Cadbury Nigeria Plc, Guinness Nigeria Plc and Nestle Nigeria Plc) were examined to assess each firm’s financial performance and commitments to social and environmental sustainability.
Three indicators were used for this assessment in line with the Triple- Bottom-line (TBL) framework. The first indicator was Profit After Tax (PAT) which stands proxy for a firm’s financial performance representing the first P in the three legs of the triad (profit). The second indicator is expenditure on Corporate Social Responsibility (CSR) which stands proxy for firm actual commitment to social sustainability, representing the second P in the three legs of the triad (social). The third indicator was a composite score based on principal component index from a construct-the 17-sustainability matrix developed to track each firm’s commitment and policy enunciation to environmental sustainability, representing the third P in the three legs of the triad (environmental). These complete the triple-bottom framework (3Ps- profit, social and environment) (Tables 2 and 3).
| Firm | Profit after tax (N'million) | Expenditure on corporate | % of PAT on CSR | Composite score on the 17 TBL-adoption matrix (max=100) |
|---|---|---|---|---|
| Berger Paints | 12,90,943 | 3,958 | 0.30659758 | 40.6 |
| Beta Glass | 1,56,00,007 | 51,942 | 0.33296138 | 34.7 |
| Honeywell Flour | 1,01,79,894 | 62,971 | 0.61858208 | 37.6 |
| Lafarge | 3,75,38,693 | 31,42,918 | 8.372475834 | 47.1 |
| May and Baker | 7,82,528 | 10,631 | 1.358545637 | 35.3 |
| Unilever | 2,46,78,819 | 3,25,849 | 1.320358969 | 61.2 |
| Cadbury | 41,17,294 | 32,360 | 0.785953104 | 50 |
| Guinness | 2,39,15,868 | 1,14,143 | 0.477268899 | 52.4 |
| Nestle | 13,06,29,141 | 1,37,569 | 0.105312642 | 55.3 |
| Total | 24,87,33,187 | 38,82,341 | 1.560845598 | - |
Is aggregate data on the financial performance of the selected firms for the period 2014-2018 while the individual firm’s performance. Table shows the performance of the firms on the TBL-adoption matrix. In terms of financial performance shows that all the selected manufacturing firms performed remarkably well within the period under review. Except for May and Baker Nigeria Plc and to some extent, Berger Paints Nigeria Plc, the rest of the firms recorded Profit After Tax (PAT) in excess of the industry average of N 2 billion for the period under review. Therefore, in terms of economic value creation and the first bottom line, profit, we can conclude that all the selected manufacturing firms performed remarkably well for the period 2014-2018 (Tables 3a-3i).
| Year | PAT (=N=) | EXP on CSR (=N=) | % of PAT on CSR |
|---|---|---|---|
| 2014 | 25,13,46,022 | 2,87,934 | 0.114556816 |
| 2015 | 24,88,05,122 | 3,93,250 | 0.158055428 |
| 2016 | 22,40,07,344 | 9,34,600 | 0.417218464 |
| 2017 | 24,62,76,146 | 14,19,464 | 0.576370884 |
| 2018 | 32,05,09,108 | 9,23,012 | 0.287983081 |
| Total | 1,290,943,742 | 39,58,260 | 0.306617544 |
| Year | PAT (=N=) | EXP on CSR (=N=) | % of PAT on CSR |
|---|---|---|---|
| 2014 | 2,39,02,23,001 | 92,31,333 | 0.386212207 |
| 2015 | 1,99,11,27,002 | 1,06,75,000 | 0.536128534 |
| 2016 | 3,79,93,93,042 | 1,03,00,000 | 0.271095933 |
| 2017 | 3,11,51,42,102 | 1,07,38,001 | 0.344703408 |
| 2018 | 4,30,41,22,005 | 1,09,98,333 | 0.255530233 |
| Total | 15,600,007,152 | 5,19,42,667 | 0.332965661 |
| Year | PAT (=N=) | EXP on CSR (=N=) | % of PAT on CSR |
|---|---|---|---|
| 2014 | 3,35,15,46,003 | 76,81,658 | 0.22919745 |
| 2015 | 1,12,02,67,005 | 74,16,845 | 0.66206047 |
| 2016 | -3,02,38,52,101 | 1,17,07,774 | -0.387180775 |
| 2017 | 4,30,49,55,112 | 2,09,01,974 | 0.485532914 |
| 2018 | 4,42,69,78,003 | 1,52,63,699 | 0.344788228 |
| Total | 10,179,894,022 | 6,29,71,950 | 0.618591411 |
| Year | PAT (=N=) | EXP on CSR (=N=) | % of PAT on CSR |
|---|---|---|---|
| 2014 | 34,38,52,75,000 | 25,98,20,450 | 0.755615449 |
| 2015 | 29,65,77,73,005 | 60,42,45,559 | 2.037393566 |
| 2016 | 16,89,87,81,100 | 74,83,46,711 | 4.428406444 |
| 2017 | -34,601,409,220 | 66,16,27,952 | -1.912141635 |
| 2018 | -8,80,17,26,090 | 86,88,78,089 | -9.871678352 |
| Total | 37,538,693,795 | 3,14,29,18,761 | 8.372477685 |
| Year | PAT (=N=) | EXP on CSR (=N=) | % of PAT on CSR |
|---|---|---|---|
| 2014 | 6,33,40,000 | 0 | 0 |
| 2015 | 6,80,33,302 | 0 | 0 |
| 2016 | -4,87,12,022 | 0 | 0 |
| 2017 | 35,71,81,099 | 5,943 | 1.66406705 |
| 2018 | 34,26,86,021 | 4,687 | 1.36795046 |
| Total | 78,25,28,400 | 10,631 | 1.35860986 |
| Year | PAT (=N=) | EXP on CSR (=N=) | % of PAT on CSR |
|---|---|---|---|
| 2014 | 2,41,23,43,003 | 3,28,64,545 | 1.36234959 |
| 2015 | 1,19,23,66,122 | 21,20,66,003 | 17.78530932 |
| 2016 | 3,07,18,85,200 | 1,87,86,715 | 0.611569566 |
| 2017 | 7,45,00,85,021 | 1,86,75,960 | 0.250681166 |
| 2018 | 10,55,21,40,090 | 4,34,56,134 | 0.411822944 |
| Total | 24,678,819,436 | 32,58,49,357 | 1.320360392 |
| Year | PAT (=N=) | EXP on CSR (=N=) | % of PAT on CSR |
|---|---|---|---|
| 2014 | 2,13,73,19,000 | 81,00,000 | 0.378979461 |
| 2015 | 1,15,32,95,285 | 66,46,267 | 0.576284936 |
| 2016 | -29,64,03,003 | 57,99,578 | -1.956652916 |
| 2017 | 29,99,98,042 | 76,96,543 | 2.565531078 |
| 2018 | 82,30,85,420 | 41,18,284 | 0.500347096 |
| Total | 4,117,294,744 | 3,23,60,672 | 0.785969284 |
| Year | PAT (=N=) | EXP on CSR (=N=) | % of PAT on CSR |
|---|---|---|---|
| 2014 | 9,49,55,30,402 | 1,14,06,028 | 0.120119967 |
| 2015 | 7,79,48,99,102 | 1,12,02,005 | 0.143709429 |
| 2016 | -2,01,58,86,002 | 6,79,85,102 | -3.372467587 |
| 2017 | 1,92,37,20,108 | 1,17,75,085 | 0.612099699 |
| 2018 | 6,71,76,05,123 | 1,17,75,280 | 0.175289851 |
| Total | ########### | 11,41,43,500 | 0.477270975 |
| Year | PAT (=N=) | EXP on CSR (=N=) | % of PAT on CSR |
|---|---|---|---|
| 2014 | 22,23,56,40,008 | 4,55,47,432 | 0.204839762 |
| 2015 | 23,73,67,77,123 | 4,71,91,240 | 0.198810646 |
| 2016 | 7,92,49,68,120 | 87,78,000 | 0.110763853 |
| 2017 | 33,72,37,30,004 | 20,88,001 | 0.006191489 |
| 2018 | 43,00,80,26,108 | 3,39,65,020 | 0.078973678 |
| Total | 130,629,141,363 | 13,75,69,693 | 0.105313173 |
At comparatively level, Nestle Nigeria Plc recorded the highest Profit After Tax (PAT) of approximately N 131 billion within the 5-year period under review. They were followed by Lafarge Nigeria Plc that recorded a profit after tax of approximately N 38 billion within the same period. Unilever Nigeria Plc and Guinness Nigeria Plc came in third and fourth position respectively with a profit after tax of approximately N 25 billion and N 24 billion respectively. Berger Paints Nigeria Plc and May and Baker came at the rear with a profit after tax of approximately N 1 billion and N 783 million respectively.
In terms of performance on social sustainability, proxied by expenditure on Corporate Social Responsibility (CSR), Lafarge Nigeria Plc tops the list. The company spent approximately N 3 billion or 8 percent of their profit after tax on CSR within the period under review. They were followed by Unilever which committed approximately N 326 million or 1.3 percent of profit after tax on corporate social responsibility. As a percentage of profit after tax, May and Baker came third with a commitment of approximately 1.4 percent of their profit after tax on expenditure on corporate social responsibility.
On the aggregate, the 9 selected firms committed the sum of approximately N 4 billion or 1.6 percent of their profit after tax of approximately N 249 billion on corporate social responsibility for the 5-year period under review. Moreover, apart from Lafarge Nigeria Plc, Unilever Nigeria Plc and May and Baker Nigeria Plc, none of the firms committed up to 1 percent of their profit after tax on corporate social responsibility. This is considered a dismal performance from the prism of social sustainability (Table 4).
| Firm | 2014 | 2015 | 2016 | 2017 | 2018 | Total | % score | Rank |
|---|---|---|---|---|---|---|---|---|
| Berger Paints | 12 | 12 | 15 | 15 | 15 | 69 | 40.6 | 6 |
| Beta Glass | 10 | 10 | 12 | 12 | 15 | 59 | 34.7 | 9 |
| Honeywell Flour | 12 | 12 | 12 | 14 | 14 | 64 | 37.6 | 7 |
| Lafarge | 15 | 15 | 15 | 15 | 20 | 80 | 47.1 | 5 |
| May and Baker | 10 | 10 | 10 | 15 | 15 | 60 | 35.3 | 8 |
| Unilever | 20 | 20 | 20 | 22 | 22 | 104 | 61.2 | 1 |
| Cadbury | 15 | 15 | 15 | 20 | 20 | 85 | 50 | 4 |
| Guinness | 15 | 17 | 17 | 20 | 20 | 89 | 52.4 | 3 |
| Nestle | 15 | 17 | 20 | 20 | 22 | 94 | 55.3 | 2 |
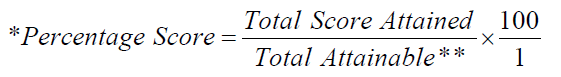
is considered a dismal performance from the prism of social **Total Attainable=Maximum score for a year x Number of years
=(2 x 17)=34
=34(5
=170
In terms of commitment to environmental sustainability, proxied by policy enunciation and concrete avowal to these policies, none of the firms, except Unilever Nigeria Plc, score up to 60% on aggregate in the 17-TBL matrix. Table shows the level of progress recorded by each of the firms in the 17-TBL adoption process. Although, most of the firms do not score above 60 percent in the adoption matrix, most made remarkable progress on year-on-year basis on the TBL-adoption process. Unilever has beenvery consistent in its commitments to environmental sustainability as can be seen by its strong showing in all the performance parameters all through the period under review. Lafarge, Cadbury, Guinness and Nestle have also been consistent in their commitment to environmental sustainability. These companies, amongst others, consistently carry out environmental sustainability audit to assess the impact of their operations on the environment and Lafarge in particular, has taken steps to reduce emission and waste arising from their operations.
An important feature to note is that all the multinational corporations have shown more commitment to environmental sustainability than the local corporations. However, on the aggregate, there is still much to be done by the firms to be fully compliant in line with the TBL framework.
The COVID-19 pandemic will predictably change the way corporate governance performance will henceforth be measured. The traditional method of measuring corporate governance based largely on financial metrics will no longer be adequate as businesses and firms will increasingly be required to account for the social and environmental impact of their operations. This is where the Triple-Bottom (TBL) framework developed by John Elkington becomes imperative.
In this study, we have demonstrated, using data from selected manufacturing firms in Nigeria, how this approach can be usefully applied to measure not only the profit angle of a firm’s operation but their commitment to social and environmental sustainability in line with TBL framework. We have shown that measuring the social and environmental aspect of a firm’s operations is equally as important as measuring the financial performance. The extant literature is replete with studies that measured corporate performance from the prism of financial indicators but not enough studies have been done to measure corporate performance beyond the usual financial metrics. To this end, this work has added to the growing literature on corporate governance performance using non-financial indicators.
The study has thrown up a lot of policy imperatives as follows:
1. There are currently no metrics to measure what makes a firm’s commitment to environmental sustainability credible. The corporate governance code that touches on environmental sustainability in Nigeria is the “Sustainability Disclosure Guidelines” issued by the Nigerian Securities and Exchange Commission (2018). However, these codes are largely prescriptive and declaratory. Therefore, a firm’s affirmative action to environmental sustainability is entirely “in the eyes of the beholder”. In the absence of acceptable metrics, arguments to being environmentally sustainable can almost always be contrived by any organization to justify its position. There is need to compel organizations to go beyond mere disclosure just to fulfill regulatory requirements to concrete and measureable metrics that can be tracked and assessed.
2. There may be need for regulators in Nigeria to come up with legislation that will require manufacturing firms in Nigeria to commit more of their Profit After Tax (PAT) in activities that promote social and environmental sustainability. The extant regulations on corporate governance codes in Nigeria merely require firms to make declarations or policy enunciation on commitments to environmental sustainability with no quantifiable way of measuring these policy enunciations and commitments. The construct 17-TBL adoption matrix proposed in the study could led the way towards quantifying and measuring firm’s commitments to social and environmental sustainability.
3. Post COVID-19, manufacturing firms in Nigeria should on their own (without regulatory prompting) make a paradigm shift on the way they approach the issue of social and environmental sustainability. The pandemic has shown that greater attention will be paid by various stakeholders on how firm activities contribute to social and environmental sustainability going forward. Rather than making declarations and regulatory-induced commitments to environmental sustainability in order to “fulfill all righteousness”, more concrete actions will be required to walk the talk.
4. Civic societies, social advocates and non-state actors should henceforth engage more actively with businesses to show greater commitment on issues of social and environmental sustainability. The general public should be sensitized to show greater support to businesses that are committed to social and environmental-friendly practices by way of patronage and shunning those businesses that care less about social and environmental sustainability.