Research Article - (2023) Volume 11, Issue 4
Received: 28-Jul-2023, Manuscript No. jnd-23-108391;
Editor assigned: 31-Jul-2023, Pre QC No. P-108391 (PQ);
Reviewed: 14-Aug-2023, QC No. Q-108391;
Revised: 21-Aug-2023, Manuscript No. R-108391 (R);
Published:
28-Aug-2023
, DOI: 10.4172/2329-6895.11.4.564
Citation: Liu, HC, Chen HH, Hsu MH and Lee KH, et al. "Concentration Dependency of Characteristic Times in the Reactions between Protein and Antibody-functionalized Magnetic Nanoparticles via Immunomagnetic Reduction." J Neurol Disord. 11 (2023):564.
Copyright: © 2023 Huei-Chun Liu, et al. This is an open-access article distributed under the terms of the creative commons attribution license which
permits unrestricted use, distribution and reproduction in any medium, provided the original author and source are credited.
Immunomagnetic Reduction (IMR) is an ultrasensitive assay for low-concentrated circulating proteins associated with diseases, such as cancers, inflammation, preterm birth, and neurodegenerative diseases. In addition to exploring clinical utilities, investigations of the chemical kinetics of the associations between biomarker molecules and nanoparticles in IMR have attracted much interest. To this end, the real-time alternating current (AC) magnetic signal, χ ac, of the reagent after being mixed with a sample was recorded, i.e., χac -t curve. Total tau protein (T-Tau), which is associated with neurodegenerative diseases, was used as a representative biomarker. Detailed characterizations, such as characteristic times in the χac -t curve, instant reaction rates, and orders of reactions, were investigated in this work. In particular, the effect of the concentration of the biomarker (T-Tau) on these parameters was explored. The results show that the nanoparticle-biomolecule association consists of two steps: Diffusion and binding. The time to initiate the binding step decreases as the T-Tau concentration increases, but the time to finish the association increases. During the binding step, the instant reaction rate reaches a maximum before the first half of the binding step is completed. The period of the second half is longer than the first half by 65% to 112%. Furthermore, the nanoparticle-biomolecule association is found to be a first-order reaction. The contributions of various factors, such as the collision frequency, surface energy barrier, substrate mobility, numbers of nanoparticles/molecules, etc., are discussed to clarify the chemical kinetics of the reactions in the IMR assay.
Chemical kinetics • Antibodies • Total tau protein • Immunomagnetic reduction
With the demands of ultrasensitive assays for early diagnosis, many technologies have been developed to quantitatively detect low-concentrated circulating proteins associated with diseases [1-5]. Authors have demonstrated the feasibility of assaying circulating proteins or biomarkers at levels of pg/ml or lower using so-called immunomagnetic reduction (IMR) [6-10].
In IMR, the reagent consists of dextran-coated magnetic Fe3O4 nanoparticles, which are dispersed in phosphate-buffered saline (PBS) solution and functionalized with antibodies [1]. The mean diameter of the nanoparticles ranges from 50 nm to 60 nm. The magnetic concentration of the reagent is 10 mg-Fe/ml. With the aid of IMR analyzers, alternating current (AC) magnetic fields are applied to the reagent to oscillate the nanoparticles [11]. The reagent generates AC magnetic signals due to nanoparticle oscillation. The AC magnetic signal at the frequency, fB, corresponding to the Brownian relaxation of nanoparticles is detected with a high-Tc Superconducting- Quantum-Interference-Device (SQUID) magnetometer [12]. After mixing a sample with the reagent, the biomarker molecules in the sample bond with antibodies on magnetic nanoparticles. The binding increases the mean diameter of the nanoparticles, leading to the depression of the AC magnetic signal, χac, at fB. Thus, the χac of the reagent at fB reduces after the associations between biomarker molecules and nanoparticles.
Circulating biomarkers associated with cancers, inflammation, preterm birth, neurodegeneration diseases, etc., have been successfully assayed using IMR [6-10,13,14]. Good-clinical-practice-graded clinical trials have been completed for assaying serum carcinoembryonic antigen to assess colorectal cancer and plasma amyloid β peptides and total tau protein (T-Tau) to assess Alzheimer’s disease [15,16]. The clinical uses of IMR have been approved in Taiwan and Europe. More clinical applications for various intended uses of IMR are under development.
In addition to exploring the clinical utility, investigations on the chemical kinetics of the associations between biomarker molecules and nanoparticles in IMR have attracted much interest. To this end, the real-time χac of the reagent after being mixed with a sample was recorded, i.e., χac-t curve. Total tau protein (T-Tau), which is associated with neurodegenerative diseases, was used as a representative biomarker in a previous study [17]. The χac-t curve was found to involve two steps: Diffusion and binding. The association rate was proportional to the concentration of T-Tau. In this work, detailed characterizations, such as times for diffusion and binding, instant reaction rates, and orders of reactions, were investigated with the χac-t curve. In particular, the effect of the concentration of the biomarker (T-Tau) on these parameters was explored.
Samples were prepared by spiking T-Tau proteins (T7951, Sigma-Aldrich) in pH-7.4 phosphate-buffered saline (PBS) solution. T-Tau solutions of 0.1, 1, 10 and 100 pg/ml were prepared. The reagent (MF-TAU-0060, MagQu) for assaying the T-Tau solutions consisted of antibody against T-Tau and functionalized magnetic nanoparticles homogeneously dispersed in pH- 7.4 PBS solution. The concentration of reagent was 10 mg-Fe/ml. The mean diameter of antibody-functionalized magnetic nanoparticles was approximately 55 nm, as measured by dynamic laser scattering (SZ-100, Horiba).
In each measurement, 80 μl T-Tau solution was mixed with 40 μl reagent. The real-time signals of the AC magnetic susceptibility, i.e., the χac-t curve of the reagent during the nanoparticle-biomolecule association, were recorded with an IMR analyzer (XacPro-S, MagQu). Duplicate measurements of the χac-t curve of the reagent during nanoparticle-biomolecule association were performed for each sample.
A typical χac-t curve of the reagent during the nanoparticle-biomolecule association is plotted in Figure 1. The dots in Figure 1 are experimental data for the 0.1 pg/ml T-Tau sample. In the first seventy minutes, the χac signals remain almost unchanged. However, the χac signals decrease after seventy minutes and reach another plateau after 200 minutes. A clear reduction in the χac signals of the reagent due to the nanoparticle-biomolecule association is observed in Figure 1. The data points could be well fitted to the logistic function.
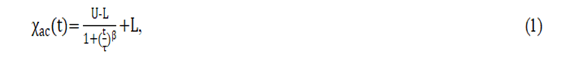

Figure 1. χac-t curve of the reagent during the nanoparticle-biomolecule association in case of 0.1 pg/ml T-Tau. The dots are experimental data. The solid line is the fitting curve of Equation (1).
Where U, L, τ and β are fitting parameters. The fitting curve is plotted as the solid line in Figure 1, with U, L, τ and β equal to 998.6, 968.8, 124.1 and 5.13, respectively. U and L in Equation (1) denote the χ¬ac value of the plateaus before and after the nanoparticle-biomolecule association. The values of the fitting parameters for T-Tau samples of 0.1, 1, 10 and 100 pg/ ml were explored in Ref [17].
The instance reduction in the χac signals of the reagent, the so-called instant IMR signal, due to the nanoparticle-biomolecule association at time t is calculated via

The IMR signals versus time for T-Tau samples of various concentrations are shown in Figure 2. For a given concentrated T-Tau sample, the instance IMR signal starts at zero and then increases in response to the IMR signal, finally reaching a saturated value of IMR%. A higher value was obtained for the saturated IMR% at a higher T-Tau concentration. In addition, the IMR signal increases from zero at an earlier time as the T-Tau concentration increases. To explore and compare the features of chemical kinetics for the nanoparticle-biomolecule association in Figure 2 among T-Tau concentrations, the time-dependent IMR signals for every T-Tau sample in Figure 2 are scaled to have its saturated IMR% be 100 via


Figure 2. IMR signals calculated via Equation (2) versus time for T-Tau samples of various concentrations from 0.1 vpg/ml to 100 vpg/ml.
Notably, the different values of the saturated IMR% in Equation (3) are used for various concentrated T-Tau samples, according to the results in Figure 2. The time-dependent IMRs% is plotted in Figure 3. The times to have 5% for IMRs%, denoted as t5%, is defined as the starting point for initiating nanoparticle-biomolecule association, while the time to have 95% for IMRs%, denoted as t95%, is defined as the endpoint of completing nanoparticle-biomolecule association. The time to have 50% for IMRs%, denoted as t50%, is defined as the middle point of the nanoparticlebiomolecule association. The 5%, 50% and 95% IMRs% are labeled with dotted lines in Figure 3. Values of t5%, t50% and t95% for T-Tau samples of 0.1, 1, 10 and 100 pg/ml can be found in Figure 3, as plotted in Figure 4 (t5%: ■, t50%: x, t95%: ●).

Figure 3. Real-time scaled IMR signals, IMRs% calculated via Equation (3) for T-Tau samples of various concentrations from 0.1 pg/ml to 100 pg/ml.
The t5% decreases from 77 to 54 minutes as the T-Tau concentration of the samples increases from 0.1 pg/ml to 100 pg/ml. Moreover, t95% increases from 203 minutes to 278 minutes. However, t50% is almost independent of the T-Tau concentration (~125 minutes). These results reveal that the biomolecular concentration manipulates the starting points and endpoints of the nanoparticle-biomolecule association in the IMR assay but the middle point.

Figure 4. T-Tau concentration dependent characteristic times, t5%, t50% and t95%, in the reactions between antibody-functionalized magnetic nanoparticles and T-Tau samples of 0.1 pg/ml, 1 pg/ml, 10 pg/ml and 100 pg/ml.
For a given concentration of T-Tau in Figure 3, clear elevations in IMR signal initiation are observed after a delay, i.e., t5%. This phenomenon indicates that two steps are involved in the association between nanoparticles and biomolecules: Diffusion and binding. The diffusion step is the period of the time interval from zero to t5%. The binding step is the period of the time interval from t5% to t95%.
Nanoparticles and biomolecules in PBS solution need time to diffuse and approach each other for collisions. The driving forces for diffusion are mainly Brownian motion, which depends on the viscosity, temperature, and electric forces between antibodies on nanoparticles and biomolecules [18,19]. In the binding step, effective collisions are needed to achieve the association between nanoparticles and biomolecules. The temperature and surface binding energy barrier on the nanoparticles are the main factors for effective collisions [20-24].
In this work, for various concentrations of T-Tau samples, associations occurred at the same temperature with the same nanoparticles and PBS solution. The key difference was the concentrations of T-Tau molecules. The T-Tau samples of higher concentrations contain more biomolecules, which leads to a higher frequency of collisions between nanoparticles and biomolecules. According to Arrhenius’s equation the effective reaction is proportional to the collision frequency [20,25]. Thus, the period of the diffusion step would be shortened for T-Tau samples of higher concentrations. As a result, t5% decreases at higher concentrations of T-Tau samples, as shown in Figure 4.
In chemical reactions, the inverse of t5% usually denotes the rate to initiate the binding step. Figure 5 plots the 1/t5% versus T-Tau concentration. The relationship can be fitted to the logarithmic equation
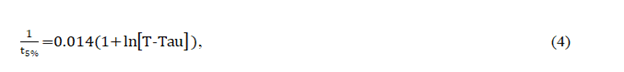
Where [T-Tau] denotes the T-Tau concentration in pg/ml and t5% is in minutes. This equation implies that initiation of the binding step in the IMR assay can be rapidly accelerated as the concentration of reactants increases, followed by slow increases at higher concentrations. In the case of ng/ml concentrations for T-Tau, e.g., 10 ng/ml, 1/t5% equals 0.0216 via Equation (4), which results in 46.2 minutes for t5%. Therefore, 46 minutes are needed to initiate the binding step after mixing the reagent with the 10 ng/ml T-Tau sample in the IMR assay. This time is much longer than that needed for other assay technologies, such as Enzyme-Linked Immunosorbent Assay (ELISA) and Surface Plasma Resonance (SPR). This delay in the diffusion step may be due to the strong surface-binding energy barrier on magnetic nanoparticles because nanoparticles 55 nm in diameter oscillate at 20 kHz during the diffusion step [26,27]. This strong surface binding energy barrier of nanoparticles significantly suppresses the effective collision for associations between nanoparticles and biomolecules. In addition, the substrates of antibodies, i.e., nanoparticles, are not fixed in the IMR assay. In other words, nanoparticles are moveable in the IMR assay, which may also suppress the effective collision for associations between nanoparticles and biomolecules. Therefore, the IMR assay is characterized by longer periods at the diffusion step than other assay technologies. The details need to be further explored in future studies.

Figure 5. Rate to initiate the binding step, 1/t5%, versus T-Tau concentration.
The t50% shown in Figure 4 is nearly T-Tau concentration independent. The result strongly implies that only two distinct stages occur during the association of T-Tau molecules, the so-called two-stage model [28,29]. One is the free-form stage, during which associations with nanoparticles do not occur, and this stage does not contribute to the reduction in χac signals of the reagent. The other is the bound-form stage, in which T-Tau molecules bind with antibodies on nanoparticles, which results in IMR signals.
In Figure 4, t95% increases with increasing T-Tau concentration. The difference between t95% and t5% denotes the period of nanoparticlebiomolecule association. The ratio of [T-Tau]/(t95%-t5%) denotes the reaction rate R of the IMR assay. The reaction rate has been demonstrated to be proportional to [T-Tau] via R=0.0045 [T-Tau]. Thus, the IMR assay is the first-order reaction for T-Tau, which implies that only one T-Tau molecule is involved in nanoparticle-biomolecule association. Then, the numbers of nanoparticles involved in nanoparticle-biomolecule associations were investigated.
In the IMR assay, 80 μl of 10 mg-Fe/ml reagent was used for one measurement. Thus, 80 μl of reagent contains 0.8 mg Fe. The mean diameter of the nanoparticles in the reagent was approximately 55 nm. The mean volume of each nanoparticle was (4/3) π (55 × 10-7/2)3 cm3. The nanoparticles consisted of Fe3O4 and a negligible amount of dextran and antibodies by particle weight. The density of Fe3O4 was 5.18 g/cm3. Each nanoparticle was (4/3) π (55 × 10-7/2)3 × 5.18 × 103=4.51 × 10⁻¹³ mg in mass, and the Fe content was 4.51 × 10-13 × (55.8 × 3)/(55.8 × 3+16 × 4)=3.26 × 10⁻¹³ mg. Hence, 80 μl of reagent contained approximately 2.5 × 10¹² nanoparticles.
For the 100-pg/ml T-Tau sample, the volume of the sample was 40 μl for one IMR measurement. The molecular weight of T-Tau is 55 kDa-62 kDa. Thus, the sample can be estimated to contain (40 × 10-3 × 10-13/60000) × 6 × 1023=4 × 10⁴ T-Tau molecules. The 0.1-pg/ml (10-13 g/ml) T-Tau sample contained 4 × 10⁴ T-Tau molecules. Thus, the number of nanoparticles is 108-1012-fold that of T-Tau molecules. Consequently, two T-Tau molecules are unlikely to simultaneously bind to one nanoparticle. In a nanoparticle-biomolecule association, only one nanoparticle should be involved. Therefore, the IMR assay is a first-order reaction for antibodies/nanoparticles.
Notably, the fact that t50% was nearly constant for various T-Tau concentrations, as shown in Figure 4, reveals that the association of T-Tau molecules occurs in only two stages: The free and bound forms. Because it is a first-order reaction, the bound form of T-Tau molecules consists of only one-to-one associations, i.e., one T-Tau molecule to one nanoparticle. Hence, the T-Tau molecules exist in either a free form or a one-to-one bound form during the process of biomarker-nanoparticle association in the IMR assay.
Based on the IMRs% versus time plotted in Figure 3, the growth speed (GS) in IMRs% at time t can be calculated via
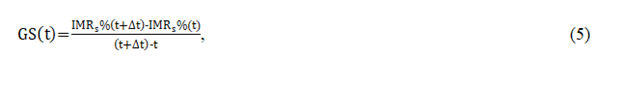
Where Δt is the time difference between two neighboring calculated IMRs% in Figure 3. The numerically calculated GS as functions of time for various concentrations of T-Tau samples are shown in Figure 6. A maximal value for GS, denoted GS, max, exists for a given concentration of T-Tau sample, as labeled with an arrow in Figure 6. The time corresponding to GS, max is denoted as tGS,max. The results in Figure 6 reveal that the growth speed of IMRs% increases as the nanoparticle-biomolecule association is initiated. The growth speed continues to increase as time reaches tGS,max. Although IMRs% continues to increase, the growth speed slows after tGS,max, finally reaching zero as the reaction is finished.

Figure 6. Growth speed (GS) in time dependent scaled IMR signals as functions of time for various concentrations of T-Tau samples.
Since the IMR signals result from the association between nanoparticles and biomolecules, the growth speed of IMR signals presents the instantaneous reaction rate at the binding step. According to Figure 6, the instantaneous reaction rate increases at the beginning, reaches a maximal value, and then decreases to zero during the binding step. The tGS,max versus T-Tau concentration is plotted with ▲ in Figure 4. The tGS,max was found to decrease from 117 minutes to 106 minutes as the T-Tau concentration increased from 0.1 pg/ml to 100 pg/ml. Notably, for a given T-T concentration, tGS,max is less than t50%. The instantaneous reaction rate reaches a maximum before finishing 50% of the reaction. In addition, the instantaneous reaction rate decreases in the second half (IMRs%: 50% to 95%) of the binding step. The time to finish the second half, i.e., t95%-t50%, is much longer than that to finish the first half (IMRs%: 5% to 50%), i.e., t50%-t5%. The ratio of t95%-t50% to t50%-t5% was calculated according to the results in Figure 4 to be 1.65 for 0.1 pg/ml T-Tau, 1.99 for 1 pg/ml T-Tau, 2.05 for 10 pg/ml T-Tau and 2.12 for 100 pg/ml T-Tau.
The effect of biomolecular concentration on the characteristic times related to the real-time signals for assaying T-Tau using IMR was explored. The nanoparticle-biomolecule association consists of two steps: Diffusion and binding. The time to initiate the binding step decreases as the T-Tau concentration increases, but the time to finish the association increases. During the binding step, the instantaneous reaction rate is not fixed. Instead, the instantaneous reaction rate reaches a maximum before the first half of the binding step is completed. The second half of the reaction is longer than the first half by 65% to 112%. Furthermore, the nanoparticle-biomolecule association was found to be a first-order reaction. Contributions of factors such as collision frequency, surface energy barrier, substrate mobility, and the numbers of nanoparticles/molecules were discussed to clarify the chemical kinetics of the reactions in the IMR assay.
This work was supported by MagQu Co., Ltd. We thank Wen-Yih Chen at National Central University in Taiwan for discussions about binding kinetics.
The authors declared no conflict of interest.
H.H. Chen, M.H. Hsu and K.H. Lee conducted the experiments. S.Y. Yang and H.C. Liu designed this study and analyzed the data. S.Y. Yang prepared the manuscript. All authors read and approved the final manuscript.
Neurological Disorders received 1343 citations as per Google Scholar report