Research Article - (2021) Volume 0, Issue 0
Received: 08-Jul-2021
Published:
29-Jul-2021
, DOI: 10.37421/2161-0525.2021.s6.002
Citation: Tesfaw, Senait Aklog . “Atomic Absorbtion
Spectrometric Determination of the Concentration of Fe, Mn, Pb and Cd in
Fruits of Mango, Avocado and Papaya from Gondar “Gebeya” Market Gondar,
Ethiopia.” J Environ Anal Toxico 11 (2021): 002
Copyright: © 2020 Tesfaw SA. This is an open-access article distributed
under the terms of the Creative Commons Attribution License, which permits
unrestricted use, distribution, and reproduction in any medium, provided the
original author and source are credited.
In order to assess the levels and impact of different trace metals on human health a study has been carried out to determine the levels of heavy metals present in commonly edible fruits available in local market of Gondar, city Ethiopia. For this purpose, total of three samples of different fruits were purchased. The study was conducted to determine the concentration of trace metals Fe, Mn, Pb, and Cd in fruits of Mango, Avocado and Papaya. The dried samples were digested in 4:2 mixtures of nitric acid (HNO3) and hydrogen per oxide (H2O2) by using flame atomic absorption spectrophotometer (FAAS). The studies average result were in range of, 50.0± 12.5 μg/g Fe, 20.825 ± 3.6 μg/g Pb, 27.77 ± 4.8 μg/g Cd 37.500 ± 0.02 μg/g Mn , For Mango , 22.075 ± 7.2 μg/g Fe, 14.57 ± 3.6 μg/g Pb, 21.00 ± 4.8 μg/g Cd, 0.17 ± 0.05 μg/g Mn, For Avocado, 23.075 ± 11 μg/g Fe , 14.57 ± 14.5 μg/g Pb, 19.47 ± 4.8 μg/g Mn, 37.500 ± 2.1μ g/g Cd For Papaya. The result of the study indicates that all types of fruits contain considerable concentration of trace metals. The concentrations of iron in all fruits were higher than other trace elements. But the amount of other metals such as Pb, Cd and Mn were significantly different from other studies and WHO/FAO recommended values this shows that the fruit farms around Gondar town was highly contaminated. Furthermore, the developed method was checked by using different method validation and recovery test and so the digestion procedure provides an easy method for the digestion of fruit samples and percent recovery obtained was above 95% with a very good LOD and LOQ values.
Digestion, Fruit, Trace metals, Toxic, Flame atomic absorption spectroscopy
The metal particles (ion or molecule) are normally found in human body. Heavy metals are entering to the human body through food (vegetable, Spinach-iron); air (inhalation of ultrafine particles) and water (ground water contains dissolved metal salts and minerals from earth strata). Once in the body they compete with essential minerals such as Mg and Ca, and interfere with the function of the organs. People may come in contact with trace metals in industrial work, pharmaceutical manufacturing and agriculture [1,2].
Heavy metals contamination represents a serious problem for human health and life in general. Cd, Hg and Pb are amongst the elements that have caused most concern in terms of adverse effects on human health. This is because they are readily transferred through food chains such as fruits and are not known to serve any essential biological function. As a result, the regular absorption of small amounts of these elements such as Pb, Hg and Cd may cause serious effects on the health of growing children, including retardation of mental development (e.g. reading and learning disabilities) and deficiencies in concentration, adverse effects on kidney function, blood chemistry and cardiovascular system, as well as hearing degradation [2].
Generally, most heavy metals are not biodegradable; having long biological half-life and have the potential for accumulation in the different body organs leading to un wanted side effects [3,4].Therefore, heavy metal needs serious attention before these metals are consumed by humans without knowing the maximum acceptable amount or threshold limit.
Contaminations of the environment by heavy metals with their potential effect on health, agriculture and natural ecosystem have a subject of worldwide concern. In Ethiopia, especially in the place where some fruits are found such as Bahir dar, Gondar, fruits have been used for human consumption without having knowledge of the content of essential and nonessential elements in some selected fruits. The problem to solve in this area of study is that, in our country Ethiopia, especially in Bahir dar city the amount of taking or eating fruits is not considering the amount of trace metals such as Fe, Mn, Pb, and Cd found in fruits. So if the society doesn’t have the information about the content of trace metals found in fruit they will take or eat fruits either above or below the daily allowance threshold value. So it is better to aware the society to be careful when they are eating fruits because trace metals have an effect if when we are taking too low or too high in their amount as a researchers investigate the effect [5].
Studies Shows that, global industrialization and human social and agricultural activities have an effect on environmental pollution and the global ecosystem [6]. Increasing industrialization and human activates intensified the emission of various pollutants has resulted in the development of numerous analytical procedures for selective and sensitive determination of heavy metals in the environmental samples. Although there is no clear definition of what a heavy metal is density is in most case taken to be the defining factor.
High lead level in human food chain is associated with development of abnormalities in children including: teratogens and mutagenesis [3,4]. Exposure of lead to young children, generally of the age below 5 years has been linked to low Intelligence Quotients and increased levels of blood pressure. Cadmium is known to be a bioaccumulation heavy metal whose target body organs include: reproductive system and bones. Cadmium has been classified as a probable carcinogen and as an endocrine disruptor [7].
Iron (Fe) is required for various highly complex actions that continuously happens on a molecular level and that are much needed for human life e.g. the transport of oxygen to the body [7,8]. Manganese (Mn) is very important for normal functioning of different body parts like brain and nerves International and national regulations on food quality have lowered the maximum permissible levels of toxic metals in food items due to an increased awareness of risks these metals pose to food chain contamination [9-14].
Several analytical techniques such as FAAS, GFAAS, Fame Photometry, etc have been applied on the determinations of heavy metals in water, soil and food stuffs. Even if the other instruments are more sensitive, FAAS is a very common and available technique for the determinations of metals and metalloids in the environmental sample to use. The technique is based on the fact that ground state metals absorb light at specific wavelengths. Metal ions in solution are converted to atomic state by means of a flame. Light of the appropriate wavelength is supplied and the amount of light absorbed can be measured against a standard curve [9-10]
Many analytical methods including atomic absorption spectrometry for trace element determination in water, soil and food stuffs require the decomposition of the sample. Wet and dry ashing procedures are the two main methods by which trace metals are digested in food sample. However, these procedures are slow and time consuming, result in analyst loss, and frequently done with a high risk of contamination. The wet digestion procedure requires the heating of a large volume of concentrated acid in an open beaker. Open vessel acid digestions one of the oldest techniques, are undoubtedly the most common method of sample decomposition of organic sample materials used in chemical laboratories [14-19].
From the reagents used for the oxidation of environmental samples,
HNO3 is the only acid which can be used alone. Perchloric acid is also a
very clean wet digestion reagent with a very high oxidation power. However,
for safety reasons, it should be used only in mixtures with other reagents.
Mostly used acid mixtures are HNO3 and HC
Acids in combination are prefers for certain inorganic matrices and are generally more advantageous for the decomposition of organic compounds [18-22]. During wet digestion, certain component of sample can be lost, leading to the underestimation of particular elemental contents. Trace elements can be lost by adsorption to the vessel walls, Volatilization, coprecipitation, and co-extraction [23].
ObjectivesGeneral objective: The main objective of this research is to assess some selected trace metallic elements, specifically Lead, Cadmium, Iron and Manganese in some selected fruits such as Mango, Avocado and Papaya from Gondar market
Specific objectives
The specific objective of this project work
• To determine the concentration of some selected trace metallic elements particularly Pb, Cd, Fe, and Mn in fruits from Gondar “Gebeya” market.
• To compare the results obtained with international standards and other researches.
• To evaluate the suitability of the fruits for eating purpose.
• To assess the developed procedure using method validation test.
• To encourage other researcher's to study on such health problems that can improve the aware of people on consumption of fruits
Scope of the study
This study consists of the determination of some selected trace metallic elements in fruit from Gondar market using Atomic Absorption Spectrometry (FAAS).
Significant of the study
The level of heavy metals in the environment has been seriously increased during the last few decades due to human activities [12- 14] .The use of water, soil and food stuffs such as fruits obtained from those environments as a result of human activities must undergo some measures to limit the possible chemical hazard. In this study some selected metallic elements in some fruits from Bahir dar market will determine. This assessment of the contamination status of the fruit from Bahir dar market is essential for the awareness of the people.
Sampling site
The required sample of fruit was collected from Gondar “Gebeya Arada” market which is near by PIAZZA as it is shown in the following sampling site. With reference to Gondar City Tourist Map (Credit: http://www.cartography. org.uk/).
Materials and chemicals
Plastic bags for sample transportation, refrigerator for sample preservation, analytical oven for drying samples(Model-101-0,Tianjin city, country of origin), mortar and pestle for grinding of fruit sample, digital analytical balance (Model-AA-200DS) for weighing samples, and for volume measurement volumetric flask, pipette, syringe, and measuring cylinder was used. Beaker, hot plate (Stuart Scientific SH3, UK), safety hood (ESCO FRONTIER), easy glass, flame atomic absorption spectrometry also used for sample processing activities. A flame atomic absorption spectrophotometer (Buck Scientific Model 210VGP AAS, Este Norwaik, U.S.A.), was used for measuring the concentration of metals in the sample solutions using airacetylene flame.
Chemicals, reagents and standards
Perchloric acid (HClO4 Qualikems, 60%, India), nitric acid (HNO3 UNIChem Qualikems, 65%-68% ,India) and hydrogen peroxide(H2O2 UNI-Chem Qualikems-30% ,India) was used for digestion of samples. De-ionized water also used for the preparation of all standard solutions. The working standard solution was Pb (Lead Wire, 99.99% pura tronic Afa Aesan Johnso Mathey Company-Germany), Cd (Cadmium Wire-99.99%, Aldrich Germany), Fe (Iron Wire- 99.99% PSPank Scientific limited, Uk) and Mn (Manganese Metal Powder-99.99% Win Lb-UK).
Apparatus cleaning
The borosilicate beakers, flasks and sample bottle were cleaned with detergent solutions and soaked 10% (v/v) nitric acid for 6 hrs, and finally rinsed with distilled water and were dry in oven.
Sample collection, preservation and handling
The fruit samples were collected from the Gondar “Gebeya Arada” market. Samples of fruit were taken by using plastic bag from different sampling site. All those fruits were collected and store in plastic bags and transport immediately to Gondar university Chemistry Laboratory room for analysis then those fruit samples were cleaned and preserve in refrigerator.
Drying and homogenization
In the laboratory the fruit was cleaned, peel and cut into very small pieces by knife. Following this the fruit samples were dried in an oven at 105°c overnight (24 hrs until constant weigh was achieved to remove all moistures) and were sieved using mesh stainless steel sieve and then homogenization was done using mortar and pestle.
Digestion of fruit samples
The digestion for fruit sample was done by using 1:2 (HNO3 and H2O2 ratio) modifying acid digestion developed by [13]. About 0.50 g of powdered fruit sample was taken and weighed in a balance and placed in a 100 ml and 4 ml nitric acid was added to a beaker containing samples and allowed to stand for 10 min. Then the beaker containing samples was heated in a heating apparatus by setting the temperature dial first at 4 (120 °C) for 10 min., then at 9 (270 °C) for 50 min., and continued heating at a temperature of 10 (300 °C) for 1 hour. After a total of 2 hours digestion, the sample was cooled for 10 min., and 2 ml of Hydrogen peroxide was added and then continued heating at a temperature of 10 (300 0C) for 1:30 hour. After a total of 3:30 hour digestion, the digested sample was allowed to cool for 10 mins and finally the digesting solution was filtered using watman filtered paper and the contents of the flask transferred to 50 ml of volumetric flak and filled with distilled water to the mark. Each fruit sample was digested in triplicate and hence a total of twelve digests were made for the fruit samples. In similar manner the digestion was repeated with the same ratios of acid mixture and the method blank are also done side by side, with the same temperature and time of digestion. Finally the digesting solution was stored in glass bottles in refrigerator [7]. Three reagent blank solutions were prepared similarly. All the digested samples were stored in refrigerator, until the levels of all the metals in the sample solutions were determined by FAAS [13].
Instrumentation
The Flame Atomic Absorption Spectrophotometer instrument A flame atomic absorption spectrophotometer (Buck Scientific Model 210VGP AAS, Este Norwaik, U.S.A.), model was used in this study. Instrumental condition such as pressure of fuel, oxidant and others were adjusted according to the Atomic Absorption Spectrophotometer. Instrument was calibrated by blank solution and finally analyzed metals content in the fruit.
Sample analysis
The measurement of the concentration of Pb, Cd, Fe and Mn were carried out using flame atomic absorption spectrophotometer. Cathode lamps of cadmium, lead, iron and manganese were used as a radiation source. Air acetylene gas mixture was used as source of flame. Maximum absorbance was obtained by adjusting the cathode lamps at specific slit and wave length as indicated below the Table 1.
| No. | Parameter | Wave length(nm) | Slit width(nm) | Lamp Current (mA) | Flame Type | Instrumental detection limit (ppm) |
|---|---|---|---|---|---|---|
| 1 | Pb | 217 | 0.7 | 6.0 | Air- Acetylene | 0.001 |
| 2 | Mn | 279.8 | 0.2 | 6.0 | Air- Acetylene | 0.01 |
| 3 | Cd | 228.8 | 0.7 | 4.2 | Air- Acetylene | 0.005 |
| 4 | Fe | 248.3 | 0.2 | 6.4 | Air- Acetylene | 0.031 |
The instrumental and sample blanks are also prepared in similar manner with standards and samples respectively and intensity of each analyte in the blank sample was subtracted from that of sample. Three replicate of each sample was measured, and the average mean concentration was calculated using Microsoft Excel 13.0 work sheet, The Apache Software Foundation, 2003).
Calibration standard preparation
Standard aqueous solution of different elements was used to calibrate the Flame Atomic Absorption Spectrometer. Each solution of the standard solution was prepared by de-ionized water and the samples were prepared by distilled water. For each of the metals Cd, Pb, Fe and Mn standards are used for the calibration of Atomic Absorption Spectrometer .The intermediate 10 mg/L working standard solutions was prepared from 1000 mg/L stock solution for each element. Then from these intermediate stock solution the working standards of the selected metals with appropriate rang of volume standards was prepared for each of the element [24].
The calibration curve plotted is the concentrations of the standard solutions versus absorbance values.
Determination of heavy metals
The instrument was calibrated using calibration blank and five series of working standard solutions of each metal to be analyzed. The digested samples were determined for the concentrations of heavy metals (Fe, Mn, Cd, and Pb) using flame atomic absorption spectrophotometer. Final concentrations of the metals in the fruit samples were calculated using the following formula [25].
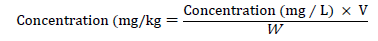
Where V=Final volume (50 ml) of solution, and W=Initial weight (0.5 g) of sample measured.
Method validation
Quantitative methods for determination of trace metals in fruit require the following set of validation parameters to be determined such as
• Recovery test Limit of Detection
• Limit of Quantification
• Accuracy and Precision was determined [26-29].
Recovery test
Method validation is the process of providing that analytical method is acceptable for its intended purpose. To determine the reliability of the method for the analysis of the samples for Fe, Cd, Mn, and Pb. Certified Standard Reference Materials (CSRM) were not available for use; instead spiking method was adopted using digestion method [30-33].

Spiking experiment
500 μL of Fe, 50 μL of Cd and 25 μL of Mn were drawn with graduated pipette and used to spike 2 g of fruit sample at once in a round bottomed flask and then the sample were digested as used for original sample.
Similarly, 25 μ L of Pb standard solution were used to spike 2 g of Avocado sample at once in a round bottomed flask and then the sample were digested as used for original sample. Then the digestate were transferred in to a 50 mL volumetric flask and diluted up to the mark with deionized water. Finally the solutions were analyzed for each element with atomic absorption spectrophotometer. As used for original samples triplicate spiked samples were prepared and triplicate readings were recorded.
Method detection limit
Limit of detection is the smallest mass of analyte that can be distinguished from statistical fluctuations in a blank, which usually corresponds to the standards of the blank solution times a constant. The limit of detection is most commonly defined as the mass of analyte that gives a signal equal to three times the standard deviation of the blank [33,34].
Three reagent blank samples were digested following the same procedure as the samples and each of the samples were determined for the elements of interest (Fe, Cu, Mn, and Pb) by the atomic absorption spectrophotometer. The pooled standard deviation for each element was calculated from the three reagent blank measurements to determine method detection limit.
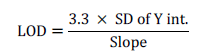
Calculating of LOD and LOQ is based up residual of SD of regression line or it can also be calculated based up on standard deviation of y intercept of regression line. So for this analysis the second method was used and so it can be calculated using the following formula [31].
.
Limit of quantification
LoQ is the lowest concentration at which the analyte can not only be reliably detected but at which some predefined goals for bias and imprecision are met. The LoQ may be equivalent to the LoD or it could be at a much higher concentration [3].
Optimization of the digestion procedure
For fruit samples different digestion procedures using HNO3 and H2O2 acid mixtures were assessed by varying volume of the acid mixtures, digestion time and temperature and the amount of sample Table 2.
| Amount of fruit sample | Reagent volume | Temperature and digestion time | Color of the digestate | Remark |
|---|---|---|---|---|
| 1g | 6:2 Ratio HNO3, H2O2 Respectively | 120 °c /10min, 270 °c/50 min, 300 °c/1:00 hr. and 300 °c/1:30 hr. | Yellow | Not much clear |
| 4:2 Ratio HNO3, H2O2 Respectively | 120 °c /10min, 270 °c/50 min, 300 °c/1:30 hr. and 300 °c/1:30 hr. | Light yellow | ||
| 3:1 Ratio HNO3, H2O2 Respectively | 120 °c /10min, 270 °c/50 min, 300 °c/1:30 hr and 300 °c/1:30 hr. | Light yellow. | ||
| 0.5g | 6:2 Ratio HNO3, H2O2 Respectively | 120 °c /10min, 270 °c/50 min, 300 °c/1:00 hr. and 300 °c/1:30 hr. | Very light yellow | Clear solution |
| 4:2 Ratio HNO3, H2O2 Respectively | 120 °c /10min, 270°c/50 min, 300°c/1:30 hr. and 300°c/1:30 hr. | Very Clear Solution | ||
| 3:1 Ratio HNO3, H2O2 Respectively | 120 °c /10min, 270°c/50 min, 300 °c/1:30 hr and 300 °c/1:30 hr. | Clear solution |
Calibration curve
A series of four working standards were prepared from the stock standard solutions of 1000 mg/L by diluting with deionized water for each metal as shown in, Table 3 and a calibration cure was plotted for each metal to determine their concentration in fruit samples. The calibration curve for Mn, Cd, Fe and Pb are showed in the Figure 1 and Table 3.

Figure 1. The calibration curve for Mn, Cd, Fe and Pb.
| Element | Concentration of stock standards of solutions in mg/L | Concentration of series of standards of solutions in mg/L | correlation coefficients of the calibration curves |
|---|---|---|---|
| Cd | 1000 | 0, 0.5, 1, 1.5, 2.0. 2.5 | 1 |
| Pb | 1000 | 0, 0.5, 1, 1.5, 2.0,2.5 | 0.999 |
| Fe | 1000 | 0, 2.0, 4.0, 6.0, 8.0, 10 | 0.999 |
| Mn | 1000 | 0, 1.5, 2.0, 2.5, 3.0, 3.5 | 1 |
Determination of metal in fruit samples
Since R was greater than 0.995 for all metals, calibration curves were linear within the analytical range. Fruits are important source of nutrients and offer advantage over dietary supplements, because of low cost and wide availability. The concentration of elements namely Cd, Pb, Mn and Fe in the samples collected from Arada market was determined by FAAS and the results are shown in Table 4. The metals (Cd, Pb, Mn, Fe) investigated in this study were detected in all fruit samples. The fruit sample had high concentration of Fe>Mn>Cd> Pb in mango fruits and Mn>Fe>Cd> Pb in papaya and also for avocado similar to papaya as shown in Table 4.
| Element | Fruit Samples (µg/g) | |||
|---|---|---|---|---|
| Mango | Avocado | Papaya | ||
| Fe | 50.000 ± 12.5 | 22.075 ± 7.2 | 23.075 ± 11 | |
| Pb | 20.820 ± 3.6 | 14.57± 3.6 | 14.57 ± 14.5 | |
| Cd | 27.770 ± 4.8 | 21 ± 4.8 | 19.47 ± 4.8 | |
| Mn | 37.500 ± 0.0 | 37.500 ± 12.5 | 37.500 ± 2.1 | |
The content of iron in fruit of mango was higher than other elements. It was found highest in mango that is 50.000 ± 12.5 μg/g. The relatively excess amount of iron in fruits of mango, papaya and avocado are due to its higher natural abundances of iron in the soil. Mn concentration is higher as compared to other metals in the fruit samples. But the excess amount of manganese may be due to some modern agricultural activities such as fertilizers and pesticides.
Comparison of the metal content of fruit samples with other reported values and maximum permissible levels (who/fao)
The detection of some heavy metals of Fe, Mn, Pb and Cd in fruit samples in the populated area of Gondar Arada market was performed to assess the levels of the contents of these selected metals. Table 3 gives the WHO/FAO threshold values for fruit trace elements. The heavy metal concentration in the fruit samples collected from Arada market was compared with these threshold values and other reported values. Accordingly, higher values of concentration of the studied metals were found than the maximum limit set by WHO/FAO except that of the iron in mango sample. Comparison with other literature values in most of the case, the concentration of some selected metallic elements in the current study were higher than the reported values as shown in the Table 5 below except that of Fe and Pb in mango samples which is lower than [15].
| E | TSAC(µg/g) | (Mahdayian , et al., 2008) (µg/g) | (Zahir et al., 2009) | Other (µg/g) | Permissible values (µg/g) |
| Mango | (µg/g) | ||||
| Fe | 50.000 ± 12.5 | 37.16 | 67.0 ± 2.394 | 189.31b | 75 |
| Pb | 20.820 ± 3.6 | 67.2 | 16.9±0.932 | 1.824 ±0.821a | 0.3 |
| Cd | 27.770 ± 4.8 | 16.9 | nd | 0.362±0.03 a | 0.1 |
| Mn | 37.500 ± 0.0 | 11.59 | nd | 39.31 b | 5 |
All values are the maximum recommended permissible limit, E = element, nd = Not Detected, TSAC = this study average concentration a[2], b[15].
In this study the concentration of Cadmium and lead were found maximum in mango fruit samples as compared as maximum permissible levels set by WHO/FAO [17] and other researcher values as shown in Table 3, But Fe and Mn were found to be lower than other literature values. Table 6, Comparison of the mean concentration of metals in Avocado samples with other recommended (WHO/FAO) values and other publication.
| E | TSAC(µg/g) | (A.T. Wodaje 2015) | Guerra et al., 2009) | Other (µg/g) | Permissible values (µg/g) |
| Avocado | (µg/g) | (µg/g) | |||
| Fe | 22.0750 ± 7.2 | 3.82 ± 0.07 | - | 24.67a | 75 |
| Pb | 14.820 ± 3.6 | 0.09 ± 0.01 | 0.04 | ndb | 0.3 |
| Cd | 19.770 ± 4.8 | nda | 0.04 | nd b | 0.1 |
| Mn | 37.500 ± 12.5 | 2.33 ± 0.03 | - | 4.79 a | 5 |
Here In general, the concentration of metals observed in Avocado sample were much greater than the reported literature values as well as maximum permissible levels set by the WHO/FAO except the concentration of iron which was more or less comparable with the reported values and WHO/FAO [17]. However, relatively lower concentration of iron in avocado was observed in this study in the comparison to the reported values Table 7.
| E | TSAC(µg/g) | (A.T. Wodaje 2015) | Guerra et al., 2012) | Other (µg/g) | Permissible values (µg/g) |
|---|---|---|---|---|---|
| Papaya | (µg/g) | (µg/g) | |||
| Fe | 29.0750 ± 7.2 | 9.02 ± 0.08 | - | 0.05 | 75 |
| Pb | 14.520 ± 3.6 | 0.16 ± 0.06 | 0.4 | ndb | 0.3 |
| Cd | 19.470 ± 4.8 | Nd | 0.02 | nd b | 0.1 |
| Mn | 37.500 ± 12.5 | 1.20 ± 0.05 | - | 93.79 a | 5 |
All values are the maximum recommended permissible limit, E = element, TSAC = this study average concentration a[28] b[1], b[17]
Similarly in the fruit of Papaya the concentration of iron was less than the reported values of WHO/FAO [17]. However, relatively higher concentration of cadmium, lead and manganese were observed as compared with both the WHO/FAO and other literature values. The relatively high level of heavy metals in samples collected from Gondar market may be due to that samples in this area comes from different farm places around Gondar town, the sources of production of the fruits is unknown and the other reason may be contamination at the time of transportation.
Method validation
Validation of the optimized procedure: A recovery test of the total analytical procedure was performed for all of the selected metals in selected samples (Avocado and Mango) by spiking analyzed samples with aliquots of metal standards and then reanalyzing them. As can be seen from Table 6, acceptable recoveries (>95%) were obtained for the analyzed metals Table 8.
| Element | Amount before Addition of the | Amount added (µg/g) | Amount found after spike of the | % Recovery |
| standard (µg/g) | standard (µg/g) | |||
| Fe | 50.000 ± 12.5 | 10 | 56.88 ± 8.83 | 113.5 |
| Cd | 27.770 ± 4.8 | 1 | 28.112 ± 3.2 | 101.23 |
| Pb | 20.820 ± 3.6 | 0.5 | 20.996 ± 2.56 | 100 |
| Mn | 37.500 ± 0.0 | 0.5 | 37.998 ± 1.091 | 99.7 |
Values are average value of triplicate samples and three readings in µg/g, Values are mean ± SD of triplicate readings of triplicate analysis in µg/g.
Thus, on the average good recoveries were obtained for all elements in the sample validating that the optimized procedure has good accuracy.
Method detection limit
Method detection limit is defined as the minimum concentration of analyte that can be measured by the analytical method with a given confidence limit [11-14] Table 9.
| Metal | Method detection limits (µg/g). (LOD) | SD of y - intercept of regression line | Instrumental detection limit(µg/g) |
|---|---|---|---|
| Fe | 10.4355 | 0.007905694 | 0.031 |
| Mn | 3.086867 | 0.001870829 | 0.01 |
| Cd | 3.086867 | 0.001870829 | 0.005 |
| Pb | 2.60887907 | 0.001581139 | 0.001 |
Method limit of quantification
The LOQ may be equivalent to the LOD or it could be at a much higher concentration. And here form the table the value of the limit of quantification is much greater than what was calculated LOD value Table 10.
| Metal | Limit of Quantification (µg/g) (LOQ) | SD of y - intercept of regression line | Instrumental detection limit(µg/g) |
|---|---|---|---|
| Fe | 31.62277 | 0.007905694 | 0.031 |
| Mn | 9.354143 | 0.001870829 | 0.002 |
| Cd | 9.3541 | 0.001870829 | 0.005 |
| Pb | 7.9056914 | 0.001581139 | 0.001 |
Here from the table 10, LOQ is much higher than LOD this shows that the method is valid
From the results obtained in this study, it can be concluded as follows firstly fruits and vegetables are contacting variable level of trace metals based up on their area of growing and the study reveals that there was heavy metal contamination of fresh fruits grown in around Gondar town fruit farms. When the results of this study compared with similar studies from other published works, the levels of heavy metals were observed to be higher than those of previous published works and WHO/FAO except the concentration of Fe which was comparable with the reported values and WHO/FAO in Mango fruit and lower in other fruits (papaya and avocado). From this the consumption of these fruit and vegetables as food may pose possible health hazardous to human and animal at a time of the study. Growers of the fruit in the area should be educated on the needs to grow crops with safe levels of these metals. In addition the digestion procedure provides an easy method for the digestion of fruit samples and percent recovery obtained was above 95% and the study reveals that a very good method validation analysis values.
The entire author (s) has not declared any conflicts of interest.
The author gratefully acknowledge university of Gondar department of Chemistry for providing financial support and the laboratory facilities and Bahir Dar University, Ethiopia.
Environmental & Analytical Toxicology received 6818 citations as per Google Scholar report