Research Article - (2021) Volume 6, Issue 10
Received: 08-Oct-2021
Published:
29-Oct-2021
, DOI: 10.37421/2573-0347.2021.6.227
Citation: Raj M, Preethi, Prabakar J. “Assessment of Taboos in Dentistry and Oral Health Behaviours among Adult People of Chennai’’. Adv Practice Nurs 6 (2021): 227
Copyright: © 2021 Jayashri Prabakar. This is an open-access article distributed under the terms of the Creative Commons Attribution License, which permits unrestricted use, distribution, and reproduction in any medium, provided the original author and source are credited.
Introduction: In this modern world of technology, advanced dental treatment takes place where few myths and taboos regarding dentistry and oral health behaviours still occur. Taboos vary with age, gender, level of education of living. Therefore, the aim of the study is to assess the taboos and myths related to dentistry and oral health behaviours. Materials and Methods: A descriptive cross sectional study was conducted in the Saveetha Dental College and Hospital (Saveetha University) where the total sample size arrived was 136.The study population contains adult male and female patients over the age of 20 approached for dental treatment. Ethical approval was obtained from the Institutional Review Board in Saveetha University. The first part of the questionnaire contains demographic details which include age, gender and the second part of the questionnaire contains knowledge, attitude and practice towards taboos and myths on dentistry and oral health behaviours. Simple random sampling technique was followed. Data will be entered in Microsoft Excel Sheet and analysed using SPSS software (IBM Software version 23; NY). Descriptive statistics was expressed by means of number and frequency and percentage and the chi square test was used to find out association between variables. Level of statistical significance will be P<0.05. Result: In the study conducted, 41.18% visit dental clinics once in a year. 52.21% of people brush twice a day. 49.26% use toothpaste and toothbrush as the aid for cleaning teeth.30.88% of females and 22.06% of males believe that extraction of upper teeth causes fever. 46.32% of females and 27.94% of males suggest that cloves can be used to ease tooth pain. Pearson’s chi square value: 4.973, p value: 0.026, (p<0.05) hence statistically significant, providing females believe in more taboos and myths compared to males. Conclusion: From this study, it is concluded that females believe in more taboos and myths compared to males.
Dentistry • Myths • Oral health • Taboos • Innovative analysis
To assess the knowledge and awareness in dentistry and oral health behaviours among the adult population of Chennai, this study was performed [1]. The prime importance of the study work is to understand the taboos, myths and misconceptions on oral diseases [2]. This research provides both care and health education to normal (healthy) individuals and patients [3]. Public people’s expectations regarding health care have increased. These taboos don't provide needed information that healthcare is ready to be qualified dentist professionals or go to the spiritual treatments [2,4,5]. Dentists usually face many taboos and myths related to dentistry and oral health behaviour which have unwanted or untested beliefs that get passed from one generation to another generation [6]. Taboos and myths are referred to as beliefs from unknown origin (narratives and stories) [7,8].
Different religions, cultures follow their own kind of ideologies, misconceptions about oral diseases and its treatments [9]. A taboo is a very strong prohibition related to social customs that is forbidden based on religious beliefs [10,11]. Similarly, a myth is a false belief or an imaginary or fictitious understanding which has no relevance to reality [12]. Myths and taboos are most prevalent due to poor education, beliefs of cultures, misconceptions [13]. It is important to understand the myths and taboos to provide good health education and care to the public people [14]. Learned behaviour that is socially acquired is culture [15]. Through the learning process, few myths are transferred from one generation to another generation [16].
This research is needed to find the association between taboos related in dentistry and adult oral health behaviour [17]. This study fulfills the deficiency by providing data on taboos in dentistry for preparing strategies for its prevention and management [18]. Our team has extensive knowledge and research experience that has translate into high quality publications [1,2,5,6,11,15,18- 31]. The aim of this study is to assess the taboos in dentistry and oral health behaviour among adult people of Chennai. Null hypothesis states that there is no difference in the level of knowledge and attitude of taboos in dentistry and oral health behaviours [20]. Alternate hypothesis states that there is a difference in the level of knowledge and attitude of taboos in dentistry and oral health behaviour.
Study Design and Study setting
A descriptive cross sectional study was conducted in the Saveetha Dental College and Hospital (Saveetha University).
Sample size estimation
Sample size was estimated using the manual calculation formula (N=ZαPq2) based on the study done by [12] and the total sample size arrived was 136.
Study Population
The study population contains adult male and female patients over the age of 20 approached for dental treatment.
Ethical Approval
Ethical approval was obtained from the Institutional Review Board in Saveetha University.
Data collection
The first part of the questionnaire contains demographic details which include age, gender and the second part of the questionnaire contains knowledge, attitude and practice towards taboos and myths on dentistry and oral health behaviours. Data collection can be done by means of online google survey forms. Independent variables will be age, gender and dependent variables will be knowledge and attitude about a patient's perception of dental health and care.
Sampling
Simple random sampling technique was followed.
Statistical analysis
Data will be entered in Microsoft Excel Sheet and analysed using SPSS software (IBM Software version 23; NY). Descriptive statistics was expressed by means of number and frequency and percentage and the chi square test was used to find out association between variables. Level of statistical significance will be P<0.05.
Figure 1 shows the percentage distribution on age wherein 20-30 years (62.5%), 31 - 40 years (15.44%), 41-50 years (11.03%) and above 50 years (11.03%). Figure 2 shows the percentage distribution on gender wherein females (61.76%), males (38.24%). Figure 3 shows the percentage distribution on frequency of visit to dentist wherein none (24.26%), once in a year (41.18%), routine checkup (22.06%) and twice a year (12.5%). Figure 4 shows the percentage distribution on frequency of tooth brushing wherein once (47.79%) and twice (52.21%). Figure 5 shows the percentage distribution on usage of fluoridated toothpaste wherein no (38.24%) and yes (61.76%). Figure 6 shows the percentage distribution on aids used to clean teeth wherein dental floss (5.88%), mouth rinse (16.91%), dental floss and mouth rinse (2.94%), tooth paste and tooth brush (49.26%), toothpaste, toothbrush and dental floss (1.47%), toothpaste, toothbrush and mouth rinse (14.71%) and toothpaste, toothbrush, dental floss and mouth rinse (8.82%). Figure 7 shows the association between gender and myth on extraction of upper teeth which affects eyesight. 30.88% of females and 22.06% of males responded yes. Chi square test was done and association was found to be statistically not significant. Pearson’s chi square value: 0.763, p value: 0.382, (p>0.05) hence statistically not significant, providing males have better awareness than females.

Figure 1: Pie chart showing percentage distribution on age wherein blue colour represents 20-30 years (62.5%), light green colour represents 31-40 years (15.44%), maroon colour represents 41-50 years (11.03%) and purple colour represents above 50 years (11.03%).

Figure 2: Pie chart showing percentage distribution on gender wherein dark green colour represents female (61.76%), sap green colour represents males (38.24%).

Figure 3: Pie chart showing percentage distribution on frequency of visit to dentist wherein red colour represents none (24.26%), light violet colour represents once in a year (41.18%),
purple colour represents routine checkup (22.06%) and sky blue colour represents twice a year (12.5%).

Figure 4: Pie chart showing percentage distribution on frequency of tooth brushing wherein dark blue colour represents once (47.79%) and light green colour represents twice (52.21%).

Figure 5: Pie chart showing percentage distribution on usage of fluoridated toothpaste wherein blue colour represents no (38.24%) and green colour represents yes (61.76%).

Figure 6: Pie chart showing percentage distribution on aids used to clean teeth wherein light purple colour represents dental floss (5.88%), dark violet colour represents mouth rinse (16.91%), purple colour represents dental floss and mouth rinse (2.94%), sap green colour represents tooth paste and tooth brush (49.26%), light violet colour represents toothpaste, toothbrush and dental floss (1.47%), light pink colour represents toothpaste, toothbrush and mouth rinse (14.71%) and pink colour represents toothpaste, toothbrush, dental floss and mouth rinse (8.82%).

Figure 7: Bar graph showing association between gender and myth on extraction of upper teeth which affects eyesight. X-axis represents gender and Y-axis represents number of participants. 30.88% of females and 22.06% of males responded yes. Blue colour represents no. Chi square test was done and association was found to be statistically not significant. Pearson’s chi square value: 0.763, p value: 0.382, (p>0.05) hence statistically not significant, providing males have better awareness than females.
Figure 8 shows the association between gender and myth on usage of cloves to ease tooth pain. 46.32% of females and 27.94% of males responded yes. Chi square test was done and association was found to be statistically not significant. Pearson’s chi square value: 0.062, p value: 0.803, (p>0.05) hence statistically not significant, providing females have better awareness than males. Figure 9 shows the association between gender and taboos on brushing during gum bleeding. 35.29% of females and 23.53% of males responded yes. Chi square test was done and association was found to be statistically not significant. Pearson’s chi square value: 0.684, p value: 0.408, (p>0.05) hence statistically not significant, providing females have better awareness than males.

Figure 8: Bar graph showing association between gender and myth on usage of cloves to ease tooth pain. X-axis represents gender and Y-axis represents number of participants.46.32% of females and 27.94% of males responded yes. Blue colour represents no. Chi square test was done and association was found to be statistically not significant. Pearson’s chi square value: 0.062, p value: 0.803, (p>0.05) hence statistically not significant, providing females have better awareness than males.

Figure 9: Bar graph showing association between gender and taboos on brushing during gum bleeding. X-axis represents gender and Y - axis represents number of participants. 35.29% of females and 23.53% of males responded yes. Blue colour represents no. Chi square test was done and association was found to be statistically not significant. Pearson’s chi square value: 0.684, p value: 0.408, (p>0.05) hence statistically not significant, providing females have better awareness than males.

Figure 10: Bar graph showing association between gender and myth on removing worms of tooth decay from the ear. X-axis represents gender and Y-axis represents number of participants. 38.24% of females and 16.18% of males responded no. Green colour represents yes. Chi square test was done and association was found to be statistically not significant. Pearson’s chi square value: 4.973, p value: 0.026, (p<5) hence statistically significant, providing females have better awareness than males.
Figure 10 shows the association between gender and myth on removing tooth decay from the ear. 38.24% of females and 16.18% of males responded no. Chi square test was done and association was found to be statistically not significant. Pearson’s chi square value: 4.973, p value: 0.026, (p<0.05) hence statistically significant, providing females have better awareness than males. Figure 11 shows the association between gender and myth on growing of deciduous teeth causing fever. 39.71% of females and 27.21% of males responded yes. Chi square test was done and association was found to be statistically not significant. Pearson’s chi square value: 0.684, p value: 0.408, (p>0.05) hence statistically not significant, providing females have better awareness than males.

Figure 11: Bar graph showing association between gender and myth on growing of deciduous teeth causing fever. X-axis represents gender and Y-axis represents number of participants. 39.71% of females and 27.21% of males responded yes. Blue colour represents no. Chi square test was done and association was found to be statistically not significant. Pearson’s chi square value: 0.684, p value: 0.408, (p>0.05) hence statistically not significant, providing females have better awareness than males.
The beliefs and attitudes towards health practices are affected by the culture. Culture is transmitted, learned, shared and represents a way of life [22]. It plays a major role in the socialization process. Various myths related to dental treatment such as professional cleaning causes loosening of teeth and extraction of upper teeth leads to loss of vision were significantly observed in uneducated people [23]. This might be attributed to lack of awareness, low educational levels, anxiety, apprehension and myths about dental treatment entrenched in their minds [32]. This study work was conducted to find the existence of misconceptions and myths related to dentistry and oral health behaviour among the adult population of Chennai [23,24].
In the research done 40% of those who had never visited a dentist before felt that extraction of the upper teeth affected eye vision whereas in this study, 52.94% of people responded yes. In another research by [32], 41% of people responded that cloves can be used during tooth ache whereas in this study, 74.26% of people responded yes. People of the age group 20-30 years use most of the aids to clean their teeth (36.76%) [28]. Another research has responses of 69% of people who don’t use the aids [27,35]. In the research done, 23.8% of people suggest that using a finger for brushing is better than using toothbrushes. This study has 44.9% suggesting the same.
Even in this generation, many people believe in the taboos and myths related to dentistry. The limitations faced are time lag and limited sample population [29]. In the future, having more time, a large population could be analysed and assess the taboos in dentistry and oral health behaviours [30,31].
Many people do believe in the myths and taboos related to dentistry which have the wrong information and are circulated from one generation to another generation. The main objective of this study is to assess people having myths and taboos related to dentistry and oral health behaviours.
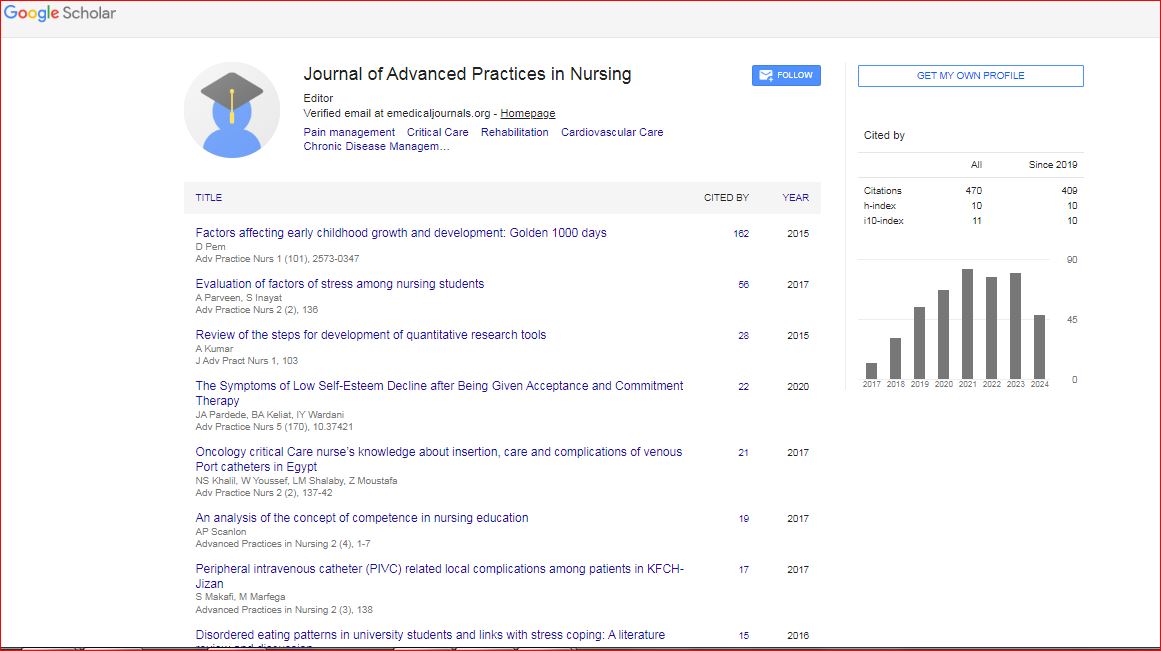
Journal of Advanced Practices in Nursing received 410 citations as per Google Scholar report