Research Article - (2025) Volume 13, Issue 1
Received: 04-Sep-2024, Manuscript No. JND-25-147271;
Editor assigned: 09-Sep-2024, Pre QC No. JND-25-147271 (PQ);
Reviewed: 24-Sep-0001, QC No. JND-25-147271;
Revised: 08-Feb-2025, Manuscript No. JND-25-147271 (R);
Published:
15-Feb-2025
, DOI: 10.4172/2329-6895.13.1.632
Citation: Acker, Helmut, Wilhelm Ehleben, and Jorn M. Horschig. "Acupuncture at the Hegu (IC4) Point Detects Brain Oxygen Supply Disturbances in Patients with Brain Disorders: FNIRS Case Studies on Brain Oxygen Sensing." J Neurol Disord 13 (2025): 632.
Copyright: © 2025 Acker H, et al. This is an open-access article distributed under the terms of the creative commons attribution license which permits unrestricted use, distribution and reproduction in any medium, provided the original author and source are credited.
The functional Near-Infrared Spectroscopy (fNIRS) method was introduced in general medical practice to assess brain blood oxygenation alongside other physiological parameters such as 4-channel EEG, heart rate, blood oxygenation, blood volume changes, and autonomic nerve activity. An Artificial Neural Network (ANN) was employed to adjust the brain blood oxygenation data and analyze changes in these parameters. This approach shows potential for early detection of cerebral blood flow abnormalities linked to cognitive disorders, such as Alzheimer’s disease. In this study, acupuncture at the Hegu (LI4) point was used to stimulate brain neuronal networks in 5 healthy Control Patients (CPs) and 5 patients with Brain Disorders (BDPs). The main findings were:
fNIRS recordings of brain hemoglobin oxygenation provide insights into brain microcirculation and oxygen supply effectiveness.
Central brain acupuncture stimulation identifies deficits in brain microcirculation and oxygen supply in BDPs.
A 20-second acupuncture stimulation induced brain hypoxia in BDPs but not in CPs, likely due to mismatched arterial and venous microcirculation.
Combining fNIRS with ANN analysis to assess brain oxygen supply proves effective and user-friendly for detecting early signs of brain microcirculation dysregulation and monitoring therapeutic progress.
Acupuncture • Functional near-infrared spectroscopy • O2Hb • HHb • Brain oxygen supply • Neurovascular coupling • Mitochondrial oxygen sensing • EEG Fourier power analysis • Brain disorder • Alzheimer´s disease • Artificial neural network
Introduction with an increasing number of elderly individuals suffering from dementia, including Alzheimer’s disease and poststroke or traumatic brain injuries [1], early detection of Mild Cognitive Impairment (MCI) is essential for timely medical interventions [2]. To address this, we developed an application designed to monitor blood oxygenation levels and identify cerebral blood flow disorders [3]. Cerebral blood flow is influenced by physiological factors such as Heart Rate (HR), blood volume fluctuations (Pleth), hemoglobin oxygen saturation (SaO2), autonomic nervous system activity (GSR), and neural cell activity [4]. In our study, we measured these parameters alongside four-channel EEG recordings (Figure 1) using fNIRS. Fourier power analysis identified 23 parameters to analyze fNIRS signals in relation to cerebral and extracerebral oxygenation [5]. The significance of each parameter was evaluated using an Artificial Neural Network (ANN), which is effective for nonlinear regression analysis of extensive medical datasets [6]. Additionally, O2Hb-HHb relation plots were generated to explore brain oxygen supply regulation.
We applied fNIRS to 5 healthy Control Patients (CPs) and 5 patients with Brain Disorders (BDPs), such as Alzheimer’s disease, which is known to disrupt Neurovascular Coupling (NVC) [7]. Various acupuncture points, including He gu (Hegu, Union Valley, Large intestine meridian 4) [8], have been shown to aid in stroke rehabilitation by encouraging neurogenesis, regulating cerebral blood flow, preventing cell death, and improving memory and long-term potentiation [9].
fNIRS combined with ANN analysis and O2Hb-HHb relation plots revealed significant differences between CPs and BDPs, reflecting the impact of 23 parameters on oxygenated and deoxygenated blood dynamics. The effect of Hegu acupuncture was similar to other NVC stimuli such as touch, smell, taste, music, or cognitive tasks [10]. Further studies involving additional patients are needed to use O2HbHHb relationships as early indicators of impaired NVC in BDPs or as a way to monitor the success of treatments for cognitive impairments in clinical settings.
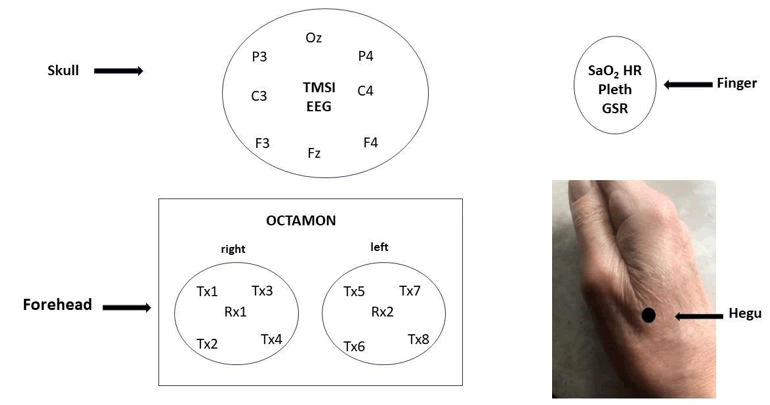
Figure 1. Illustrates the experimental setup of the brain OctaMon NIRS. The setup includes Tx1-Tx8 diodes, which emit light at wavelengths of 751 nm and 843 nm. The emitted light passes through the brain tissue by reflection and is subsequently captured by R×1 and R×2. This configuration allows for the simultaneous measurement of oxygenated (O2Hb) and deoxygenated (HHb) blood levels. Additionally, bipolar EEG signals (F3-F4, C3-C4, Fz-Oz, P3- P4), the GSR, the HR, and peripheral blood oxygen saturation (SaO2) were monitored. Furthermore, blood volume changes were assessed using photoplethysmography (Pleth) techniques.
Figure 1 illustrates the head cap configuration, as outlined in previous work [11]. This setup integrates the 8-channel fNIRS OCTAMON system (Artinis Medical Systems B.V., Elst, Netherlands) with the Bluetooth-enabled EEG TMSiMobi 6-channel amplifier (TMSi, Oldenzaal, Netherlands). The fNIRS system features multiple optodes (OCTAMON), predominantly placed on the frontal region of the head. Eight transmitter diodes (T×1-T×4 on the right side, T×5-T×8 on the left) emit light at wavelengths of approximately 751 nm and 843 nm to monitor the kinetics of HHb and O2Hb, aiding in the evaluation of Neurovascular Coupling (NVC) and cerebral blood flow regulation [12]. The light in this wavelength range is mainly absorbed by hemoglobin, and to a lesser extent by water and lipids [13]. The emitted light penetrates brain tissue up to 23 mm, with approximately 5% reaching gray matter at a depth of 20.3 mm, suggesting significant information from extracerebral regions such as the skin, bones, and muscles [14]. After traversing the brain tissue, the fNIRS light is detected by two receivers, R×1 and R×2, enabling the measurement of O2Hb and HHb levels using a modified Lambert–Beer law. Additionally, four bipolar EEG signals (F3-F4, C3-C4, Fz-Oz, P3-P4), GSR (to measure autonomic nervous system activity), Heart Rate (HR), arterial oxygen saturation (SaO2) using photoplethysmography (Pleth), and fingertip blood volume changes were recorded at 256 Hz using the TMSiMobi system. Collecting various anatomical and physiological data during fNIRS measurement is essential to understanding NVC, though interpreting these signals under different neuronal stimulation conditions can be challenging due to anatomical and physiological interference [15]. The fNIRS system sampled at 50 Hz, but the data were upsampled to 256 Hz to match the sampling rate of the other devices. Data recording, visualization, and computation were performed with the OxySoft program (Artinis Medical Systems B.V., Elst, Netherlands), and the data were stored in Excel files (Microsoft) for subsequent analysis.
Patients
Ten patients who regularly visited a general medical practice affiliated with FONOG (www.fonog.de) were offered brain oxygen supply monitoring using fNIRS. The control group (CPs) consisted of five patients (mean age 45 ± 10 years) without brain disorders, while the Brain Disorder Patient group (BDPs) included five patients (mean age 62 ± 22 years): Three with Alzheimer's disease (ICD10 G30.9, mean age 74 ± 8 years), one who had experienced a stroke (ICD10 I69.4, age 69 years), and one with autism (ICD10 F84.1, age 24 years). Age differences between the groups were not statistically significant (p>0.05). Written informed consent was obtained from all participants for the use of their data in this study, following the patient consent form template. The study was approved by the institutional ethics committee of Ärztekammer Westfalen Lippe (Münster, Germany) (2023-199-f-S).
EEG time-frequency analysis
The EEG time series were processed in several stages: First, detrending was applied to remove any linear trend from the data by subtracting the least-squares fit of a straight line. Then, the short-time Fourier transform was used to obtain the time-frequency representation of the detrended data. A Hamming window of 128 points with a 50% overlap was applied during this transformation to capture temporal variations in the EEG frequency content. The resulting amplitude values were converted to decibels (dB) for better visualization of the EEG signals’ dynamic range. The time-frequency representation was interpolated to a frequency of 256 Hz, ensuring consistent resolution across the entire spectrum. The mean amplitude for specific EEG frequency bands, including delta (1-4 Hz), theta (4-8 Hz), alpha (8-13 Hz), beta (14-30 Hz), and gamma (30-100 Hz), was calculated. These bandwidths were selected as they are commonly used in EEG analysis to assess brain activity in different regions or networks.
NVC stimulation by acupuncture
During the experimental session, patients were instructed to rest in a comfortable chair for 10 minutes to acclimate to the fNIRS-EEG head cap. Acupuncture was then administered following a method described previously [16]. Single sterile steel needles (0.22 × 13 mm, Gushi-zhengzheng, Medical Device, Henang, China) were used for the procedure. Prior to needle insertion, the Hegu acupuncture point (Figure 1) was disinfected. The needle was inserted approximately 5 mm into the skin by a medically qualified acupuncturist and then rotated clockwise for 20 seconds until resistance from the tissue prevented further movement.
Statistics
The data analysis began 10 seconds prior to the start of the 20-second acupuncture session. The fNIRS data were normalized, and the analysis continued for approximately 30-40 seconds after the completion of the acupuncture. A t test was performed to compare the differences in recordings between the CP group (n=5) and the BDP group (n=5). The impact of the 23 parameters on brain O2Hb and HHb levels was assessed. The normality of the distribution of the data was controlled for using a Probability-Probability (PP) test conducted in IBM SPSS Statistics version 27. The level of statistical significance was set at an alpha error level of p<0.05. Graphs were created using Microsoft Excel and PowerPoint.
The relative importance comparable to the standardized beta coefficient of linear regression of the 23 parameters for recalculating O2Hb and HHb reactions to acupuncture NVC stimulation was assessed by ANN nonlinear regression composed of a 1 neural layer containing up to 18 units called the hidden layer (blue), 1 input layer containing the 23 explanatory parameters (left side) and 1 output layer containing the fNIRS-measured oxygenation variables (right side, Multilayer Perceptron Network, IBM SPSS Statistics, Armonk, NY software version 27). Approximately 70% of the measured parameter values were used for training the ANN. The subsequent testing by the ANN used 30% of the measured parameter values. The training and testing times were approximately 3 seconds, and the mean relative error of recalculation was 0.057 ± 0.017 for CPs and 0.031 ± 0.01 for BDPs (p<0.05).
The English language and grammar were managed by the AJE Orcid Curie feature.
As depicted in Figure 2, O2Hb and HHb responses to right-hand Hegu acupuncture (event) were observed for 20 seconds in the Pat04 BD patient. These measurements were recorde using frontal head fNIRS from T × 1-T × 8 O2Hb (red) and HHb (blue), along with simultaneous bipolar EEG registrations (black, F3-F4, C3-C4, Fz-Oz, P3-P4). The figure below shows concurrent changes in SaO2, Heart Rate (HR), Galvanic Skin Response (GSR), and plethysmography (Pleth) during the same period.
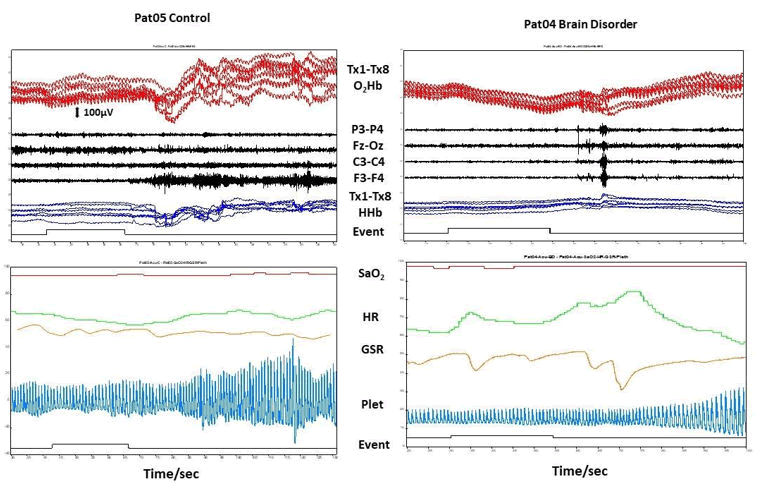
Figure 2. The left side shows the O2Hb and HHb reactions to righthand Hegu acupuncture (event) for 20 seconds at Pat05 CP. This was measured using frontal head fNIRS of T×1-T×8 O2Hb (red) and HHb (blue), along with simultaneous registrations of bipolar EEGs (black, F3-F4, C3-C4, Fz-Oz, P3-P4). The figure below illustrates the changes in SaO2, HR, GSR, and platelet count during the same time period.
Figure 2 also illustrates O2Hb and HHb reactions to right-hand Hegu acupuncture for 20 seconds in Pat05 CP, using similar measurements. The figure highlights the changes in SaO2, HR, GSR, and platelet count during this period. Data analysis began 10 seconds before acupuncture stimulation. After the acupuncture (event) ended, O2Hb increased and HHb decreased around 10 seconds later. At the same time, EEG activity showed a significant increase, particularly in the F3-F4 region. The figure below shows oscillations in SaO2, with HR decreasing, typical of acupuncture responses [17]. The GSR decreases, indicating a loss of sympathetic tone. Pleth displays increasing blood volume changes, influenced by various frequency components, including respiration, sympathetic nervous system activity, and thermoregulation [18].
On the right side of Figure 2, O2Hb and HHb responses to righthand Hegu acupuncture were again observed in BD patient Pat04. In this case, O2Hb decreased in response to acupuncture (event), while HHb increased. Following acupuncture, EEG activity increased across all measurements. Concurrent changes in SaO2, HR, GSR, and Pleth were also recorded during the same period. SaO2 oscillated, HR decreased, and GSR showed periods of sympathetic tone loss. The pleth remained stable initially but increased over time with blood volume changes.
The grey lines in Figure 3A represent the O2Hb responses of channels T1-T×8 from 5 CPs to acupuncture for 20 s (shaded region). Dotted grey lines represent the values for CP05. A solid black bold line represents the mean O2Hb reaction, while a broken black bold line represents the mean HHb reaction. The grey lines in Figure 3B represent the single O2Hb responses of channels T1-T×8 of five BDPs to acupuncture for 20 s (shaded region). Dotted grey lines represent the BDP 04 values. A solid black bold line represents the mean O2Hb response, while a broken black bold line represents the mean HHb reaction. Both the mean HHb and O2Hb reactions of CPs and BDPs were significantly different (p<0,05), indicating an increase in the brain oxygen supply of CPs and an impairment of the oxygen supply of BDPs under acupuncture at Hegu.
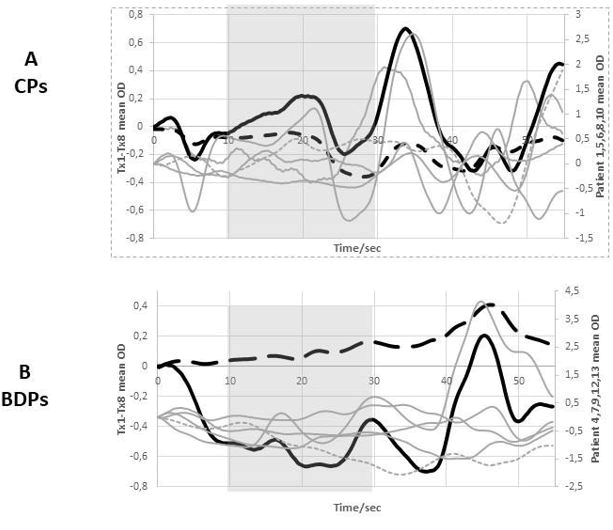
Figure 3. This figure shows the O2Hb reactions of channels T1-T× 8 from 5 CPs to acupuncture for 20 s (shaded area) as gray lines. The values of control patient 05 are shown as dotted gray lines. The mean O2Hb reaction is shown as a solid black bold line, whereas the mean HHb reaction is shown as a broken black bold line. Figure 3B shows the single O2Hb reactions of channels T1-T×8 of 5 BDPs to acupuncture for 20 s (shaded area) as gray lines. The values for BD patient 04 are shown as dotted gray lines. The mean O2Hb reaction is shown as a solid black bold line, whereas the mean HHb reaction is shown as a broken black bold line.
Figure 4 displays the variations in brain oxygenation in response to Hegu acupuncture between Control Participants (CPs) and Brain Disorder Patients (BDPs). The x-axis represents O2Hb levels, and the y-axis indicates the corresponding changes in HHb Optical Density (OD). The mean values for 5 CPs (black solid line) and 5 BDPs (gray solid line) are shown, with the 20-second acupuncture period highlighted by the bold section of the lines. CPs typically exhibit a fluctuating increase in O2Hb and a decrease in HHb, suggesting that microcirculation plays a key role in regulating brain oxygen supply. In contrast, BDPs show a nearly linear decline in O2Hb and an increase in HHb, which suggests microcirculatory dysfunction, leading to brain hypoxia during acupuncture. This raised the question of whether the observed differences could be attributed to the varying significance of the 23 parameters measured and used to calculate the fNIRS oxygenation recordings, as explored in Figure 5.
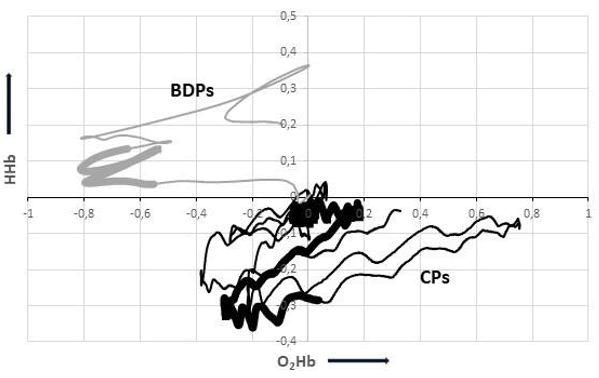
Figure 4. It is shows the differences in brain oxygen supply in response to Hegu acupuncture between CPs and BDPs. The x-axis shows the O2Hb, and the y-axis shows the corresponding HHb Optical Density (OD) changes as the mean value of 5 CPs (black solid line) and 5 BDPs (gray solid line). The bold part of the lines represents the time period of 20 s of acupuncture.
Figure 5 displays the parallel reaction of the gamma power of the EEG C3-C4 recording on the left side, together with the growing T×1- Tx8 O2Hb reaction (grey lines) in response to acupuncture (shaded area) of 1 CP (Pat01). The principal parallel reaction of the gamma power of the EEG P3-P4 recording and the decreasing T×1-T×8 O2Hb reaction in response to acupuncture (shaded region) at 1 BDP (Pat12) are depicted by the right grey lines. For the first time, an ANN took the place of this visual evaluation [19].
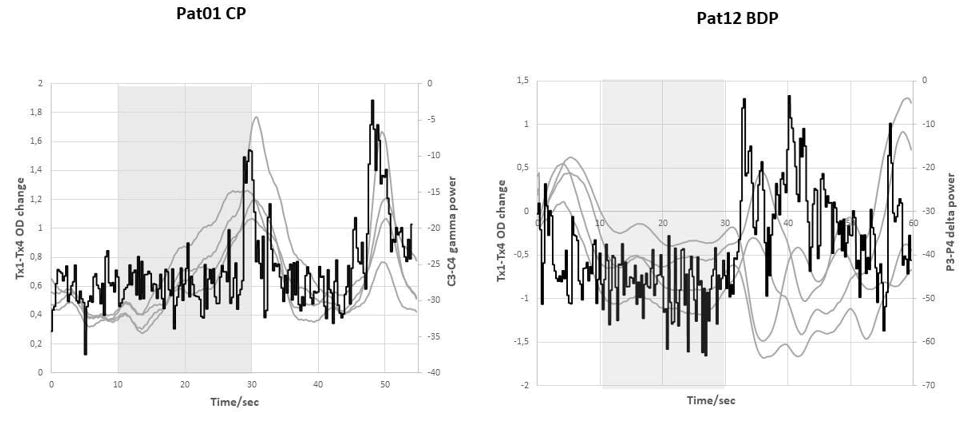
Figure 5. Shows on the left side the increasing T×1-T×8 O2Hb reaction (gray lines) in response to acupuncture (shaded area) of 1 CP (Pat01) as well as the nearly parallel reaction of the gamma power of the EEG C3-C4 recording. On the right- hand side, gray lines show the decreasing T×1-T×8 O2Hb reaction in response to acupuncture (shaded area) of 1 BDP (Pat12) as well as the nearly parallel reaction of the gamma power of the EEG P3-P4 recording.
Figure 6 illustrates the Artificial Neural Network (ANN) configuration used to assess the relative importance of 23 measured explanatory variables (on the left side of the blue section) for predicting the T×1-T×8 O2Hb and HHb-dependent variables (on the right side of the blue section) during acupuncture. The model includes one hidden neural layer with 18 units (middle blue section). The left panel displays the 23 explanatory parameters that were measured and computed during the experiment, alongside their relative significance in the recalculation process. The diagrams on the right side of the blue section show the linear correlation between the measured and ANN-recalculated T×4 O2Hb values for one CP (Pat05) and one BDP (Pat04), as well as the corresponding relative errors. The relative error in the BDP recordings was notably smaller compared to that in the CP recordings, which may indicate a more linear and reduced effect of the 23 explanatory parameters for the BDP group.
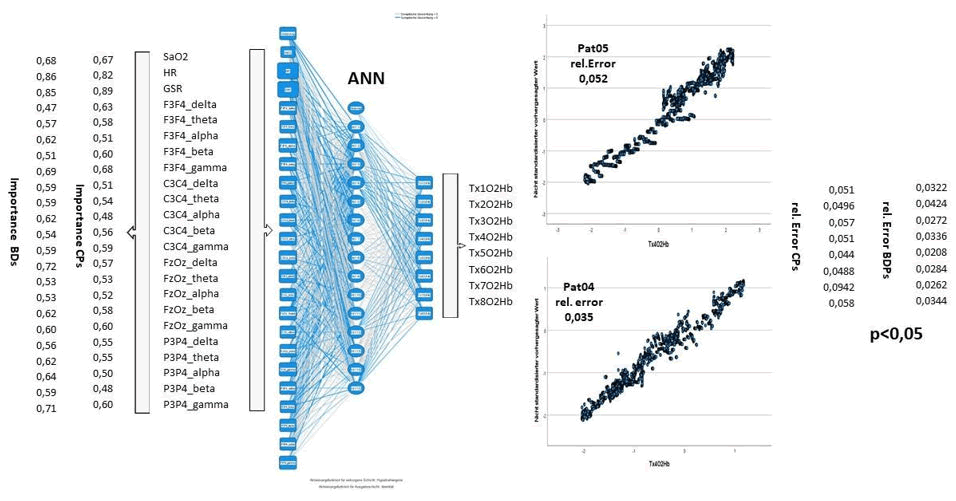
Figure 6. Shows the ANN setup for analyzing the relative importance of 23 measured explanatory parameters (left side of the blue part) for estimating the T×1-T×8 O2Hb and HHb dependent variables (right side of the blue part) under acupuncture using one hidden neural layer with 18 units (blue middle part). The left panel shows the 23 explanatory parameters measured and calculated during the experiment and their relative importance used for recalculation. The thickness of the blue lines in the middle between the 23 explanatory parameters and the T×1-T×8 O2Hb variable increases with increasing relative importance. The diagrams on the right side of the blue part show the linear relationship between the measured and ANN-recalculated T×4 O2Hb of 1 CP (Pat05) and Tx4 O2Hb values for 1 BDP (Pat04) and the corresponding relative error. The relative error of calculation for the T×1-T×8 O2Hb BDP recordings was significantly lower than that for the T×1-T×8 O2Hb CP recordings.
Figure 7 illustrates a net diagram depicting the relative importance of 23 parameters for recalculating fNIRS O2Hb (black line) and HHb changes (gray line) after 20 seconds of Hegu acupuncture for 5 Control Patients (CPs, left) and 5 Brain Disorder Patients (BDPs, right). Peripheral factors, such as Heart Rate (HR) and Galvanic Skin Response (GSR), play a significant role in recalculating fNIRS O2Hb changes in both CPs and BDPs. In BDPs, brain power activities measured by EEG dominate the recalculation of fNIRS O2Hb changes. Notably, the net diagram analysis revealed a marked difference in O2Hb and HHb changes between BDPs and CPs, which may indicate a mismatch in the control of arterial and venous microcirculation, potentially leading to brain hypoxia, as depicted in Figures 2-4.
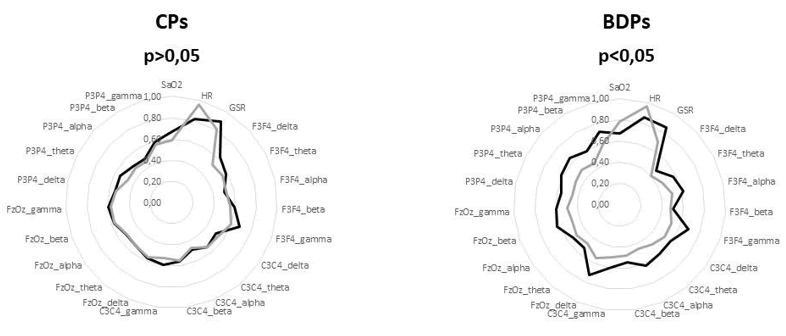
Figure 7. Shows a net diagram of the relative importance of 23 parameters for recalculating fNIRS O2Hb (black line) and HHb changes (gray line) upon Hegu acupuncture for 20 s for 5 CPs (left side) and 5 BDPs (right side).
Acupuncture’s direct effect on central nervous system structures leads to immediate alterations in the limbic-paralimbic neocortical network, which can be measured by Blood Oxygenation LevelDependent (BOLD) fMRI. These networks closely resemble the tasknegative default mode network and the anti-correlated task-positive network, which serve as afferent targets [20]. Acupuncture can modify synaptic plasticity by regulating synaptic proteins, reducing inflammatory responses in neural pathways, enhancing mitochondrial energy metabolism, and decreasing amyloid beta deposition.
Cerebral Blood Flow (CBF) regulation is essential for healthy brain function. The brain has developed a unique mechanism for CBF control known as Neurovascular Coupling (NVC), which ensures that activated brain regions receive an increased supply of oxygen and blood. The NVC unit, composed of astrocytes, mural vascular smooth muscle cells, pericytes, and endothelial cells, governs neurovascular coupling. In Alzheimer’s Disease (AD), a decrease in CBF, often initiated at the capillary level, is one of the earliest changes observed. This reduction in CBF is linked to cognitive decline. The constriction of capillaries by pericytes and subsequent occlusion by neutrophils and thrombi leads to significant dysfunction in AD. Preliminary evidence suggests that reversing this CBF reduction may restore cognitive function, provided there is minimal damage to synapses, neurons, and circuits. Thus, the fNIRS screening test could potentially enable early detection and therapeutic intervention to maintain CBF, which may be key in treating AD and related brain disorders.
Epidemiological studies have shown that roughly one-third of AD patients exhibit vascular pathology, indicating a strong vascular component that leads to reduced CBF, hypoxia, and a compromised blood-brain barrier. Research on living human brains has revealed that abnormal cerebrovascular reactivity, CBF reductions, and dysregulated CBF are significant features in the early stages of disease, across the aging, mild cognitive impairment, and AD continuum. The deterioration of the brain’s microvasculature, especially in the hippocampus, appears early in AD development, even before Amyloid-Beta (Aβ) deposits occur. This microvascular damage reduces the supply of oxygen and glucose, and mitochondrial dysfunction may also limit ATP production. This damage might be linked to an early increase in NADPH Oxidase (NOX) expression and activity in endothelial cells with age. Mitochondrial dysfunction in AD could be induced by the amyloid cascade, although some studies suggest it may occur independently of Aβ, potentially representing a primary mitochondrial cascade. Mitochondria may thus mediate Aβ-induced dysfunction or even initiate pathological cascades in AD. Aβ is known to disrupt mitochondrial complex I and IV functions, and a newly identified mechanism related to N1-methylation of ND5 mRNA could further explain mitochondrial dysfunction in AD. Analysis of mitochondrial activity in both AD and Major Depressive Disorder (MDD) patients revealed significant changes in AD but not MDD, with decreased activity in Citrate Synthase (CS) and complex IV being indicative of mitochondrial dysfunction, while changes in other mitochondrial complexes may represent an adaptive response.
These NVC responses may depend not only on neuronal brain activity but also on a variety of oxygen-sensing signaling cascades that regulate CBF, as depicted in Figure 8.
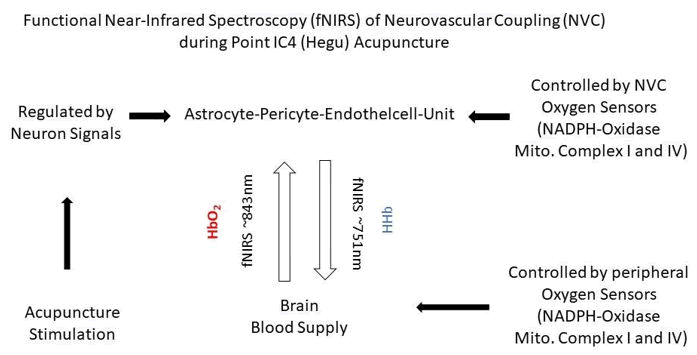
Figure 8. Shows that NVC is regulated by neuronal activity signals and controlled by oxygen sensors based on the activity of NADPH oxidase, the activity of mitochondrial complexes I and IV and the blood supply in the brain controlled by peripheral oxygen sensors (NADPH oxidase and mitochondrial complexes I and IV, as described for the carotid body oxygen sensor).
The most likely oxygen sensor candidates for starting the hypoxiainduced release of Neurotransmitters (NTs) to excite synaptically connected sinus nerve fibres to regulate ventilation and blood circulation centres in the brainstem are Carotid Body (CB) NADPH oxidase, mitochondrial complex I, and complex IV of CB type I cells. Sinus nerve activity is reduced when NADPH oxidase is stimulated by improved p47 binding, and it is silenced when poisoned complex I is present. Helix X and two copper centres (CuA and CuB) connect the four redox centers heme an and heme a3 found in complex IV. Oxygen binds to the haem a3-CuB binuclear center, and helix-X stretches, facilitating communication between the two haem groups and enhancing electron transfer from mitochondrial cytochrome c (complex III) over CuA to haem a and the binuclear center. The shape of the intracellular mitochondrial network changes by approximately 3 º upon Helix-X movement, presumably inducing a change in cell shape with variations in the activity of stretch-sensitive ion channels. Assuming that the CB oxygen sensor mechanism might also be valid for brain NVC regulation, Figure 8 proposes that the regulatory neuron signal is controlled by oxygen sensors to optimize CBF and the blood supply in the brain. Assuming that one of the oxygen sensor candidates is NADPH oxidase, complexes I and IV are defective, as described for AD-linked brain disorders brain microcirculation is dysregulated, as shown in Figures 4 and 7, due to a mismatch of arterial and venous perfusion. This mismatch resulting in brain hypoxia was also observed in BDPs confronted with tasks such as calculation, smelling, tasting or music.
We thank Gisela Acker for her generous private financial support of the project and Sofia Sappia for her excellent contribution by establishing the EEG Fourier analysis.
The authors declare that there are no conflicts of interest regarding the publication of this article.
[Crossref] [Google Scholar] [PubMed]
[Crossref] [Google Scholar] [PubMed]
[Crossref] [Google Scholar] [PubMed]
[Crossref] [Google Scholar] [PubMed]
[Crossref] [Google Scholar] [PubMed]
[Crossref] [Google Scholar] [PubMed]
[Crossref] [Google Scholar] [PubMed]
[Crossref] [Google Scholar] [PubMed]
[Crossref] [Google Scholar] [PubMed]
[Crossref] [Google Scholar] [PubMed]
[Crossref] [Google Scholar] [PubMed]
[Crossref] [Google Scholar] [PubMed]
[Crossref] [Google Scholar] [PubMed]
[Crossref] [Google Scholar] [PubMed]
[Crossref] [Google Scholar] [PubMed]
[Crossref] [Google Scholar] [PubMed]
[Crossref] [Google Scholar] [PubMed]
[Crossref] [Google Scholar] [PubMed]
[Crossref] [Google Scholar] [PubMed]
Neurological Disorders received 1343 citations as per Google Scholar report