Research Article - (2020) Volume 10, Issue 2
Received: 12-Sep-2019
Published:
09-Apr-2020
, DOI: 10.37421/jcde.2020.10.339
Citation: Charles O. Maxwell, Simeon Dulo, Daniel O. Olago and Patts M.A. Odira. Water Availability Analysis of Multiple Source Groundwater Supply Systems in Water Stressed Urban Centers: Case of Lodwar Municipality, Kenya. J Civil Environ Eng 10 (2020): 339 doi: 10.37421/jcde.2020.10.339
Copyright: © 2020 Maxwell CO, et al. This is an open-access article distributed under the terms of the creative commons attribution license which permits unrestricted use, distribution and reproduction in any medium, provided the original author and source are credited.
Ensuring water security to urban population in fragile environments through interlinked systems of groundwater abstraction, storage and distribution of sufficient quantity is challenging especially to urban utilities situated in arid and semi arid regions. The purpose of this research was to evaluate water delivery challenges for water utilities in fragile environment in Kenya. A systematic analysis of availability from each supply sub-components from source to consumer was carried out through water audit and network analysis by employing water flow measurement equipments and through pump performance analysis and by employing continuity equation and Bernoulli’s principle to sections of the network. Results showed that water availability within a utility in such environments is contributed by seasonal variations between wet and dry affecting quantity at source, optimal design of supply infrastructure in this case better matching of solar power with the pump, using standard pipes and on optimal operational strategies employed to reduce losses within the network. Based on these findings, we conclude that with clear understanding of each subcomponent’s contributions to entire water supply system and optimizing their design and operations, more people will be made water secure in all seasons in the fragile environments.
Borehole • Availability • Water supply infrastructure
Water supply distribution systems are faced with complex challenges and problems. Among the challenges is supplying sufficient water to a rapidly growing urban population coupled with changes in climate and aging urban water supply infrastructure, operational logistics and economic problems [1]. It has been acknowledged that with decreasing availability of water as a result of increased urbanization brings the challenges to authorities who cannot improve their infrastructure at the same pace with demand consequently the need to change the way they operate existing systems for significant improvements [2].
Urban centres globally are faced with problems of proving sufficient water to satisfy demand against limited and diminishing sources hence continuous search of most appropriate methods to manage water resources at their disposal equitably [3]. A study conducted in 10 urban sites located in arid and semi-arid regions in East Africa by REACH and to specific towns in Kenya by Daniel O. Olago reflects similar situations of stressed water supply systems with accessibility falling from 55% in 1990 to 45% in 2015 due to climate shock, urban population explosion and slow pace of infrastructure expansion contrary to the expected trend of wide coverage as a result of advancement in technology and methods of operations [4,5]. It is expected that strain to urban infrastructure will continue as population increases and therefore authorities need to find innovative approaches to deal with such stresses to the systems to ensure its accessibility which is a basic human right [6] and goal number 6 in sustainable development goals.
Solutions to water availability and accessibility can be both technical and non-technical [3], posit that not all solutions to water availability should be complex but suggest simple solutions which include efficiency at all levels of water supply systems such as water demand management, equitable and fair allocation of available water and supply infrastructure operations. Methods have been applied to solve the problems including optimization of components within the network or by optimizing entire network infrastructure [7,8], dissect elements of optimization within a supply network as pump operations, tank location, capacities and operational levels and isolation valves schedules. Different approaches have been proposed and applied like [9] suggest that problems of water availability and accessibility can be addressed by enhancing supply sources and putting in place water allocation policy. Efficient water system management is able to fix most challenges to water system [3]. Good understanding of water supply system is required to inform utility operators on where within the system more emphasis should be laid [10]. A methodology by American Water Works Association has been adopted for this study for a detailed analysis of a water supply system with results and findings expected to inform decision on the best operational strategies which can ensure accessibility and water security [11].
At a global scale, studies in water security in arid areas are gaining prominence as in the supporting program for this program, namely REACH is a seven-year programme (2015-2022) led by Oxford University with international consortium of partners and funded with UK aid from the UK Government. On average 1/3 of water abstracted for urban supply is lost within the supply infrastructure and the loss varies from utility to utility [12]. The losses add to unaccounted for water and in Kenya, performance indicators for utilities with respect to unaccounted for water are set as <30% as good, between 30-35% as acceptable and >35% as poor [13,14] and on average, utilities record unaccounted for water as 41% which is poor and a sign of utilities facing challenges in performing their core mandates. The main aim of this study was to assess water delivery challenges of a water supply utility and to suggest measures of improvements. An audit and network analysis guided by International Water Association (IWA) tool (standard water balance) and pump characteristic analysis of the supply infrastructure was conducted for a case study of Lodwar Water Supply and Sanitation (LOWASCO) in Kenya.
The study concludes that:
• water availability at source fluctuates with seasons and energy source but should be sufficient in both seasons
• water availability to consumers is not sufficient as a result of losses within the network and operation inefficiencies
• existing sources can support network expansion when effective loss control is put in place
• optimizing design and operations of entire water supply system can make more people within a fragile environment water secure.
Study area
The study area (is the County headquarter of Turkana County in Kenya lies within latitude 3°06’3” and 3°07’2” and longitude 35°35’220” and 35°36’360”)”. Lodwar municipality and it’s environ has an estimated population of 75,726 [15] out of which only 40,504 are currently served by existing water supply infrastructure. The municipality is within arid and semi arid regions of Kenya and has been classified as one of the fragile urban centers [4]. Water supply source to the municipality relies entirely on ground water with some aging infrastructure which is as old as 35 years [16,17].
Rapid population increase from 45,368 in 2009 [18] to more than 75,000 in 2017 [15] has been recorded in the municipality. This has led to higher water demand while common occurrences of droughts have left water services utility with a lot of challenges in attempting to satisfy demand. Pumps of varying capacities are installed in the boreholes and are driven by hybrid systems of solar energy and electric grid to reduce on cost of water production and each borehole is connected to storage tanks of varying capacities. An illustration of the boreholes and their respective storages within the study area is shown in Figure 1.

Figure 1. Map showing study area with boreholes and storage tanks for Lodwar Municipality.
To quantify amount of water that is being produced and supplied from each source of supply system, a detailed water audit using the International Water Association (IWA) standard water balance tool was carried out. The standard water balance provided a framework to quantify all water into and out of a supply area [19-21]. From the preliminary assessment of sources, master meters installed at the sources had either failed or were faulty due to age which according to World Health Organization (WHO), could not be relied upon due to possible errors that they are prone to record to the range of 50% hence could not be reliably used to determine production; for these reasons, measurements of production for each borehole were taken during dry and wet seasons using non-destructive flow measurement method using Ultrasonic flow meter which utilizes sound waves to determine velocity of a fluid flowing in a pipe [22]. Important pipe properties that were documented for the measurements were; internal diameter, material, wall thickness, lining materials if any, type of liquid flowing and transducers connection method.
Upon setting the pipe properties, spacing for attaching the transducers is automatically generated. This was followed by the attachment of transducers in an upstream and downstream accordingly. Readings of discharge and velocity were taken when signal strength was greater than 85% for duration of 5 minutes at different times of pumping hours. The equipment had data logging capability and readings are stored for later download and analysis in MS Excel application. Borehole production measurements were done for power grid (mostly night time) and solar energy driven (daytime).
Due to the complex nature of the distribution network, measurements were first carried between the borehole production points and the entries to storage tanks to establish any losses from production to storage. Borehole and storage tanks locations and elevations were captured by Germin GPS and validated by Garuda smart phone application. The flow rates of visible leaks at the valves and joints were measured using bucket and stopwatch. Aspects that could not be measured, such as major pipe bursts were estimated through inflow rates. To detect invisible ground leakages or suspected illegal connections in an area, flow measurements were taken for two sections of the pipeline and the law of conservation of mass applied to determine continuity in the flow;
Q =AV
Where,
Q = Discharge, A = Cross-Sectional area of pipe, and V = Velocity of fluid flow.
Where the flows were inconsistent, leak detection equipment was used. Capacities of masonry storage tanks were determined through measurements by tape measure and the formula;
V = πr2h applied to compute actual volumes,
Where,
V= volume of the tank in m3, r is radius of the tank and h is the height of the tank.
For steel storage tanks, capacity validation was achieved through physical counting of the panels which are of standard measurements of one meter then the formula for volume,
V = l*w*h applied to compute actual volumes,
Where,
V = Volume of tank, l = Length of tank w = Width of tank and h = Height of tank in meters.
Flow measurements within the network were carried out between boreholes to storage tanks for rising mains and between storage tanks to the consumer nodes for the distribution lines on selected parts of the network. To compare performance of the two sources of energy (electric grid and solar), production from boreholes was recorded at specific times of the day when the energy source was solar and when energy was from the electric grid.
Data collected using the ultrasonic flow meter was downloaded to MS Excel for editing and analysis. Determination of demand and zonal water use pattern using Peter Gleick Basic” Water Requirements for Human Activities: Meeting Basic Needs” recommended minimum per capita of 50 litres per person per day for developing countries was applied [23]. Network analysis was conducted to establish pressure variations within key control points of the network through
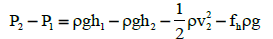
Application of Bernoulli’s principle,
Where, P1 = Pressure at the tank P2 = Pressure at the tap,

and pump characteristics for pumps used in each borehole were obtained through measurements and through document reviews which were used together with corresponding pump curves.
The study concludes that:
• Availability at source fluctuates with seasons and energy source but should be sufficient in both seasons
• Availability to consumers is not sufficient as a result of losses within the network and operation inefficiencies
• Existing sources can support network expansion when effective loss control is put in place.
This work is an output from the REACH programme (www.reachwater.org. uk) funded by UK Aid from the UK Department for International Development (DFID) for the benefit of developing countries (Aries Code 201880). However, the views expressed, and information contained in it are not necessarily those of or endorsed by DFID, which can accept no responsibility for such views or information or for any reliance placed on them. We are grateful to the following; Lodwar Water Company (LOWASCO) and the staff for availing to us information and enabling us to access their facilities, Oxfam Kenya, UNICEF Kenya and the County Government of Turkana for creating an enabling environment during field work and useful discussions and insights during stakeholders’ forums and to Florence Tanui for the GIS services offered, Francis Muturi for support during data collection. We also thank REACH Kenya for the invaluable support during the planning and data collection phases of this study.
S.D. conceived the idea and designed the project. He also co-wrote the manuscript C.O.M. carried out field data collection and analysed all the related data and wrote the original draft. D.O.O. review, editing and acquisition of funds. P.M.A.O. is a research supervisor. All authors discussed the results and contributed to manuscript preparation.
The authors declare no conflict of interest.
Journal of Civil and Environmental Engineering received 1798 citations as per Google Scholar report


