Short Communication - (2023) Volume 11, Issue 4
Received: 03-Aug-2023, Manuscript No. jaat-23-111479;
Editor assigned: 05-Aug-2023, Pre QC No. P-111479;
Reviewed: 17-Aug-2023, QC No. Q-111479;
Revised: 22-Aug-2023, Manuscript No. R-111479;
Published:
29-Aug-2023
, DOI: 10.37421/2329-6542.2023.11.269
Citation: Shepelev, Anil. “Visualization of Landsat Satellite and Gravity Lineaments Mapping across West Tennessee.” J Astrophys Aerospace Technol 11 (2023): 269.
Copyright: © 2023 Shepelev A. This is an open-access article distributed under the terms of the Creative Commons Attribution License, which permits unrestricted use, distribution, and reproduction in any medium, provided the original author and source are credited.
The exploration and analysis of geological features on Earth's surface have been greatly enhanced by the utilization of satellite imagery and geophysical data. One remarkable advancement in this field is the visualization of Landsat satellite imagery and gravity lineaments mapping. This paper delves into the significance and methodologies of visualizing Landsat satellite imagery and gravity lineaments mapping across the region of West Tennessee, shedding light on how these techniques contribute to our understanding of geological structures, landforms, and potential resource exploration. Landsat satellites have revolutionized our ability to study and understand the Earth's surface by providing high-resolution and consistent imagery over several decades. These satellites capture data in various spectral bands, allowing us to discern different surface features, including vegetation, water bodies, urban areas and geological formations. West Tennessee with its diverse landscape and geological history, benefits immensely from Landsat imagery.
The visualization of Landsat satellite imagery across West Tennessee enables the identification of changes in land cover and land use, facilitating environmental monitoring and management. Researchers can track deforestation, urban expansion, and changes in agricultural patterns, thus aiding in sustainable land management strategies. Furthermore, Landsat data plays a crucial role in disaster management, as it allows for rapid assessment of areas affected by natural disasters such as floods, wildfires, and landslides. Gravity lineaments mapping involves the analysis of variations in the Earth's gravitational field. These variations are often indicative of subsurface geological structures such as faults, fractures, and buried mineral deposits. By carefully studying gravity anomalies, geoscientists can infer the presence of subsurface features that might otherwise remain hidden [1].
In West Tennessee, the visualization of gravity lineaments provides insights into the region's tectonic history and structural characteristics. The identification of fault zones and geological discontinuities is crucial for understanding seismic hazards and assessing the potential for earthquakes. Additionally, gravity lineaments mapping can aid in the identification of potential mineral and hydrocarbon resources, directing exploration efforts towards areas with higher subsurface potential. The visualization of Landsat satellite imagery and gravity lineaments mapping involves sophisticated methodologies that integrate remote sensing, geospatial analysis, and geological interpretation.
For Landsat satellite imagery visualization, image processing techniques are employed to enhance the spectral information and create composite images that highlight specific features. Geographic Information Systems (GIS) play a vital role in integrating Landsat data with other geospatial layers, allowing researchers to create thematic maps that display land cover changes, urban growth, and other relevant information [2]. Gravity lineaments mapping, on the other hand, relies on the acquisition of gravity data through field measurements or satellite-based methods. Advanced gravity inversion techniques, often coupled with other geophysical data, enable the creation of gravity anomaly maps. These maps reveal subtle variations in the Earth's gravitational field, indicating potential subsurface structures. Interpretation of these anomalies requires geological expertise to distinguish between natural variations and anomalies caused by geological features.
The visualization of Landsat satellite imagery and gravity lineaments mapping holds immense significance for West Tennessee's geological understanding and socioeconomic development. In terms of geological understanding, these techniques aid in identifying and characterizing fault systems, folds, and other tectonic features that have shaped the region over millions of years. Farmers can make informed decisions about crop planting and irrigation, while urban planners can monitor urban growth and plan infrastructure development in an efficient and sustainable manner [3].
Gravity lineaments mapping contributes to resource exploration by guiding mineral and hydrocarbon exploration efforts. By identifying potential subsurface structures that may host valuable resources, the technique minimizes exploration risks and enhances the likelihood of successful discoveries. While the visualization of Landsat satellite imagery and gravity lineaments mapping offers remarkable insights, several challenges exist. The interpretation of satellite imagery requires careful consideration of atmospheric conditions, sensor characteristics, and data calibration. Additionally, distinguishing subtle gravity anomalies from noise and natural variations demands advanced processing techniques and geological expertise.
Looking ahead, advancements in machine learning and artificial intelligence are likely to play a pivotal role in automating image analysis and anomaly detection [4]. This could streamline the interpretation process and enable more efficient use of Landsat and gravity data.
The visualization of Landsat satellite imagery and gravity lineaments mapping presents a dynamic and multidisciplinary approach to understanding the geological and environmental characteristics of West Tennessee. By integrating remote sensing, geospatial analysis, and geological interpretation, researchers and stakeholders gain valuable insights into land cover changes, subsurface structures, and potential resource reservoirs. As technology continues to advance, these visualization techniques are poised to uncover even more hidden facets of West Tennessee's geological heritage, facilitating sustainable development and informed decision-making [5].
The visualization of Landsat satellite imagery and gravity lineaments mapping in West Tennessee is a dynamic and multidisciplinary endeavor that offers significant insights into the region's geological and environmental characteristics. While challenges in interpretation and analysis exist, the integration of expertise from various fields ensures accurate and meaningful results. As technology continues to evolve, these techniques will likely become even more powerful tools for uncovering hidden facets of West Tennessee's geological heritage. Ultimately, the knowledge gained from these visualizations contributes to informed decision-making, sustainable development, and the preservation of the region's natural resources.
None.
None.
Google Scholar, Crossref, Indexed at
Google Scholar, Crossref, Indexed at
Google Scholar, Crossref, Indexed at
Google Scholar, Crossref, Indexed at
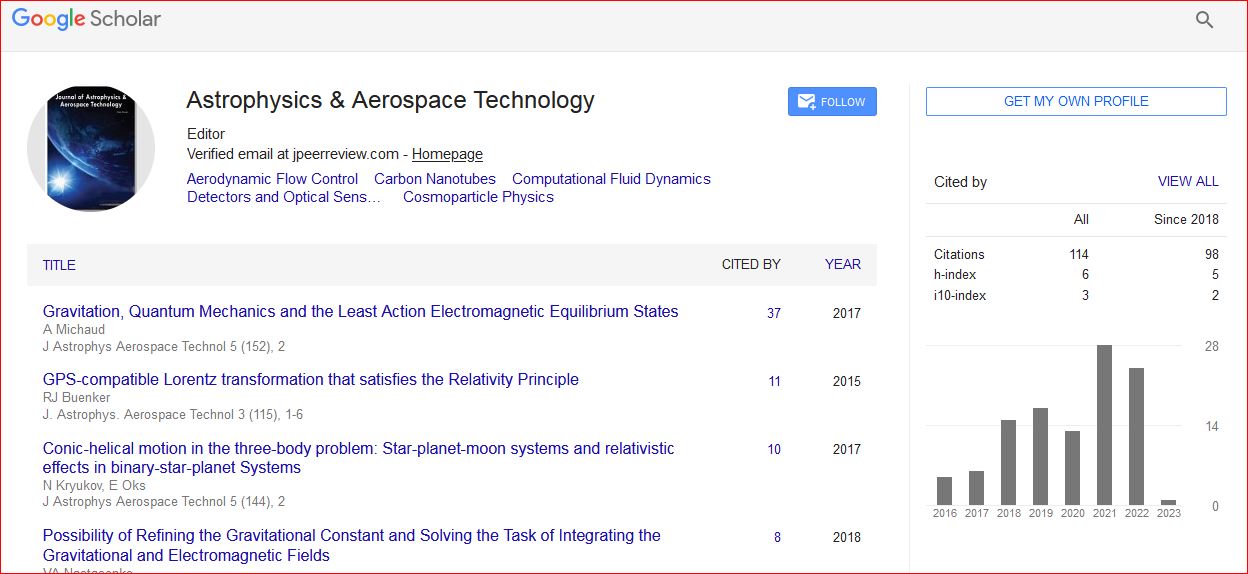
Astrophysics & Aerospace Technology received 114 citations as per Google Scholar report