Research Article - (2025) Volume 14, Issue 1
Received: 30-Oct-2023, Manuscript No. IDSE-23-118850;
Editor assigned: 02-Nov-2023, Pre QC No. IDSE-23-118850 (PQ);
Reviewed: 17-Nov-2023, QC No. IDSE-23-118850;
Revised: 15-Jan-2025, Manuscript No. IDSE-23-118850 (R);
Published:
22-Jan-2025
, DOI: 10.37421/2168-9768.2025.14.469
Citation: Thanaiah, Kumara, Degefa Legesse and Veershetty
Gumtapure. "Thermo-economic Analysis of Humidification-
Dehumidification Desalination System Using Solar Energy." Irrigat Drainage
Sys Eng 14 (2025): 469.
Copyright: © 2025 Thanaiah K, et al. This is an open-access article distributed under the terms of the creative commons attribution license which permits unrestricted
use, distribution and reproduction in any medium, provided the original author and source are credited.
The present study aimed at assessing the energy and economic analysis of Paddy Grass Based Humidification-Dehumidification Desalination (PHDD) using solar energy. The experimental set up of humidifier and dehumidifier was fabricated keeping the humid climatic conditions of the study area. Theoretical analysis of each component of the system was studied and compared with laboratory results. The performance of PHDD system was evaluated by studying various physical parameters such as solar collector area, reservoir water tank volume, and temperature of water reservoir. The cost benefit analysis of the system was carried out by considering the amount of potable water production with the amount of energy consumed and components cost by comparing with other desalination methods. The results revealed that the irrespective of the paddy grass area, the volume of the storage water tank below and above 40 L is considered as optimal. The cost analysis of the present work proved the system can be functioned with low maintenance cost, when compared to other similar studies and the price of the yield comes around 19$/m3. The solar collector area has a significant influence in augmenting the water yield. The optimal ratio of water reservoir to collector area is found to be around 13 L/m3.
Humidification • Dehumidification • Desalination • Paddy grass packing material • Solar energy
Although over 71% of the globe area is enclosed with water, nearly 97.5% of the water is saline in nature comprises enormous quantity of salt [1]. Consequently, desalination technique is more promising solution to solve the shortage of fresh water. There are many desalination techniques such as Multi Effect Desalination (MED), Multi Stage Flash (MSF), Reverse Osmosis (RO), Nano Filtration (NF) and Electro Dialysis (ED) consumes lot of energy. Half of the whole World’s desalination capacity is placed in Middle East, Persian Gulf and Northern African regions. Major desalination plants are available in Saudi Arabia and achieved number one position in the World desalination capacity and approximately 15,906 desalination plants are working all over the world accounts 95.37 million m3/day from 177 countries [2]. At the end of 2017, nearly 50 percent of the plants were RO established technique. However, RO technology is dependent on high pressure energy and also has a maintenance issue [3].
The renewable energy sources such as solar in desalination are a favorable method for production of fresh water due to low grade heat source. In this view, solar driven humidification-dehumidification technique is considered as a favorable technique [4,5]. As per this technique, saline water is heated from the solar energy and moisture is added to air (Humidification). Then, humidified air is made to flow through the dehumidifier where in cold water is circulated indirectly to remove the moisture from the air (Dehumidification) and finally fresh water is produced.
In this research work, it is significant to review, discover and understand the earlier work carried out in the specific related area. Similarly, technical assessment of the experimental work and mathematical modeling on Humidification-Dehumidification (HDH) using solar collectors from the various available papers are listed in the Table 1.
| Year | Author(s) | Brief title | Key findings |
|---|---|---|---|
| 2022 | H. Weifeng | Parametric analysis of HDH desalination powered by photovoltaic system | Thermo-economic analysis investigated along with new packing material in dehumidifier. They found improved is called Gain Output Ratio (GOR) for the system. |
| 2022 | P. Ranjitha Raj | Performance study of humidifier packing for HDH desalination | Experimental and theoretical work is carried out and optimized with 15 packing materials by using Scilab simulation software. |
| 2013 | K. Zhani | Solar desalination based on multiple effect humidification process: Experimental validation | The experimental set up was based on HDH unit was designed and test at Sfax, Tunisia. Theoritical model was established to investigate the thermal performance using C++ programing and validated with experimental results. |
| 2014 | A. M. Abdel Dayem | Solar desalination system using humidification-Dehumidification process | The experimental investigation was carried and conducted at Makkah using solar collector for different weather conditions. They are able to produce 1.6 liters of fresh water for one kWh solar energy. |
| 2016 | G. Wu | Experiment study of multi effect isothermal heat with tandem solar heat | A porous ball humidifier was used. Theoretical study was carried out based on mass and energy balance. The yield increased when the temperature increased from 60â?? to 90â??. |
| 2017 | M. Abu-arabi | Â Experimental study of a solar desalination with HDH unit using rotating surface | A rotating black surface is used to investigate the performance of the system. The yield was 9 liter/m2/day during the summer |
| 2018 | C. Hernandez | Experimental and numerical evaluation of an HDH system driven by solar energy | An experimental and theoretical analysis with closed air and open water was conducted using solar energy at Chile. Measured values were used to optimize the design. |
| 2016 | J. Moumouh | Experimental and theoretical study on HDH unit | Theoretical model is obtained from mass and energy equations. The calculated results were in good agreement with experimental results |
| 2018 | M. Capocelli | Investigation of HDH-Adsorption | Mathematical modelling of HDH with adsorption, along with recirculation was carried out. Maximum reached GOR was 10 from the multiple recirculation of brine. |
| 2018 | A. E. Kabeel | Experimental investigation of hybrid HDH unit | Experimental work on HDH unit integrated with solar energy inserting baffles in the cooler. They found unit performance is improved with increasing water temperature and mass flow rate of air. |
| 2015 | A. Fouda | Experimental work on hybrid HDH unit with A/C system | They found that fresh water production increases with increase in specific humidity and mass flow rate of air. |
Table 1. Summary of the work on experimental study of HDH units with solar collectors.
Use of packing material in the humidifier is one of the attempts to rise the effectiveness of the desalination process using HDH system. The humidification is carried out in the humidifier in which packing materials were used to have a better interaction between the air and water. Those humidifier consists of bubble columns, packed bed towers, and spray towers.
A research gap
There are no studies have been performed so far in which baffle plates are placed in dehumidifier along with new packing material (paddy grass), experimental work and thermos-economic analysis for HDH system. The present work includes the mathematical model for each components of the system to assess the performance [6].
Paddy grass
Paddy grass, also known as rice straw, is the stalks and leaves of rice plants that are left over after the grain has been harvested. This is a generally accessible, non-contaminating material. Figure 1 shows the genuine image of paddy grass pressing material [7].

Figure 1. Picture of the paddy grass (a) Two layers (b) Three layers.
Assumptions
• The quantity of paddy grass utilized is 1600 each having breadth of 0.005 m and length 0.4 m.
• The packing density of the paddy grass is 157.07 kg/m3 with the surface territory of 10.05 m2.
Methods
The current work is carried out by two methods, an analytical and experimental analysis are carried out to assess the humidification and dehumidification processes.
Experimental details
The experimental arrangement consists of two parts such as humidification and dehumidification parts. Humidification part involves various fittings like water circulating pumps, water sprayers, air blower, and air heating source. Dehumidification part involves a number of copper pipes and baffle plates in order to get the cooling effect and condense the air to produce the fresh water [8].
Working procedure: In order to begin the humidification process air is initially drawn in to the air chamber from the blower and heated using the air heater as shown in Figure 2. The location 1 where in temperature and humidity sensors are placed for measurement. There will be reduction in temperature of air results in increased moisture adding capability. The hot air is sent from the bottom part of the humidifier. The saline water is heated from the secondary heating source which is located close to the top portion of the humidifier. The hot saline water is sprinkled from the two sprayers over the paddy grass humidifier which helps in better mixing of air and water and finally air absorbs moisture and humidified. The unabsorbed extra water is accumulated in water reservoir tank. The water pump is utilized for circulating the water in a closed cycle. The hot humid air is sent to the dehumidifier where in the moisture content condensed on the surface of copper coils and baffle plates placed inside the dehumidifier. Air velocity is measured with the help of Anemometer while water flow is measured using Rotameters. Psychrometers were placed at three various positions such as humidifier inlet and exit and at the exit of dehumidifier as shown in the Figure 2.

Figure 2. Block diagram of the humidification dehumidification unit.
Experimental components
• Heat source: The capacity of air heater is 500 W and water heater is 10 kW.
• Humidifier: The addition of moisture content to air is done in a closed hollow humidifier having square profile cross section 0.4 and height of 1 m.
• Dehumidifier: The removal of moisture content from the air is carried out in dehumidifier having a V-shaped hollow conduit with various baffles inside the conduit and with the help of copper coil.
• Baffle plates: Baffle plates having a dimensions 0.3 cm thickness and 16 cm length are welded inside the dehumidifier conduit to rise the condensation process. The total number of plates used are 6 with a gap of 16 cm between them.
• Water sprayer: The topmost part of the humidifier is kept with water sprayers in order to improve the interaction between air and water. Each sprayer contains 36 number of small holes with 0.8 cm distance, which helps in breaking the liquid in to small droplets.
• Storage tank: In order to supply the saline water continuously a saline water reservoir tank of 50-liter volume is provided [9].
• Air blower: The air is drawn over the inlet air passage and is heated with the aid of air heater and further directed to the air blower having a specification of 500 m3/hr with inlet and outlet diameters of 7.5 and 8 cm. The supply of air is up to 50 meters with a velocity of 1000 rpm.
• Potable water collector: One-liter volume measuring container is kept under the dehumidifier unit.
• Thermocouples: The thermocouples utilized are of K-type with specifications of 0.3 cm diameter and 2 m length and in work range of -200 to 1200°C with an accuracy of ± 0.15°C and uncertainty of 2%.
• Psychrometer: To examine the concentration of humidification the dry air-dry bulb and wet bulb temperature is measured (Figure 3).

Figure 3. Schematic view of (a) Humidifier with packing material (b) Experimental view with inlet duct to humidifier, blower and water heat source.
Mathematical modeling
Solar water heater: In order to increase the solar radiation utilization, the concentrated kind collector like Parabolic Trough Solar Collector (PTSC) is used. PTSC contains of cylinder-profile with a tubular receiver. The radiation absorbed by the PTSC is given by

Where,
Ib is the existing beam radiation reflectivity, and τα is the product of transmittance absorptance.
Convection and radiation heat loss is expressed using the following equation

Where,
hw is the outside heat transfer co-efficient, Ta is the ambient temperature, and Tsk is the sky temperature.
Radiative heat transfer loss: The radiative heat transfer from the receiver to the covers inner surface is given by SP Sukhatme.
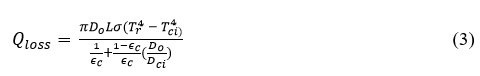
Where,
Do is the outer diameter of the receiver, Dci is the cover inner diameter length of the collector, σ is Stefan-Boltzmann’s constant, Tr is the receiver temperature is the cover inner temperature and ϵc is the cover emissivity [10].
The conductive heat loss through the cover thickness is given by
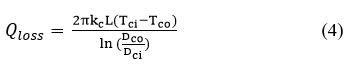
Where,
kc is the thermal conductivity, Tco is the cover outer temperature, and Dco is the outer diameter.
The total heat loss is given by the following equation:
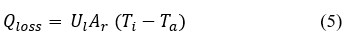
Where,
UL is the overall heat transfer coefficient and Ar is the receiver area. hw is calculated using Nusselt number correlation for the flow of air along a tube in an outdoor environment as:
Useful energy gain is obtained by subtracting the total heat loss from the captured radiation expressed as
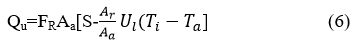
Where,
FR is heat removal factor
Collector flow factor is written as follows:
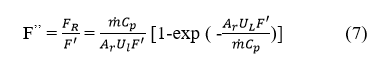
Where,
F’ is Collector Efficiency factor is expressed as given below

Useful energy gain in terms of collector inlet and outlet temperature is expressed as

Where,
To is the outlet temperature
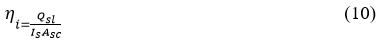
The instantaneous solar collector efficiency is obtained from the following expression,
Water storage tank: The energy equations for the water storage tank is expressed as:

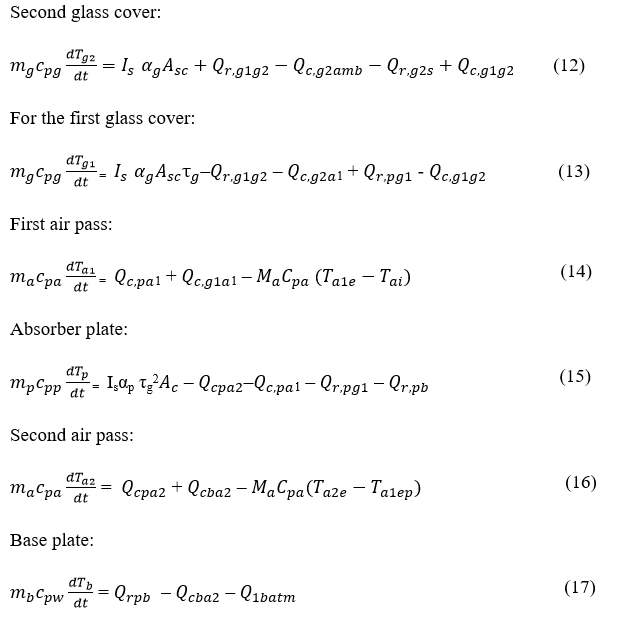
Solar air collector: The solar air heater was utilized for to heating the inflow atmospheric air to the humidifier. The energy balance equations for the solar air heater are as follows:
Paddy grass humidifier
Overall heat and mass transfer in the paddy grass humidifier: In the paddy grass packing humidifier, hot saline water sprayed from top of the humidifier the over the bundles of grass material while air is flowed from the bottom [11]. In view of a large number of grasses which were filled in the humidifier it is tough to model directly, so in order to simplify the problem, a counter flow heat exchanger model is considered (Figure 4).

Figure 4. Schematic of paddy grass humidifier (a) The diagram of structure of module (b) Representation of model calculation.
During the humidification process, heat and moisture between saline water and the air is governed by the following equations:
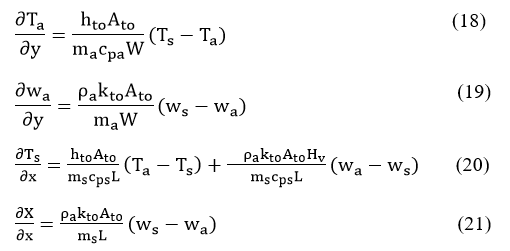
Where,
s stands for solution and a for air respectively, Hv is evaporation heat of vapor, w is humidity, ws is the phase equilibrium humidity of the air with the saline water at the concentration of Xs and the temperature of Ts.

The total resistance consists of three components such as solution component, air component and paddy grass component. Heat transport and mass transport are written as follows:

Where,
d is the diameter of the paddy grass, K is the thermal conductivity and D is the moisture diffusivity.
The convective heat transfer coefficient (h) and mass transfer coefficient (k) of the air and saline water are denoted by Nusselt number and Sherwood number and written as follows:
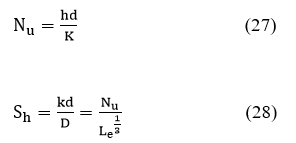
Where,
K is the heat conductivity, Le is the Lewis number and D is the diffusivity.
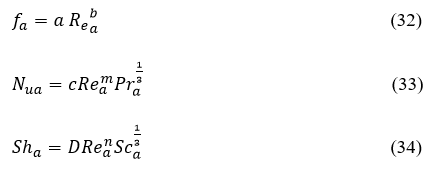
The effect of this paddy grass on the system performance is the major focus of this research and its characteristics depends on the moisture diffusivity (D), heat diffusivity (K) and the capacity of volume of humidifier [12]. These are the parameters to be examined in this work. Furthermore, the area of the paddy grass also investigated. Reynold number for air and solution across the grass tubes are far below 2300. Therefore, air and solution may be considered as a laminar flow. Hence the following equation can be used as fully developed laminar heat transfer around the tubes. Nusselt number of air stream are expressed as.
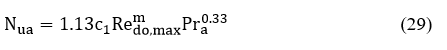
Where,
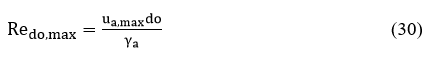
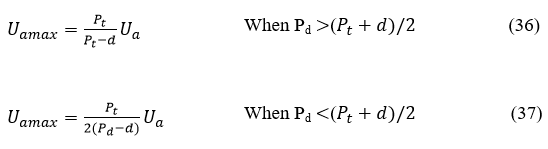
c1 and m are constants and are calculated using the following table. Pr is the Prandtl number and Redo, max is calculated using:
The pressure drop of the solution for laminar flow around the paddy grass is given by:
Flow characteristics for air stream has been investigated by and used presently in this study and they are given as follows:
The constants a, b, c, D, m and n are obtained from the geometric configurations of the paddy grass humidifier. The applicability of these correlations is for the Reynold numbers up to 500 and the module Packing Fraction (PF) 0.2 to 0.6. Therefore, in this research, the Reynold number is 210 and the PF is 0.512. Hence the above correlations can be used in this research. The constants are a=4.299, b=0.363, C=1.98, m=0.443, D=3.402 and n=0.374. Sc is Schmidt number and Pr is the Prandtl number respectively [13].
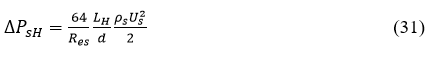
The pressure drop across the air stream in the humidifier is given by
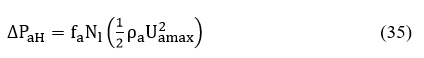
Where,
Nl is the number of grass fibres in the humidifier and it is equal to 1600 in this work.
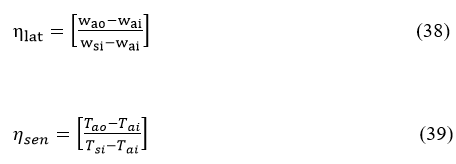
In order to analyse the heat transfer and mass transfer properties of the paddy grass humidifier two terms are defined known as latent effectiveness and sensible effectiveness as follows:
Dehumidifier: The dehumidifier component in the HDH unit is a fin-tube kind heat exchanger. Indirect contact between hot humid air and feed water takes place through the gap between fins and tube. The shape of the humidifier is V-shape hollow structure one end of which hot humid air enters and leaves from the other end. As reported in the literature polymeric solid hollow fibre type heat exchanger is efficient when compared to shell and tube [14].
To study the performance of the dehumidification process in the dehumidifier, the ε-NTU method is implemented (Figure 5).

Figure 5. Schematic drawing of the dehumidifier.
The effectiveness can be written as:
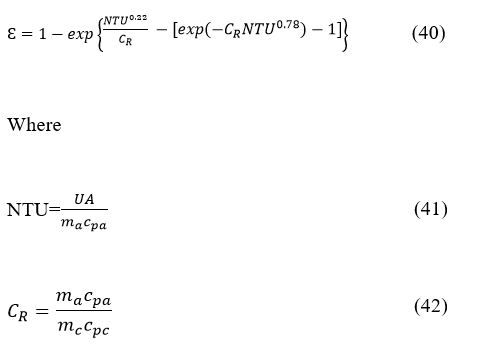
The total heat resistance (1/UA) is expressed as
Where,

The middle term of the right hand side of the equation Rwl is the resistance of the wall and ηf is the efficiency of the fin, Ai is the inner surface area of the copper tube and Aa is the heat exchanger area in the air side. The first and last term of the right hand side of the equation are tube side resistance and air side resistance respectively.
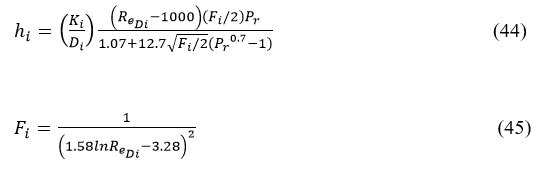
During the experimental work the cold water flow rate is 0.05 kg/s and the corresponding Reynolds number is 15300 which is more than 4000. Therefore, flow is considered to be turbulent. Hence, the convective heat transfer coefficient of the water in the expression can be calculated from the following expression [15].
The heat transfer coefficient ha for the air side of the dehumidifier is expressed with:
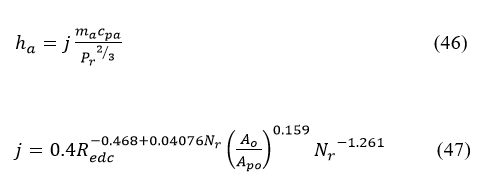
Where, ma the mass flow rate of through fins, Ao is the external surface area of the tubes and Apo is the total heat exchange area respectively.
Performance indices: In order to assess the performance of the system, three parameters are defined and they are as follows:
Gain Output Ratio (GOR), Coefficient of Performance (COP) and electric COP (COPE):
The ratio of latent heat of evaporation to total heat supplied to desalination unit is called Gain Output Ratio (GOR). GOR is an important performance parameter used for humidification and dehumidification processes. It describes the energy evaluation of the desalination plant and all other thermal desalination techniques [16].
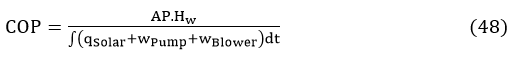
Where,
Hw is the latent heat of condensation of water, AP System capacity. Similarly,
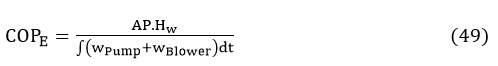
Where,
Wpump and, Wblower are the power consumption of pump and blower respectively and are expressed as:
Where,
ηBlower and ηpump are efficiencies of blower and pump respectively.
The power spent by the electric heat source to enhance the temperature of the water flowing though the humidifier paddy grass can be calculated using:

Similarly, for air heater,

Instantaneous fresh water production (IP) and Accumulated water production (AP) are well-defined as:

Where ωdai and ωdao are moisture content at the in and out of the dehumidifier.
Specific Energy Consumption (SEC): Specific energy consumption is the amount of fresh water produced per unit volume of water [17].

Calculation procedure
The comprehensive solution method is presented in the flow chart as shown in the Figure 6.
• Inlets operational conditions such as mass flow rate, fresh water volume collected, inlet temperature, humidity (input and output states), mass flow rate of air, saline water, the concentration (x), the equipment parameter such as solar collector, humidifier, dehumidifier, water reservoir tank etc.
• Assume initially values of the temperature and volume of the saline water inside the saline water reservoir tank (Tsi, Vsi).
• The saltwater concentration is computed from the entire mass of the NaCl and the volume of the reservoir tank at temperature. • Initial temperature difference (dt) is assumed.
• Guess the set inlet temperature (Ti) to the water collector reservoir as (Ti+dt). Take the solar intensity data, atmospheric temperature. Equation (1)-(10) are used to compute oulet temperature of the solar collector, energy received from the collector and its efficiency.
• Compute heat reservoir temperature. Now, estimate fresh temperature difference and if there is a deviation is within the limit then go to step 7, or else assign and go to step 5 until convergence is achieved.
• Inlet temperature and concentration to the humidifier is equivalent to present solution temperature and concentration in the heat reservoir tank. Now, compute the Equation (18) (28) for the humidifier and estimate the outlet temperature and saltwater concentration from the humidifier. Compute the air temperature and humidity for the humidifier. Finally, compute exit heat load. • Taking the exit temperature, humidity of air from the humidifier as an input temperature, air humidity as input to the dehumidifier. Compute the Equation (39)-(47) to obtain the exit temperature, humidity and enthalpy of the air coming out of the dehumidifier. Compute the output cooling water temperature of the dehumidifier.
• Equations are used to solve temperature and volume of the heat storage reservoir. If the computed and initial assumed values are within the limit then move to the step (10) or consider the average of these values and move to (3) till it converges.
• Now, move to time interval i=i+1 and send back to (2) till the expected time is achieved. Finally, compute the performance parameters [18].

Figure 6. Flow chart for the solution method in simulation for the entire system.
Model validation
The theoretical present model outputs are compared with the experimental outputs in order to verify the validity. Many influencing parameters available from the previous literature work are considered in this work as well. These are inlet saline water, air flow rates in to the humidifier unit and the packing fractions. The specification of the humidifier is square cross section of 0.40 m by 0.40 m, the flow rate of the saline water is 0.04 kg/s, inlet flow rate is 0.004 kg/s at 35°C and relative humidity of 60%. The initial saline water temperature of the storage take was fixed at 40°C with the concentration of 3.5% and capacity 90 L. The cold water flow rate to the dehumidifier is 0.04 kg/s [19]. The experiment was done on 12th August 2018 and measured solar radiation and atmospheric temperature at Surathkal, India is represented in the Figure 7.

Figure 7. Solar radiation and atmospheric temperature against time duration on a typical day of the August 2018. at Surathkal, India.
As it is seen, the understandings between the determined and the experimental outputs are acceptable. The relative deviations between the determined and the tried estimations of Ts and accumulated production within are 2% and 4.5%respectively as shown in the Figure 8. Accordingly, the theoretical model is valid and could be utilized to examine the performance.
Experimental and computational results
To evaluate the production of fresh water and paddy grass humidifier outlet temperature, measured inlet water and air temperature are used as an input values to the numerical model. To confirm the model, a reasonable study was carried out between mathematical modeling and experimental results and is shown in the Table 2. The maximum variation for the above performance indices is 6.1%. As observed from the Figure 8, the variations are less than 2% for tank water temperature. The variation of measured and experimental values are within 5% and 6% for latent effectiveness and sensible effectiveness respectively and shown in the Figure 9. Therefore, the theoretical mathematical model can be used to analyze the system performance for the three different cases such as paddy grass packing, polypropylene and without packing. Paddy grass packing properties namely moisture diffusivity, thickness and area are considered in detail for the study [20].

Figure 8. Tested and calculated water tank temperature for different two different packing.
| Packing material | Apcal (kg/day) | Aptes (kg/day) | Error (%) | SECcal (kWh/m3) | SECtes (kWh/m3) | Error (%) | COP (cal) | COP (Test) | Error (%) |
| Paddy grass | 7.35 | 7.14 | 2.91 | 22 | 21 | 4.5 | 0.65 | 0.61 | 5.3 |
| Polypropylene | 4.65 | 4.23 | 4.2 | 23 | 22 | 4.3 | 0.4 | 0.37 | 5.2 |
| Without packing | 3.5 | 3.3 | 5.7 | 20 | 21 | 4.7 | 0.3 | 0.28 | 6.1 |
Table 2. Calculated and measured system performance during the operation of the packing materials.

Figure 9. The deviancy between the experimental and calculated latent effectiveness and sensible effectiveness (a) Latent effectiveness (b) sensible effectiveness.
Solar collector performance
The solar collector is a one of the significant components of the HDHD system. The maximum amount of energy is collected from this element. Accordingly, evaluation of collector on the performance is important for the whole system. Hence the degree of its performance is the collector efficiency and is given in the Equation (56) and is well-defined as useful solar energy collected over a period of time to available solar radiation. Under these conditions, the instantaneous collector efficiency is plotted as a linear function of the term (Tfi-Ta)/Is:

From the above equation, the maximum efficiency of the collector will reach 64 when the second term of the right hand side is zero which means the temperature of the water collector is same as that of the atmospheric temperature. Hence, the u-tube evacuated collector is having better performance efficiency with plate collectors. The instantaneous collector efficiency with the time is shown in the Figure 10. The variation of efficiency is from 0.35 to 0.52 and attains peak at about 10 am (nearly 80 percent of noon period) because of the solar energy is nearly 450 W/m2 whereas the change in the temperature Tfi and Ta is not very high. Consequently, the ratio of temperature difference to Is, is very low and hence efficiency reaches highest value.

Figure 10. Variation of instantaneous collector efficiency with time.
Effect of saline water volume in the storage tank
The simulation of saline water tank is carried out for different volumes of water. Initially, the system is operated with saline water temperature of 50 starting with 6 am till the temperature is lower than 50 during the afternoon. The optimum collecting area is 4.2 m2 (Figures 11-18).

Figure 11. Effect of tank volume on the water temperature in the water tank through the working.

Figure 12. Effect of tank volume on the instantaneous water production through the working time.

Figure 13. Effect of solar collector area on the water temperature in the water tank through the working time.

Figure 14. Effect of collector area on the instantaneous water production through the working time.

Figure 15. Variation of accumulated fresh water production with tank water volumes.

Figure 16. Variation of coefficient of performance with tank water volumes.
Effects of solar collector areas

Figure 17. Variation of accumulated fresh water production with solar collector area.

Figure 18. Variation of coefficient of performance with solar collector area.
Economic evaluation
Economic factor shows a vital part in finding the projected desalination system decision. An economic calculation is carried out to know the final cost for the water yield.
Considering that the necessary cost for the desalination system is borrowed from the bank, yearly interest payment for the principal cost is calculated from the product of principal cost and the amortization factor an and is expressed as:

Where, I is the yearly interest rate, n is the lifespan period of the system. The parameters and assumptions made for the economic calculation is listed in the Table 3.
| Factors | Unit | Value |
| System capacity (AP) | kg/day | 7 |
| SEC | kW/m3 | 20 |
| System availability (F) F. Banat | 0.9 | |
| Life span (n) F. Banat | year | 20 |
| Interest Rate (i) S. Al-obaidani | - | 5% |
| Amortization Factor (a) | - | 0.08 |
Table 3. Factors used in calculation of economic investigation.
The working conditions are 40 L storage saline water tank, 4 m2 collector area and a paddy grass humidifier. Under these conditions, the AP is 7 kg/day. The specific energy consumption is 20 kWh/m3, it indicates that the electrical energy utilization is very less compared to traditional desalination system like Multi stage flash and reverse osmosis MA Darwish and S Bouguecha. The consumption of electrical energy rate at Surathkal as of 2018 is 0.2 $/kWh.
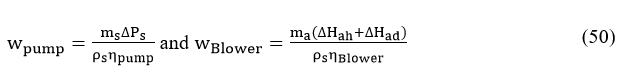
The yearly principal and operational cost ACost is the sum of yearly direct principal cost AFixed and yearly operational and maintenance cost AOM is expressed as:
Where,
CFixed the whole asset of the system is, APaddy is the paddy grass replacement price bearing in mind of fouling due to salt. AElec and AMaita are the yearly electricity price and yearly maintenance price respectively. The water production price of the system can be expressed as:
WPC=ACost/(AP × F × 365)) (62)
where,
F is the system availability and its value is 90 percent per anum.
Fixed cost, operational cost and WPC are tabulated in the Tables 4 and 5. It is comprehended from the table that the solar collector price adds to nearly 60% of the entire price of the system. Yearly operational and maintenance price is about 30% of the entire water production price and the final price of the water production is 19 $/m3 which is similar to the other small capacity desalination system.
| Part | Unit cost | Quantity | Approximate cost |
| Fixed cost | |||
| Blower | 35$ | 1 | 35$ |
| Pump | 30$ | 2 | 60$ |
| Humidifier | 50$ | 1 | 50$ |
| Paddy grass | 0.5$ | 10.7 m2 | 5.3$ |
| Dehumidifier | 80$ | 1 | 80$ |
| Pipe fittings and instruments | 25$ | - | 25$ |
| Solar collector | 100$/m2 | 2 | 200$ |
| Storage tank | 900$/m3 | 0.05 | 40$ |
| Total fixed cost (CFixed) | 495.3$/year | ||
| Yearly fixed cost (AFixed) | 99$/year | ||
| OM cost | |||
| Electrical energy cost | 0.2 $/kWh | 73 kWh/year | 14.6 |
| Paddy grass replacement (APaddy) | 10% per anum | 10$ | 1$/year |
| Maintenance (AMaita) | 15.6$/year | ||
| Yearly OM cost (AOM) | 31.2$/year | ||
| Acost | 130.2$/year | ||
| WPC | 19$/m3 | ||
Table 4. The results of cost for principal investment, operational and maintenance.
| Year | Desalination process | Energy source | Humidifier area | Production (L/day) | WPC ($/m3) |
|---|---|---|---|---|---|
| 2011 | ED-PV | 25 k Wp PV | - | 10000 | 2.38 |
| 1998 | MED-solar | 38 m2-solar collector area | - | 505 | 80 |
| 2017 | HDH | Waste heat and electric energy | 14 m2 | 15 | 10 |
| 2006 | MSF | Steam and electric energy | - | 5000 | 2.66 |
| 2005 | Solar still | 3 m2-basin area | - | 7.5 | 50 |
| 2020 | HDH | Solar energy | Paddy grass-10.7 m2 | 13 | 19 |
Table 5. Final cost of the water and comparison with other desalination system.
The availability of fresh water in isolated and dry regions is scarce. Desalination technique is an excellent solution to overcome the scarcity of fresh water. Conventional techniques are well suitable for large-scale production. However, affordable and efficient potable water production methods have become a challenging issue especially in remote parts of the world. In this view, HDH process is considered as a promising desalination technique to produce potable water in remote areas. Viability of solar energy based and paddy grass humidification dehumidification system has been investigated in the present work. A theoretical mathematical model was established for each components of the system. These are the inferences generated from energy and economic analysis.
• The thermal energy reservoir is a significant part to resolve the variation in solar radiation. So, the system can operate when there are less sunshine hours and during the night time. Irrespective of the paddy grass area, the volumes of the storage water tank below and above 40 L are not considered as optimal.
• The solar collector area also significant in augmenting the accumulated water yield. In the present study the optimal ratio of tank volume to area is found to be around 13 L/m2.
• The cost analysis of the present work proved the system can be functioned with low maintenance cost, when compared to other similar studies, the price of the yield comes around 19$/m3. Hence this technology is suitable for smaller communities with acceptable price cost.
Paddy grass materials can be selected as a substitute of artificial materials to achieve high production rate and cost-effective and reliable operation of humidification and dehumidification desalination plants. The solar collectors price is more when compared to other units of the system and if it is minimized with the forthcoming research work, then the water production cost will come down considerably.
• Usage of geothermal energy source or biomass energy source may result in constant and better yield compared to solar HDH technique.
• HDH desalination process, with paddy grass as a packing material, may be adopted for waste water treatment in coffee processing plants.
• The present research can be extended using nano particles with different volume fractions to increase heat transfer rate and system yield.
The authors declare no conflict of interest.
[Crossref] [Google Scholar] [PubMed]
Irrigation & Drainage Systems Engineering received 835 citations as per Google Scholar report


